
Today, we’re pulling back the curtain on a system designed to perform in every market condition, built using a tool I’ve been developing behind the scenes: the Strategy Lab.
Since 2019, a single, simple system returned over 3,800%, delivered 10x the performance of dollar-cost averaging, and more than doubled the outcome of traditional buy-and-hold.
By the end of this article, you’ll see how this tool lets you test and define your own strategies with any indicator on our platform, and why building repeatable, resilient systems is the edge you need most in a volatile Bitcoin market.
Let’s get into it.
Key insights
Sentiment Momentum: Measuring the rate of change in fear provides more actionable alpha than raw F&G index levels.
The Power of Filtration: Combining sentiment with trend and capitulation filters significantly reduces drawdowns and avoids false rallies.
Risk-Adjusted Dominance: High raw returns are secondary to maintaining institutional-grade Sharpe and Calmar ratios for long-term survival.
Statistical Robustness: Monte Carlo simulations prove that a strategy’s success stems from a genuine edge rather than luck.
Moving Beyond Static Sentiment
For today’s strategy, we’re taking a simple but powerful metric, the Fear and Greed Index, and showing how a small refinement can turn it into a far more effective system, one that meaningfully outperforms traditional approaches without adding much complexity.
Now most traders approach the Fear and Greed Index in a straightforward way: when fear is extreme, buy; when greed is extreme, sell.
On the surface, it seems intuitive, even obvious. But that simplicity masks a fundamental flaw. A single reading tells you nothing about direction. It doesn’t indicate whether fear is peaking, whether sentiment is beginning to recover, or whether the market is still accelerating lower.
What’s missing is context, because markets do not move in straight lines. Fear builds gradually over weeks, and greed tends to creep in slowly over time, so treating a single number as a signal becomes an invitation for panic and reactionary decisions.
That is exactly why the concept of Fear and Greed Cadence is so powerful. Instead of focusing on a static level, you measure how sentiment is changing over a defined period, such as 90 days. By subtracting the reading from 90 days ago from today’s value, you can immediately see whether sentiment is improving or deteriorating.
When that change moves from negative to positive, it signals that momentum has shifted and fear is starting to ease, potentially marking the beginning of a more constructive phase. When it moves from positive back to negative, it shows that sentiment is rolling over and momentum is turning down, which becomes a clear signal to step aside.
What was once a blunt, static indicator becomes a structured, rule-based measure of market momentum that can be acted on with consistency.
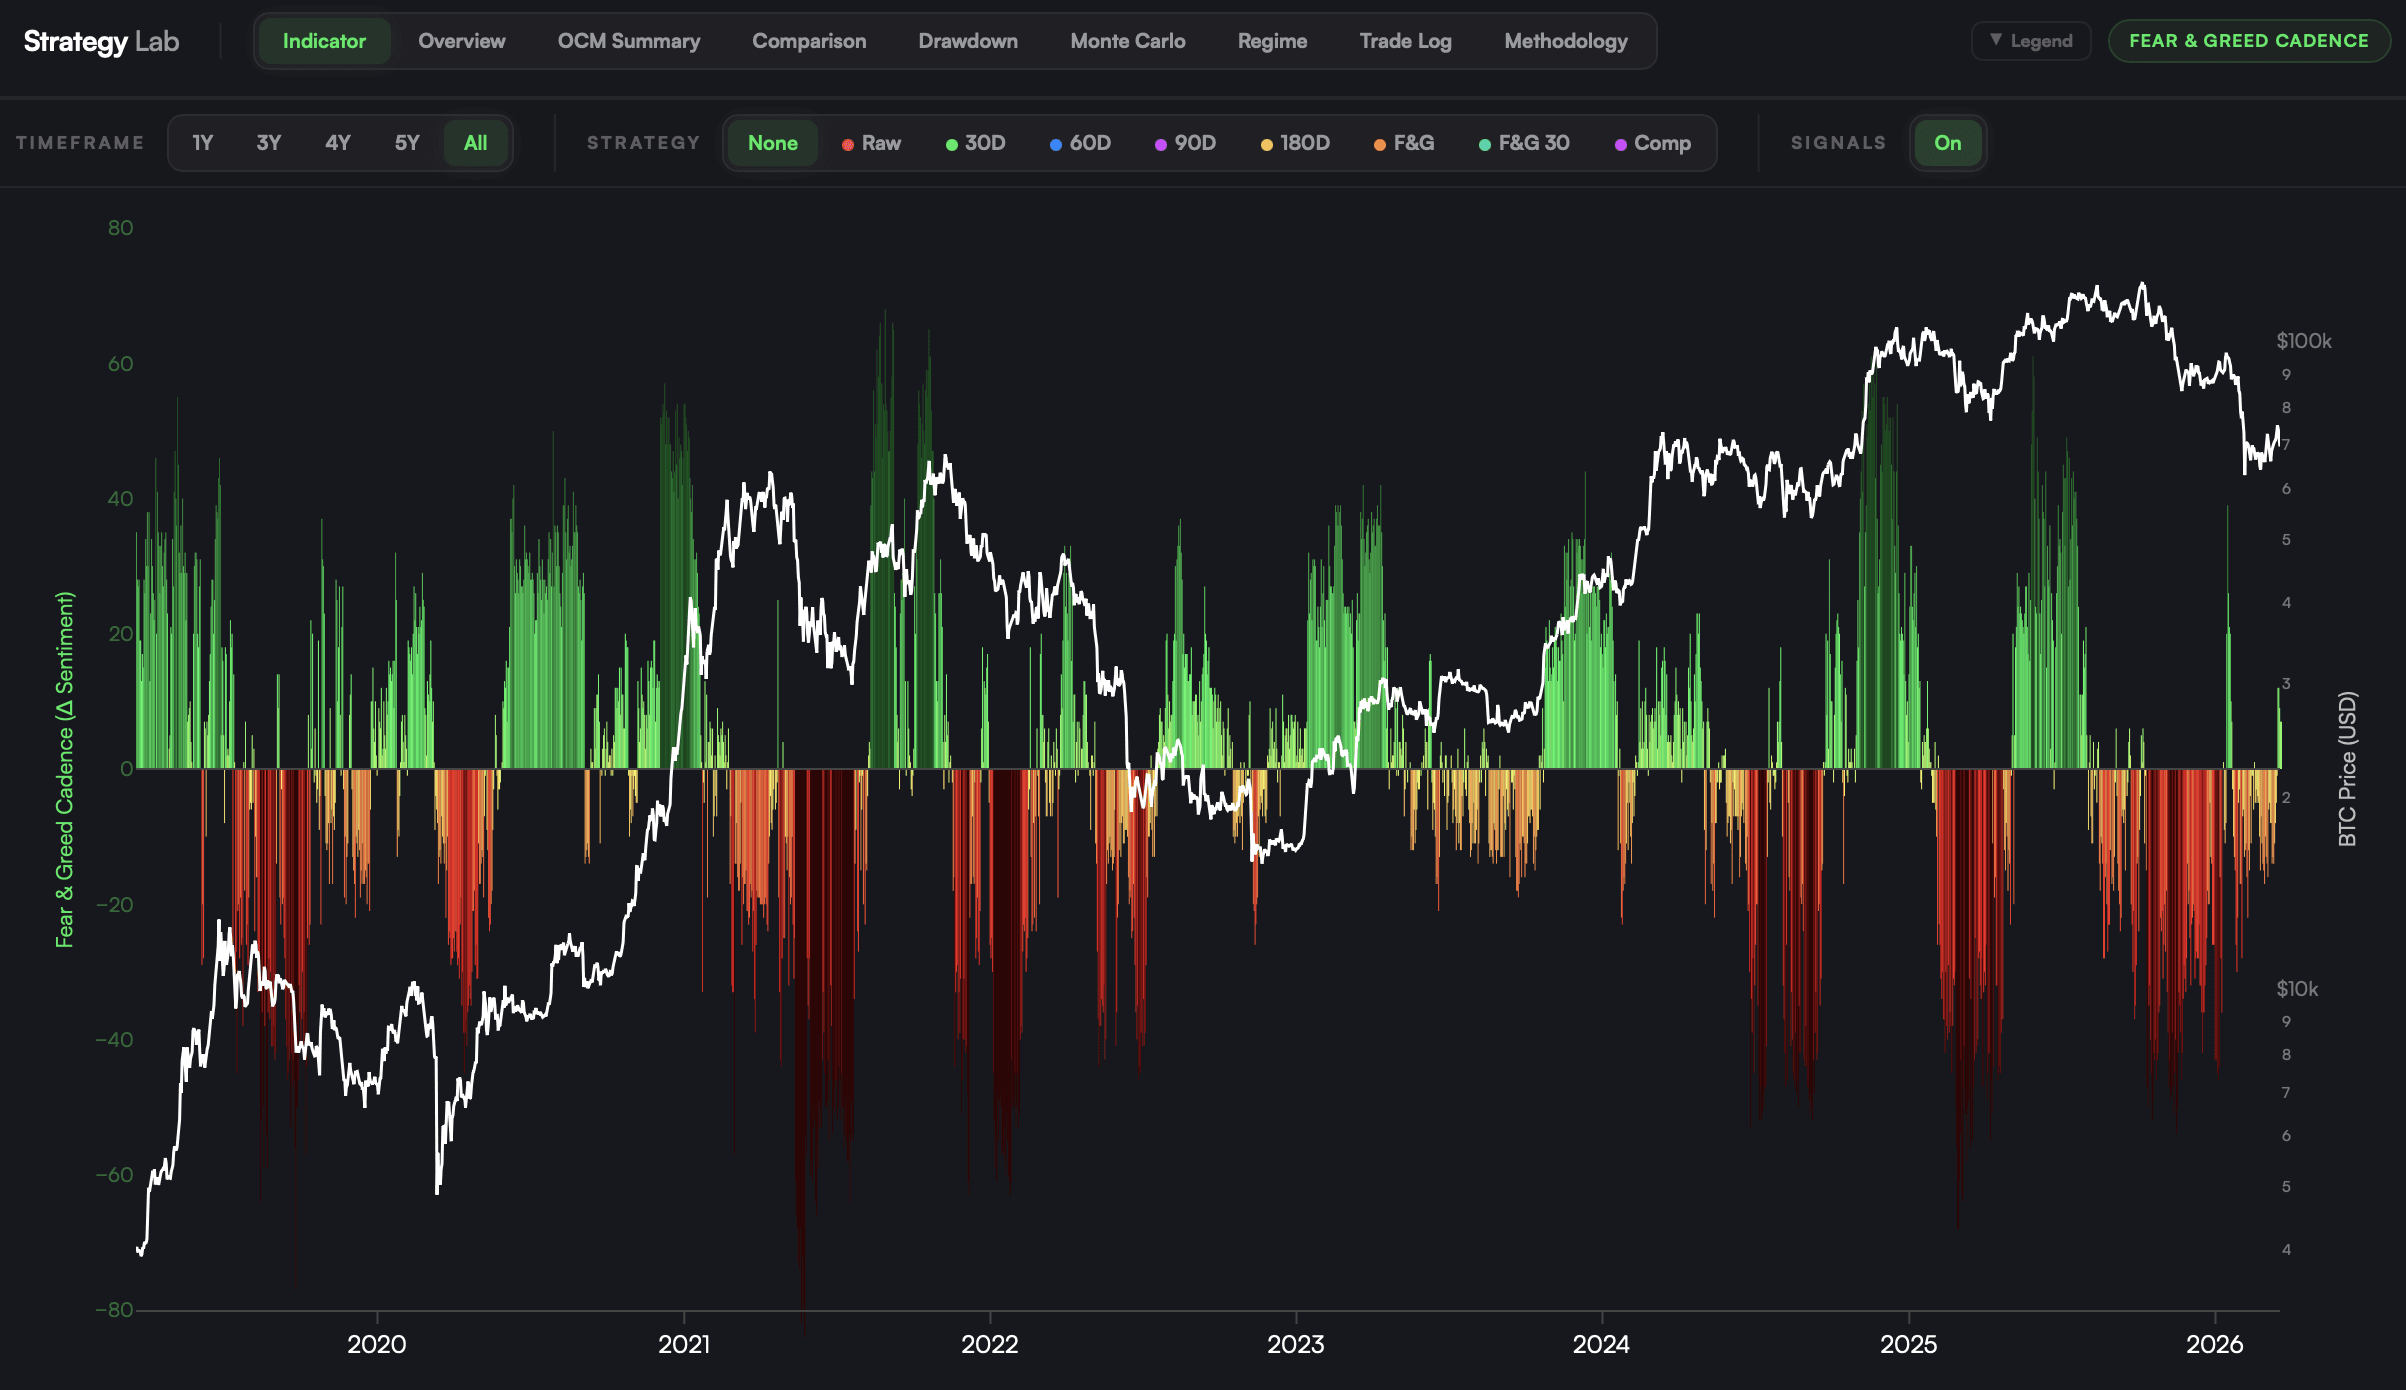
View live in OCM Studio: Raw Fear & Greed Cadence
Institutional-Grade Alpha
We’ve repeated this mantra time and time again: a single metric is not enough to build a robust strategy. To move from an indicator to a system, you need confirmation.
The “Composite” approach adds 3 simple conditions:
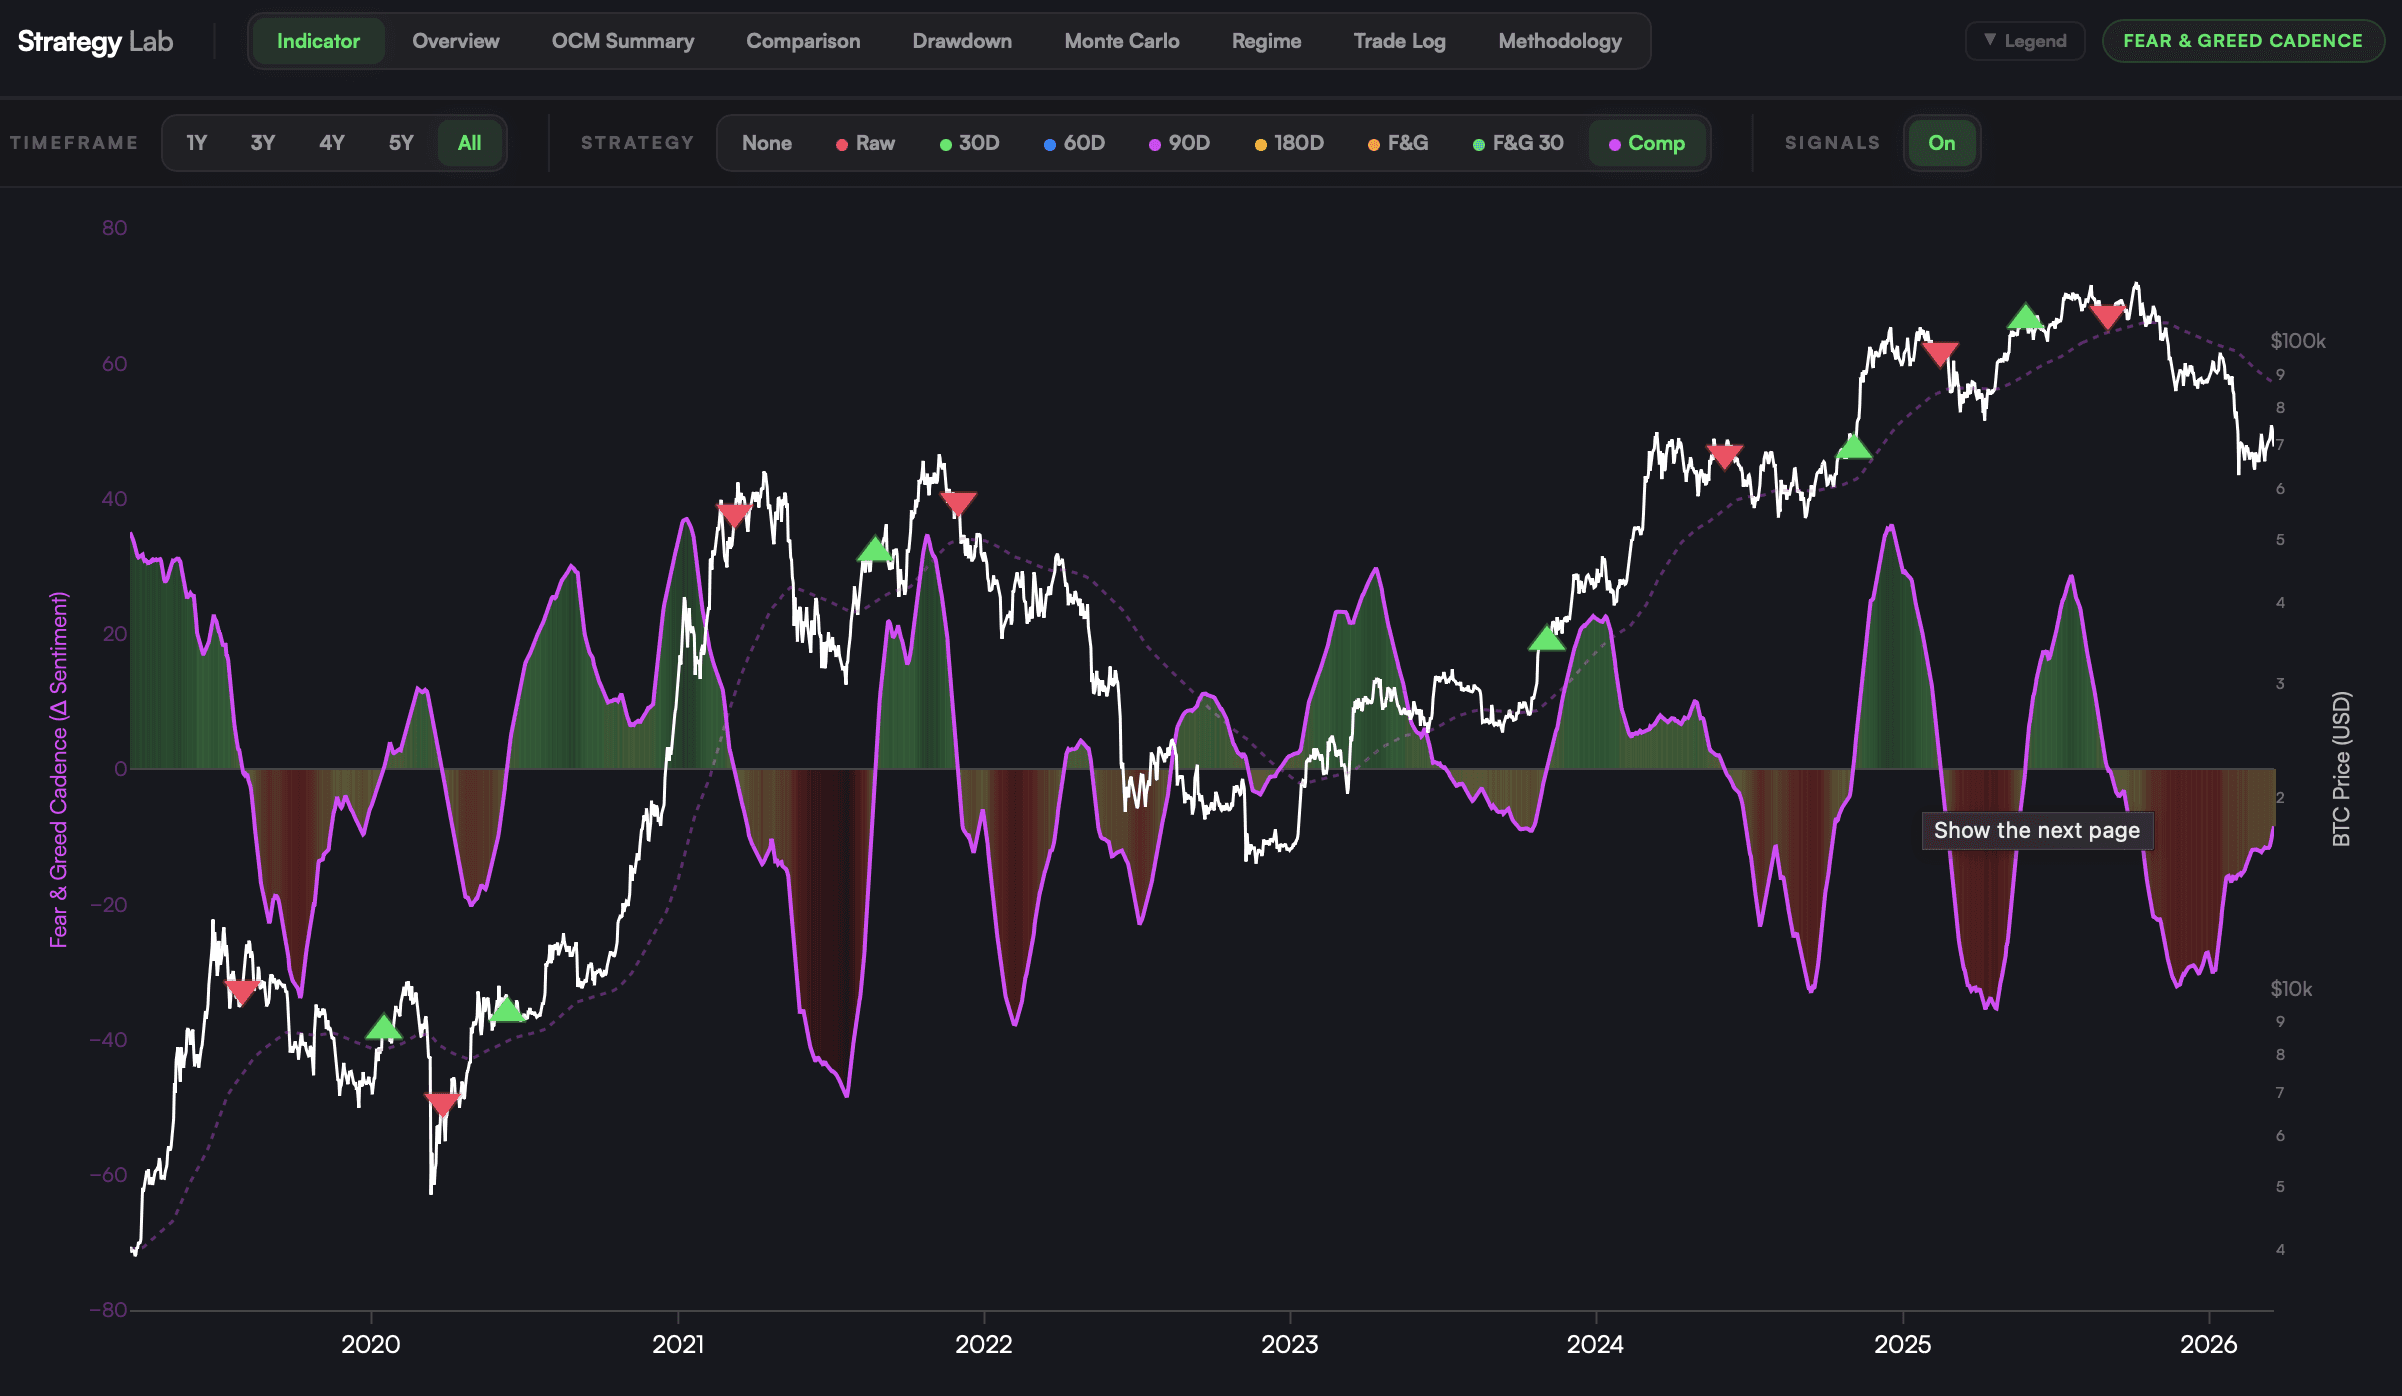
Sentiment momentum must turn positive: the 60-day smoothed Cadence must cross above zero.
The trend must be aligned: Bitcoin must be trading above its 200-day EMA to avoid buying into broader downtrends.
The Fear and Greed Index must be > 20: this keeps us out of unstable, capitulation-driven environments.
The exit is where the asymmetry comes in. Entry is selective, but the exit is immediate. The moment Cadence drops back below zero, the position is closed and moved to cash. No delays, no additional filters. Slow on the way in, fast on the way out.
That discipline drives the results. Since 2019, this strategy has taken $10,000 to roughly $392,000, compared to about $173,000 for buy-and-hold.
It also does it with less drawdown and far less exposure. Max drawdown falls from 76% to 56%, with just 13 trades in total and only 39% time in the market.
Fewer decisions, less exposure, better outcomes.
Why "Lucky" Isn't a Strategy
A common trap in backtesting is overfitting, where a strategy looks perfect on historical data but breaks down in real conditions. To address this, we use Monte Carlo and risk-adjusted analysis.
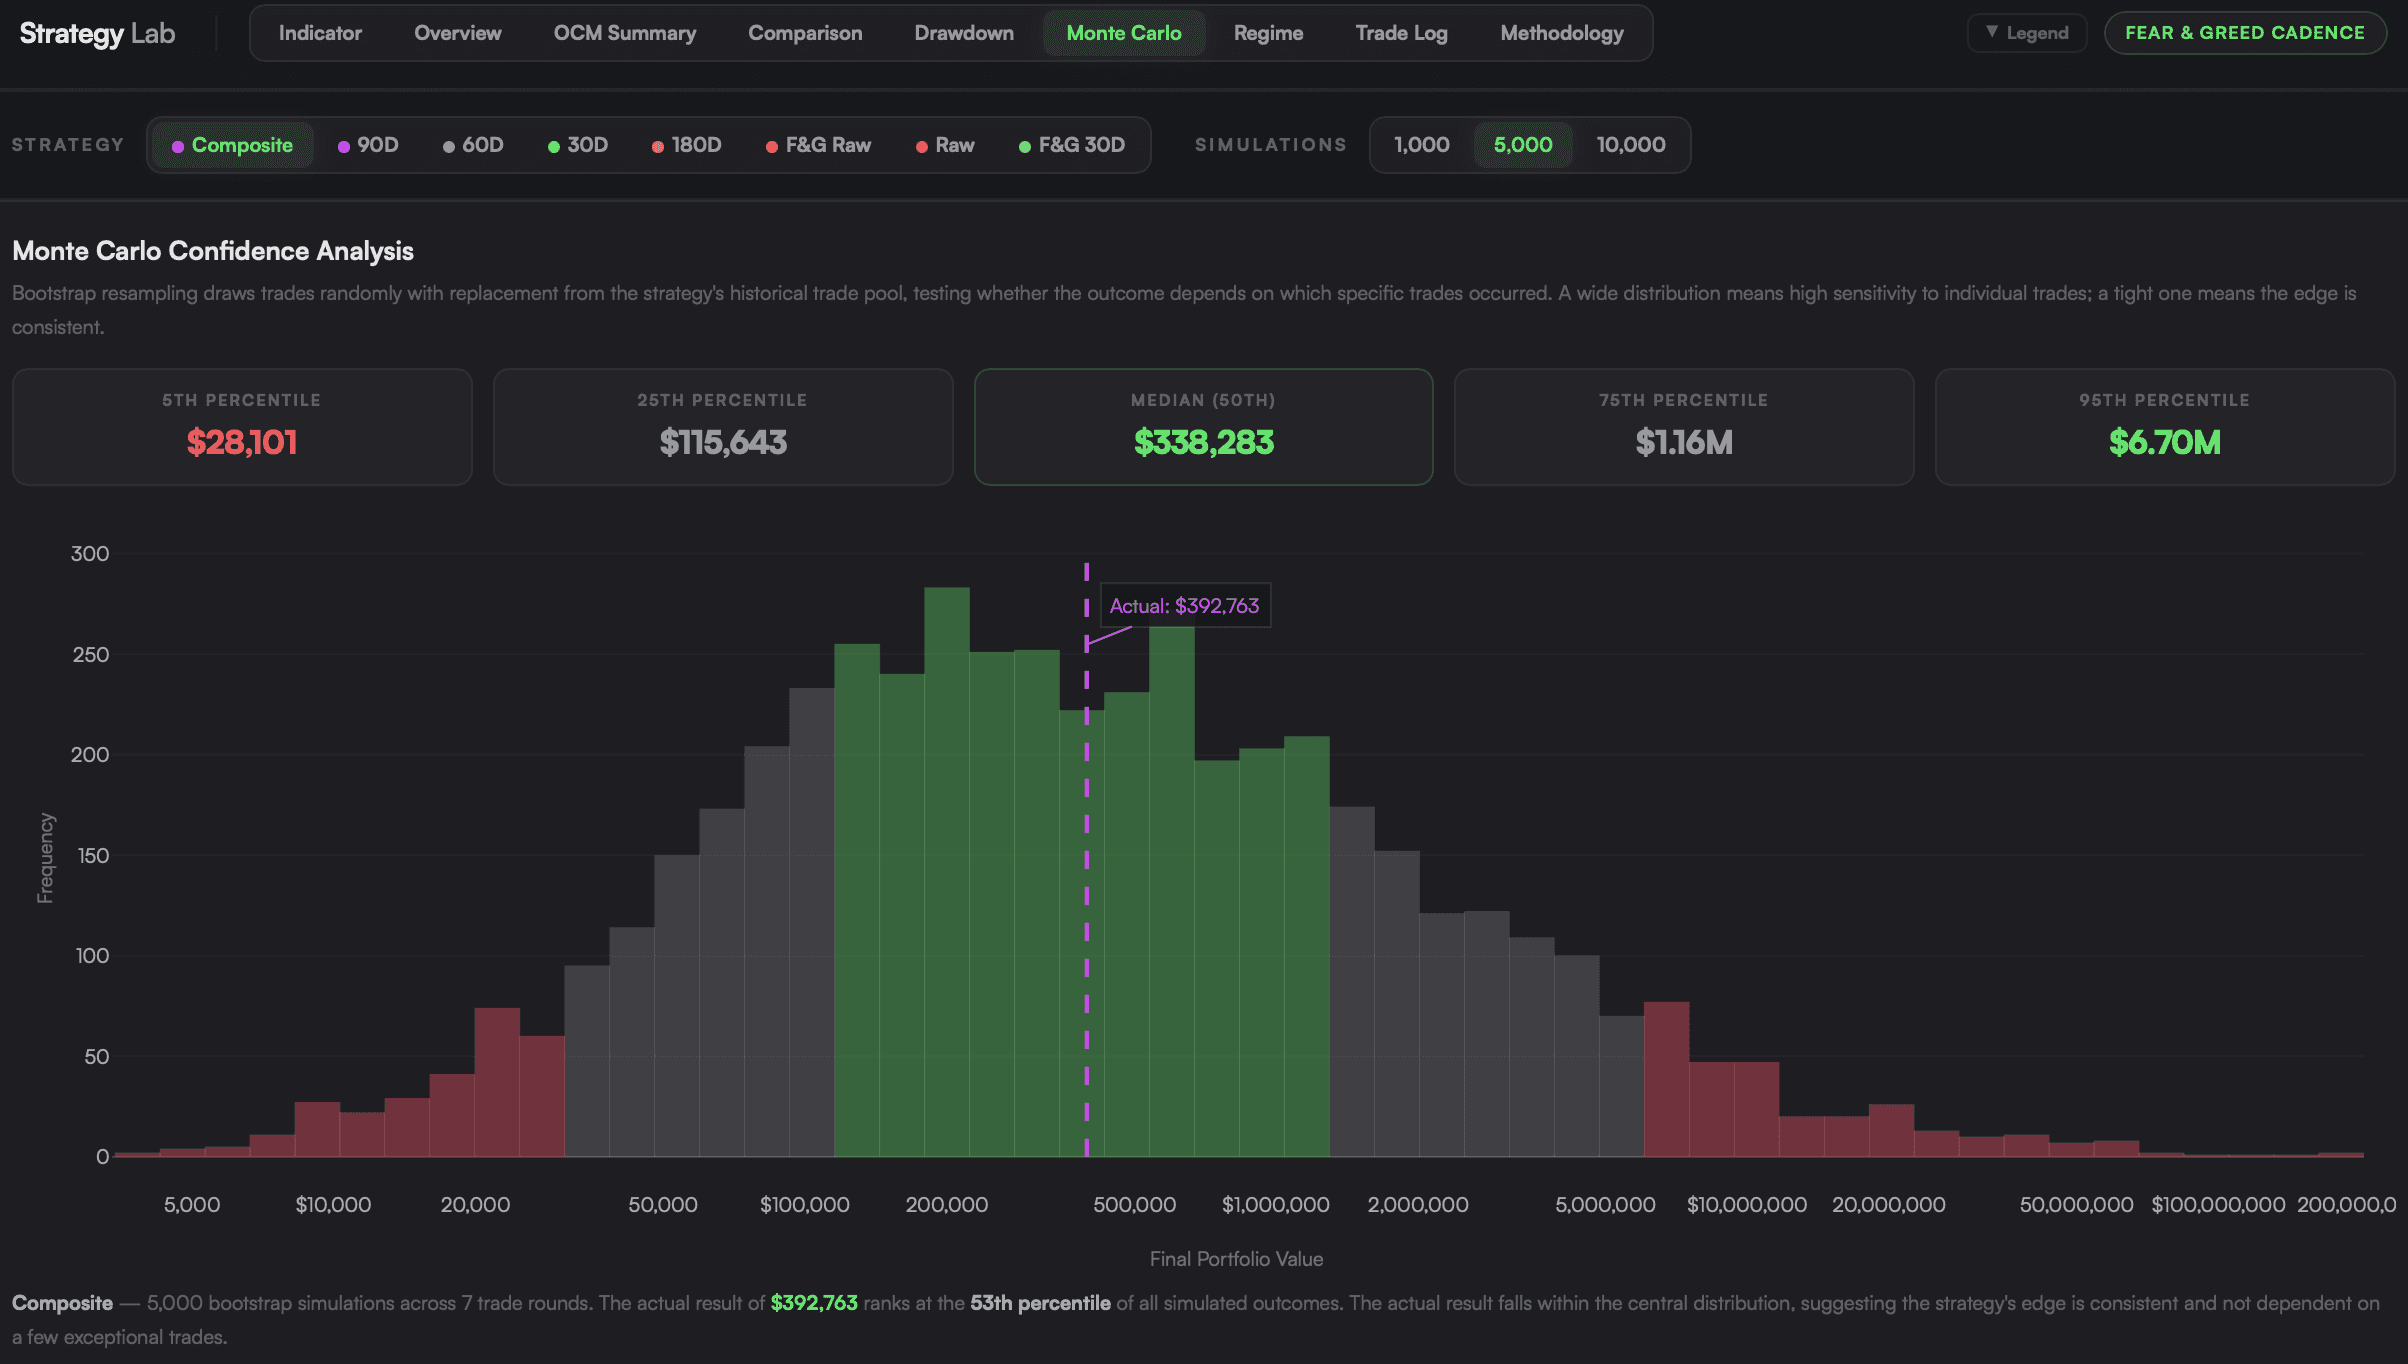
Monte Carlo takes every trade and reshuffles them thousands of times. If performance depends on a few well-timed wins, it quickly falls apart. Here, the Composite strategy sits right in the middle of the distribution across 5,000 simulations, which tells you the edge comes from the rules, not from luck.
Then there is risk-adjusted performance. It is not just about the final return, it is about how efficiently that return is achieved. Professional capital focuses on metrics like:
Sharpe Ratio: return per unit of total risk.
Sortino Ratio: return per unit of downside risk.
Calmar Ratio: annual return vs. maximum drawdown.
Profit Factor: total gains divided by total losses.
This strategy actually stands out across all of them. It delivers a Profit Factor of 35, meaning every $1 lost generates $35 in gains. The Calmar Ratio is an exception 1.21. Compare that to buy-and-hold, which carries a Calmar ratio of just 0.65, and the difference becomes clear. This is not just higher returns, it is a far more efficient system for generating them.

Process Over Signal
Frankly, I don't actually care about the Composite strategy as a finished product. It’s a tool, an example, a proof of concept. What I care about is the philosophy it represents.
We are currently sitting in an environment of prolonged extreme fear. For ~50 days, the headlines have been bleak, and the retail sentiment is in the gutter.
In this situation, the human brain is screaming at you to do something. You feel a compulsive need to either panic-sell the bottom or revenge buy to make up for lost time.
Yet, as I write this, the Composite strategy is sitting in cash. It has been in cash since mid-September 2025, when it exited at $111,000. It has watched Bitcoin drop 40% into this $60,000-$70,000 range, and it hasn't blinked.
This is the level of detachment we should all strive for. The Strategy Lab isn't just a dashboard; it’s a mirror. It shows you that most of what we do as discretionary traders is noise. We overtrade, we ignore the broader trend, and we give back our bull market gains by staying married to a position during a structural regime shift.
My goal with this platform is to give you the ability to define your own approach. Maybe you want to be more aggressive, or maybe you want a smoother equity curve that lets you sleep at night. Whatever your preference, the edge isn't found in a magic indicator. The edge is found in a repeatable, backtested process that keeps you on the right side of the market.
The data from this one simple example is clear: those who trade the momentum of sentiment will always outperform those who are victims of it.
But more importantly, I am incredibly excited to put these tools in your hands and see how you evolve from a participant into a strategist.
Stay tuned, the Strategy Lab is just around the corner.