
Bitcoin has matured tremendously over the past decade. Maybe the days of retail-driven frenzies are behind us, replaced by a market increasingly shaped by institutional flows.
Yet, despite the evolving market structure, one trading approach stands out: trend-following strategies, which consistently outperform buy-and-hold and deliver extraordinary compounded growth across multiple cycles.
In this article, I’m unpacking a trend-following system that has survived every bear market unscathed and has just issued its first proper bear flag since the 2022 capitulation.
If you care about preserving and compounding capital in Bitcoin, you need to understand why strategies like this are rapidly becoming non-negotiable.
Key insights
Trend Beats Timing: Rather than guessing tops and bottoms, focus on capturing the majority of bull trends while minimising the downside.
CAGR Reality: A mechanical trend system compounded at 134% since 2012 — dwarfing lump-sum (104%) and flat DCA (59%) in all market regimes.
Bear Markets Vanish: Trend-following strategies tend to sit out for the majority of bear markets, helping preserve accumulated capital.
Future-Proof Design: As Bitcoin matures and manic blow-off tops fade, pure volatility-based approaches are perfectly positioned to dominate the future.
Stop Predicting, Start Reacting
Most Bitcoin traders spend their lives hunting the perfect entry and the mythical “top”. They overload charts with RSI divergences, Fibonacci extensions, Pi cycle tops, Stock-to-Flow deviations… and still get rekt when sentiment flips overnight.
Trend-following flips this problem on its head and takes the opposite approach: radical humility. It makes zero attempt to forecast. Instead, it answers two questions only:
Is a genuine trend in force right now?
Has that trend unambiguously broken?
That’s it. Everything else – news, macro, ETF flows, whale games – is just noise. By focusing exclusively on price and its volatility, the system stays married to bull markets to capture the lion’s share of upward moves, and instantly divorces bear markets to step aside before most losses occur.
And over multiple cycles, that asymmetry is devastatingly powerful.
Introducing a Potential Strategy
There’s countless trend-based tools available out there, but today I’m going to focus on one called the Alpha Flow.
At first glance, the indicator looks deceptively simple: a baseline with dynamic upper and lower envelopes, plus coloured bull/bear flags. But that simplicity, however, is deliberate. And the elegance is in the engineering.
For those interested, here’s the technical breakdown:
Dual-EMA Baseline: A fast and slow exponential moving average of the typical price (HLC/3) are blended into a “basis” line that reacts quicker than a simple moving average but smoother than raw price.
Volatility Envelopes: A smoothed standard deviation is calculated around that basis and multiplied by a factor to create upper and lower bands. Crucially, these are not fixed-percentages or static-lookbacks like Bollinger Bands – the deviation itself is adaptive and reacts to actual trend volatility.
Regime-Locking State Machine:
Price closing above the upper envelope → locks the entire chart into a bullish regime (the bull flag).
Only a decisive close below the lower envelope flips it to bearish (the bear flag).
This “stay on the train until it actually derails” logic is what prevents destructive whipsaws during healthy pullbacks or sideways choppy markets.
I like to think of it as: Donchian channels meets ATR bands meets moving-average ribbons, but far more responsive and far less noisy.
But in plain English: Bitcoin has to prove beyond reasonable doubt that the trend is dead before the system lets you get hurt.
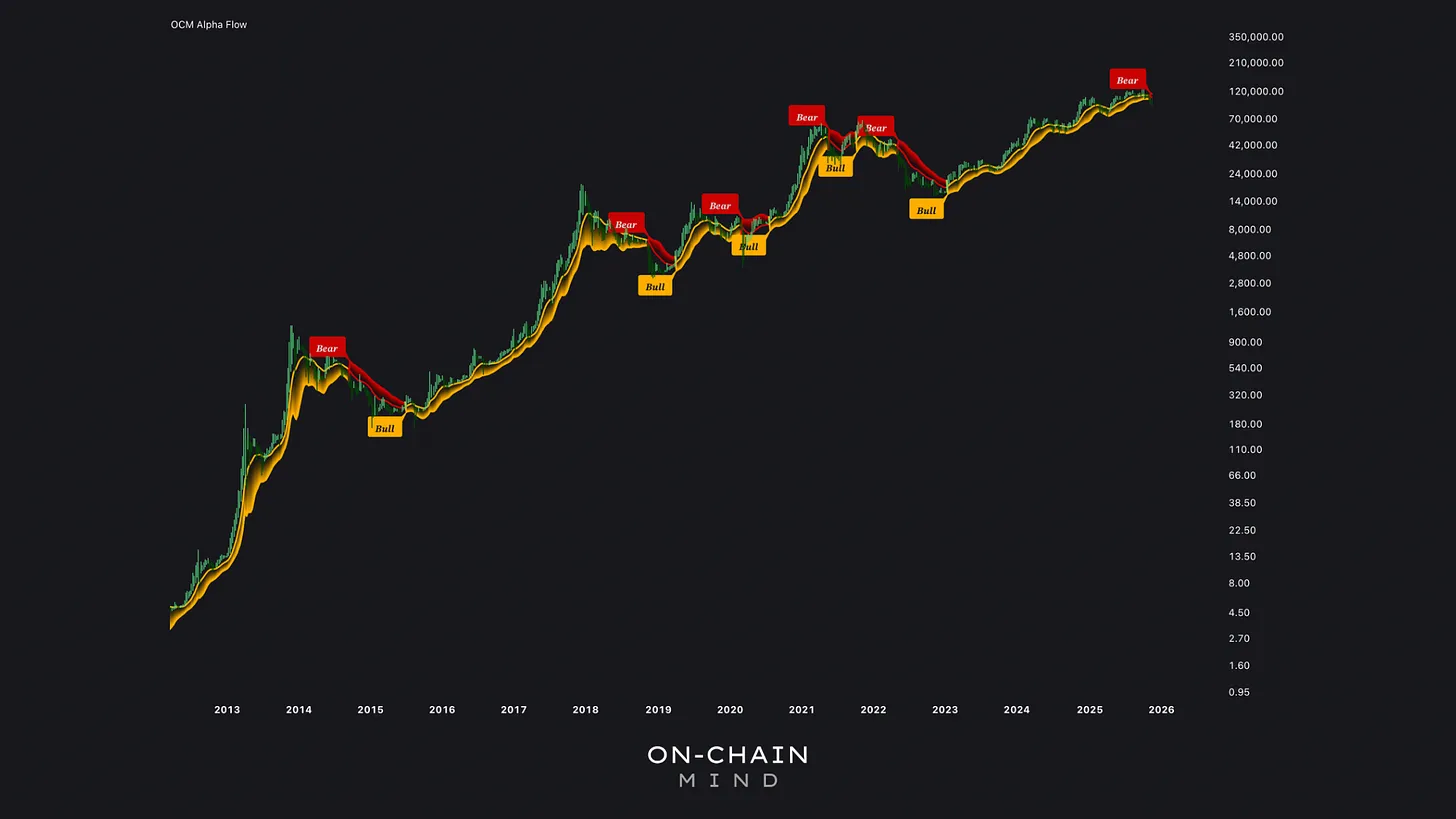
Historical Performance Analysis
To understand the power of trend-following, it helps to look at historical results:
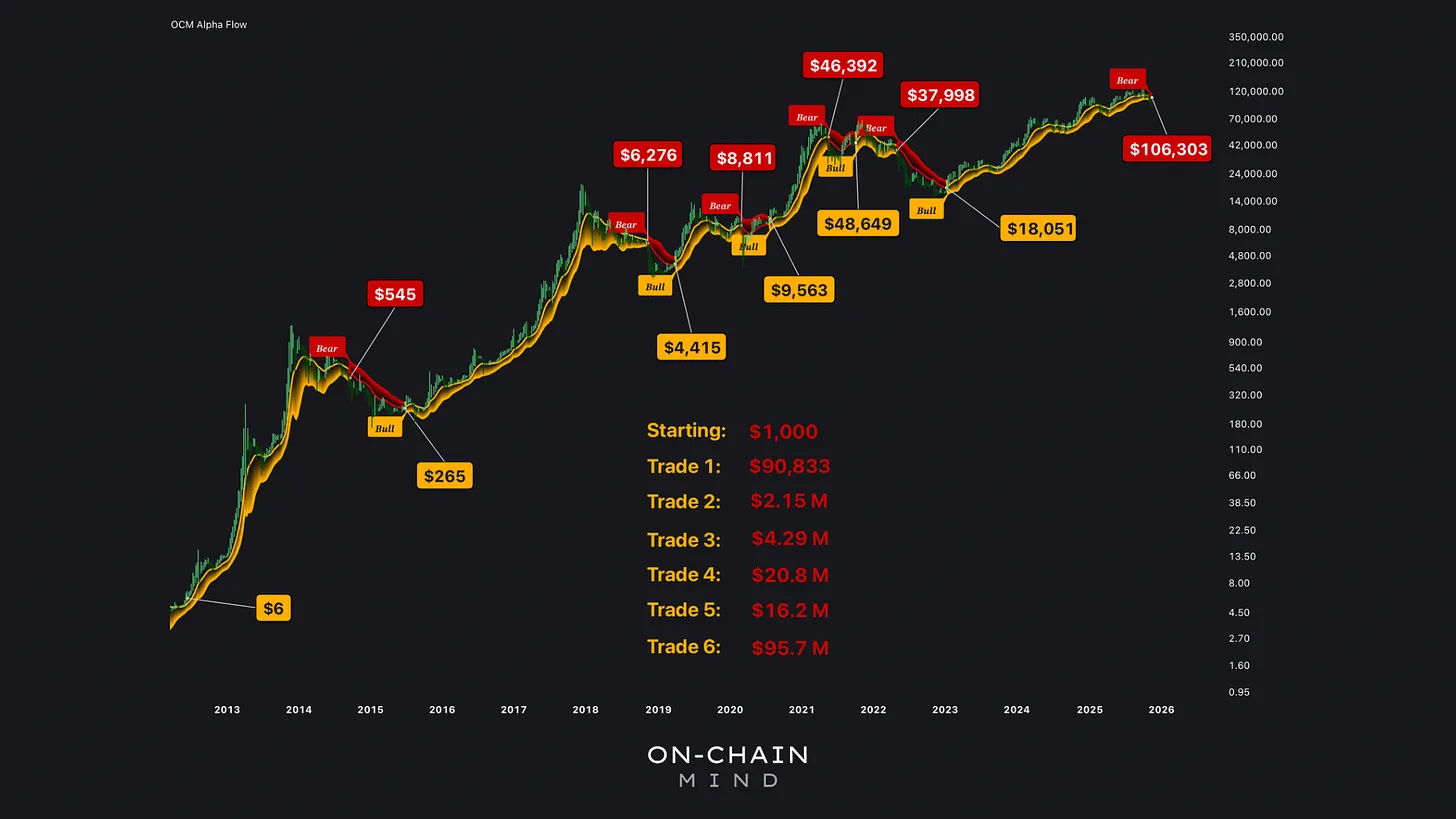
Let’s walk through the actual trade-by-trade history starting June 2012 with $1,000:
Trade 1: Enter $6 → Exit $545 → $1,000 becomes ~$90,000
Trade 2: Re-enter $265 → Exit $6,200 → portfolio ~$2.15 million
Trade 3: Re-enter $4,400 → Exit $8,800 → a clean double
Trade 4: Re-enter $9,500 → Exit $46,000 → ride the 2020-21 bull
Trade 5: Small losing trade exiting $37,000 into 100% cash for the 2022–23 bear
Trade 6: Re-enter $18,000 → Most recent exit $106,000 → pot now $95.7 million
Compare that to the baselines:
Lump-sum $1,000 at $6 in 2012 → ~$13.9 million (104% CAGR)
Weekly DCA same period → ~$500,000 (59% CAGR)
Trend-based → $95.7 million (134% CAGR)
The gap is so large it feels obscene, yet it’s just mathematics: capture 80–90% of every bull run, lose almost nothing in bear markets, repeat over four cycles.
And yes, I can already hear the sceptics: “It only works because you started in 2012”. That’s not the case. Even if you began at the absolute worst possible moment, which would be the bear-market bottom of any previous cycle, this strategy still outperforms buy-and-hold on a risk-adjusted basis, which shows the power of trend preservation and volatility management.
Why This Works Better as Bitcoin Matures
Early Bitcoin was pure retail mania – 10× moves in weeks, 85% crashes, zero fundamental anchor. And indicators tuned for that era are starting to fail.
Today we have ETFs, sovereign balance sheets, and $100 billion+ of institutional money. Volatility is structurally lower, trends are smoother, and blow-off tops are tamer. The 2021 peak was sharp, but nothing like 2013 or 2017.
Trend-following systems thrive in exactly this environment. They don’t need parabolic euphoria to make money, they just need persistent directional pressure, which institutions provide in spades.
Psychological Capital Preservation
Charts don’t tell the full story. The real edge is what a system like this does to your brain.
You stop obsessing over whether “this is the top”. You sleep through 50% crashes knowing you’re in cash. You never get shaken out of a bull market by a 30% correction that feels like death but is actually healthy.
For most people, that emotional stability is worth more than any extra percentage points from a (potentially) brilliant top/bottom indicator.
Making It Even Better (Without Ruining the Simplicity)
The base Alpha Flow system is mechanical, humble, and straightforward. But it can be augmented:
Moving average filters: Only accept bull flags if the long-term trend supports it.
On-chain metrics integration: Combine with MVRV Z-score or other indicators to time re-entry after bear-market capitulation.
Portfolio layering: Use a small satellite allocation (10–20%) for aggressive cycle-top signals while keeping the core trend-following portfolio intact.
My personal favourite: run the core indicator on weekly candles for position trading, then use the same logic on dailycharts for swing entries inside the larger trend. Best of both worlds.
The Bear Flag That Just Printed – What Now?
The indicator has actually just flipped to its first proper bear regime since the 2022 lows. We recently saw a decisive weekly close below the lower volatility envelope right around the $106,000 region.
Here’s my unfiltered take on it all and how I’m positioning:
Watch the video walkthrough on YouTube
Continue reading with OCM Premium
You have been reading the free preview of this article. The rest of it (about 350 more words) is for OCM Premium members. See OCM Premium plans.