
Ask 10 people when this Bitcoin bear market ends and you’ll get one suspiciously confident answer: about a year.
What makes it interesting is that, through a strange quirk of psychology, the lazy answer and the data-driven answer may be pointing in the same direction.
Not because dates on a chart hold any real predictive power, but because a belief held by enough people starts to bend the very thing it is predicting.
So let me take you through the psychology behind it, the data that backs it up, and a brand-new on-chain chart I’ve been building that might just be the cleanest bottoming signal I’ve ever put together.
Let’s get into it.
Key insights
Reflexivity in Action: Collective belief in a year-long bear can statistically bend the outcome and create a powerful self-fulfilling prophecy.
Diminishing Severity: Each cycle's drawdowns and counter-trend rallies are shrinking as Bitcoin matures and volatility compresses.
Holder Convergence: Short-term and long-term investor cost bases are rapidly colliding, historically marking the exhaustion of speculative excess.
Cointime Conviction: Ancient coins remaining strictly dormant signals deep market accumulation, reflecting absolute holder conviction despite choppy prices.
When Belief Becomes the Mechanism
I believe the Bitcoin bottom is near. Not here, but near, and that distinction matters, because calling a bottom and recognising the conditions for one are two very different things.
The most popular take is beautifully simple: Bitcoin bear markets last about a year, so this one will too. As lazy as that sounds, it has been mostly true.
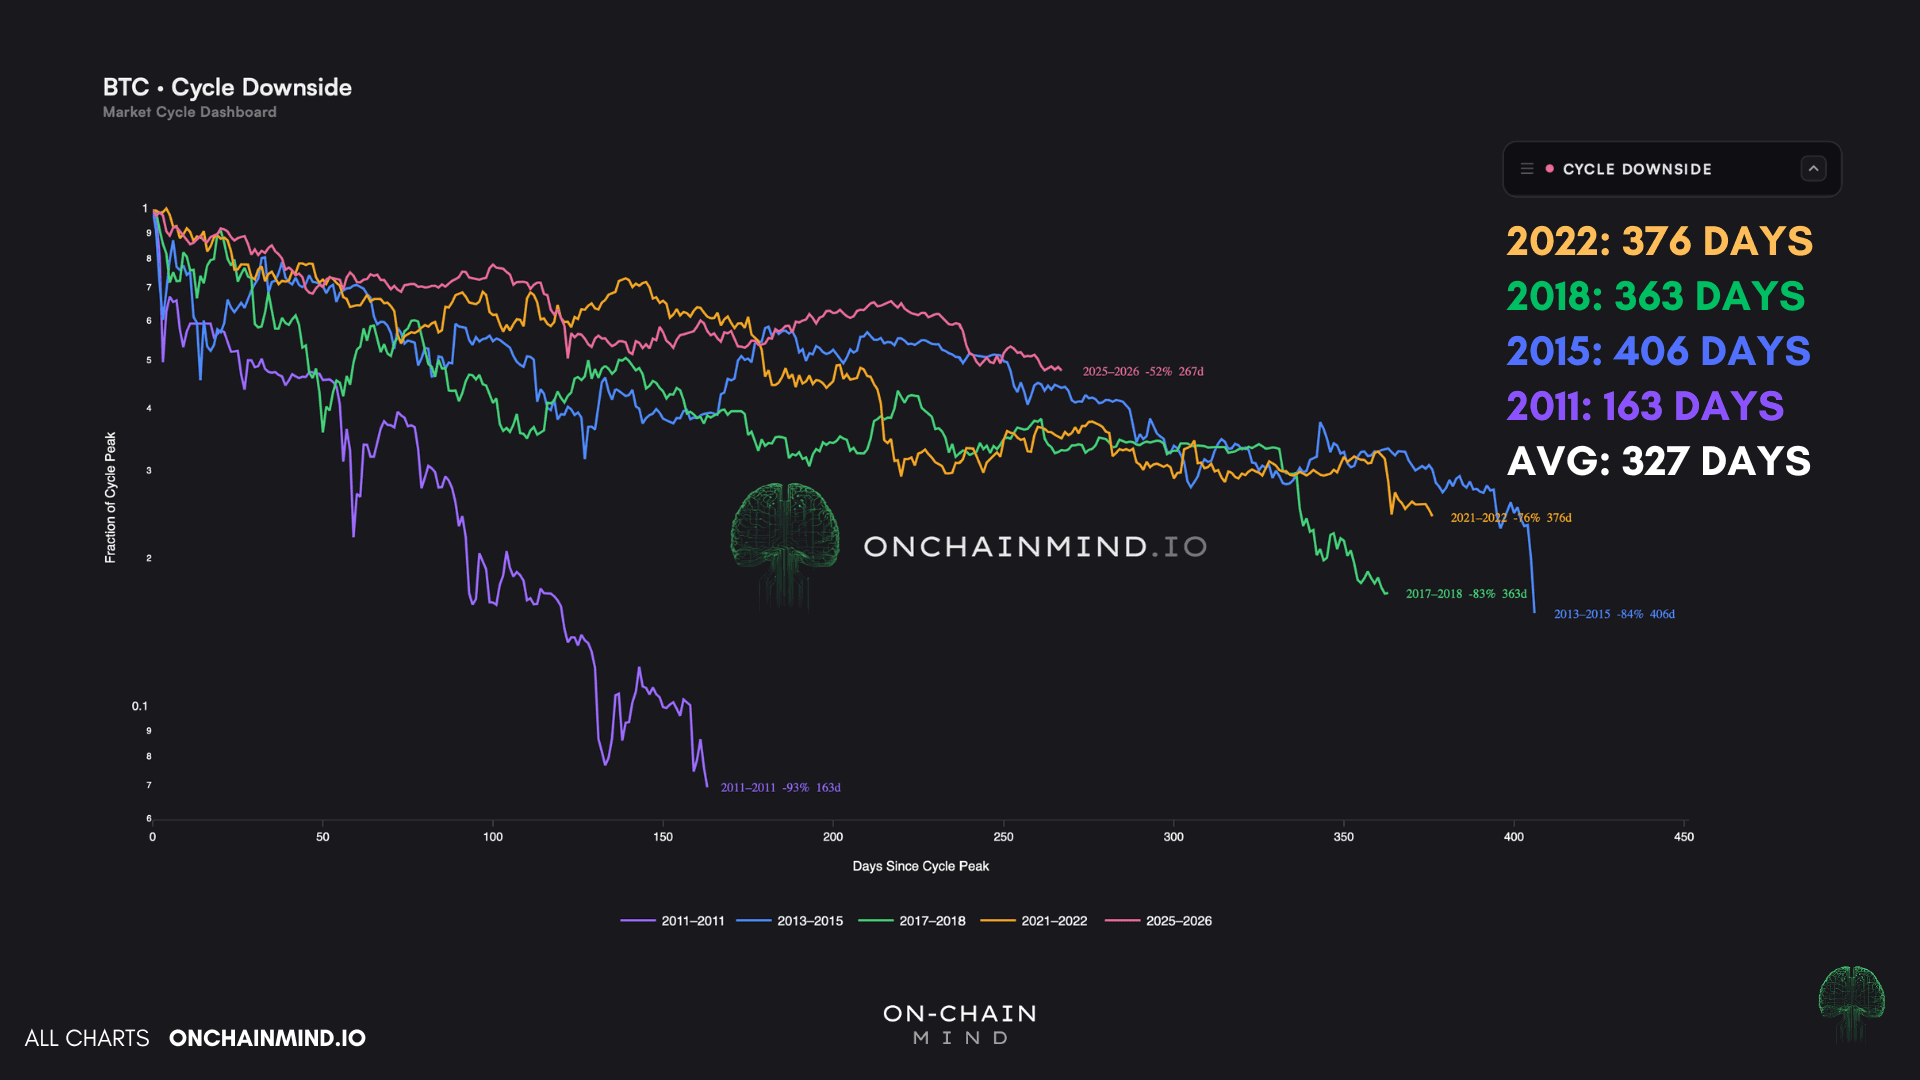
The last drawdown ran 376 days, the one before 363, the one before that 406. We conveniently forget the very first, which lasted barely half a year.
View live in OCM Studio: Bear Cycles
Average them out and the trip from top to bottom takes 327 days, which, given we are already around 267 days in, points to a bottom near late August to early September.
But there is no law of physics that says a bear market must resolve in 365 days. It is a pattern, and a pattern is not a mechanism.
So why might the lazy answer still win? Herd mentality, and its quieter partner, the self-fulfilling prophecy.
The logic is simple. A belief changes behaviour in a way that helps make the belief come true. People hold off buying because they are “waiting for the bottom in October”, and when enough of them plan their accumulation around the same square on the calendar, that behaviour starts to shape the price itself.
In markets this loop has a name: reflexivity, popularised by George Soros. Beliefs influence price, and price turns around and reinforces the belief.
On any normal day I back calendar theories about as much as a flat Earth. Yet this could be one of the most powerful self-fulfilling prophecies the asset has ever seen, precisely because the belief is now so baked in it has become part of the market’s operating system.
The narrative is no longer just describing the market. It has quietly become an input into it.
A Maturing Market
The calendar speaks to timing, but there is a second question worth asking: how much further down?
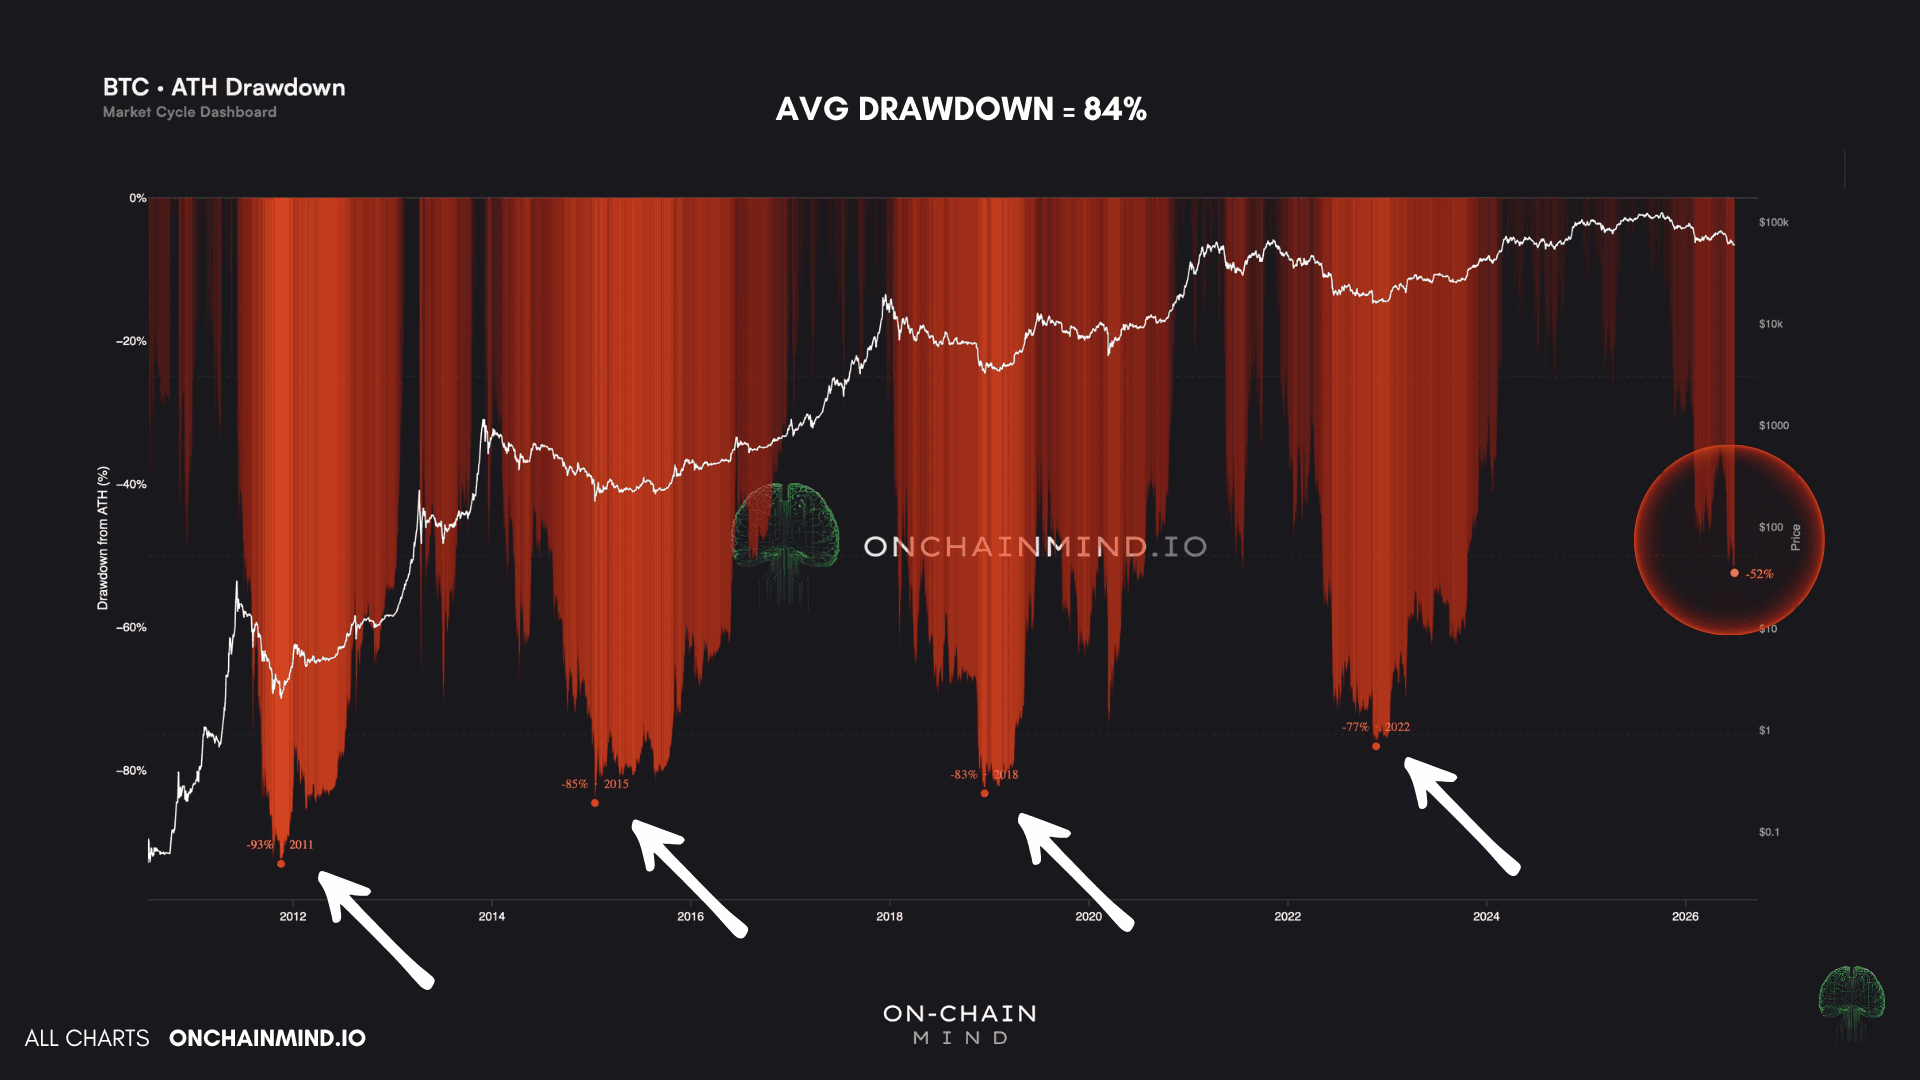
The average drawdown from an all-time high across Bitcoin's history is roughly 84%, so a pure averages player should brace for far more pain than our current 52%. I will not pretend the bottom is in today, and there is certainly room for more downside. But I would not bet my position on a trip all the way to that 84% average, and the reason sits right there in the data.
The drawdowns have been getting shallower every cycle, and for good reason. This last top arrived without a significant batch of euphoria. No blow-off, no mania of the old degree.
That matters more than it sounds, because the explosivity of the upside directly governs the violence of the downside. Less air pumped in on the way up means less air to let out on the way down.
View live in OCM Studio: ATH Drawdown
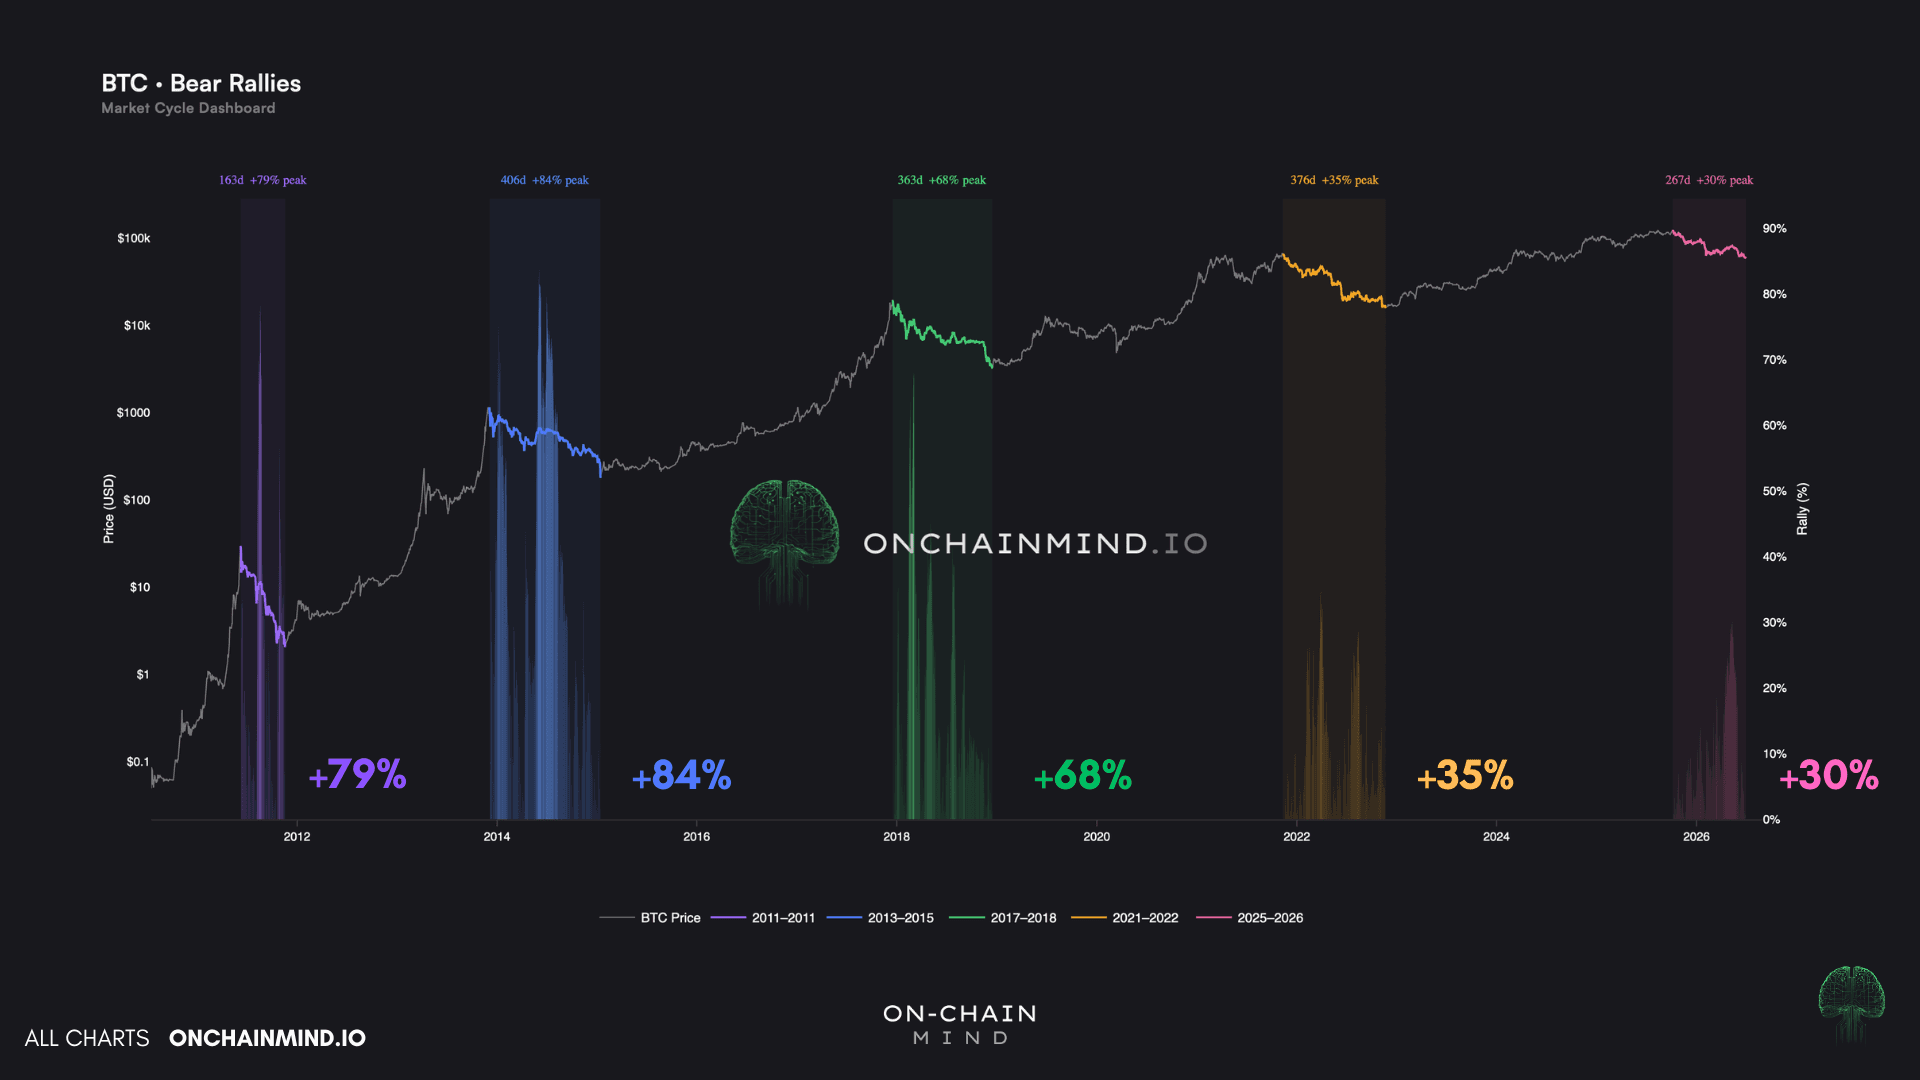
The same fade shows up in bear market rallies, the vicious counter-trend bounces inside a downtrend that suck believers back in before rolling back over.
Here’s the strongest bear market rallies in each cycle:
+79% in 2011
+84% in 2014
+68% in 2017
+35% in 2022
+30% (so far) in 2026
Run your eye down that ladder and the trend is impossible to miss. The 80% face-rippers of the early cycles have been compressed into something far tamer, and that diminishing severity is measurable rather than a matter of feel.
This is what maturation actually looks like on a chart: deeper liquidity absorbing the shocks, volatility leaking out of the asset, and the raw violence of every move dulling as the market scales.
So if even the rallies inside this bear are losing their bite, it logically follows that the drawdown is being defanged in the very same way.
View live in OCM Studio: Bear Market Rallies
When the Cohorts Collide
The calendar and the psychology make for a compelling story, but stories are not where I personally live. I always come home to the chain, and there is one structural signal that arrives at almost the same timeframe through pure on-chain data: the divergence between long-term and short-term holders.
Every Bitcoin market is a standoff between two crowds. On one side, the long-term holders, the patient accumulators who sit through the chaos. On the other, the short-term holders, the speculative fast money that floods in near the top and bolts near the bottom.
Each crowd carries an average cost basis, and in an expansion those lines fan apart, the short-term basis riding above the long-term one as every new buyer pays up.
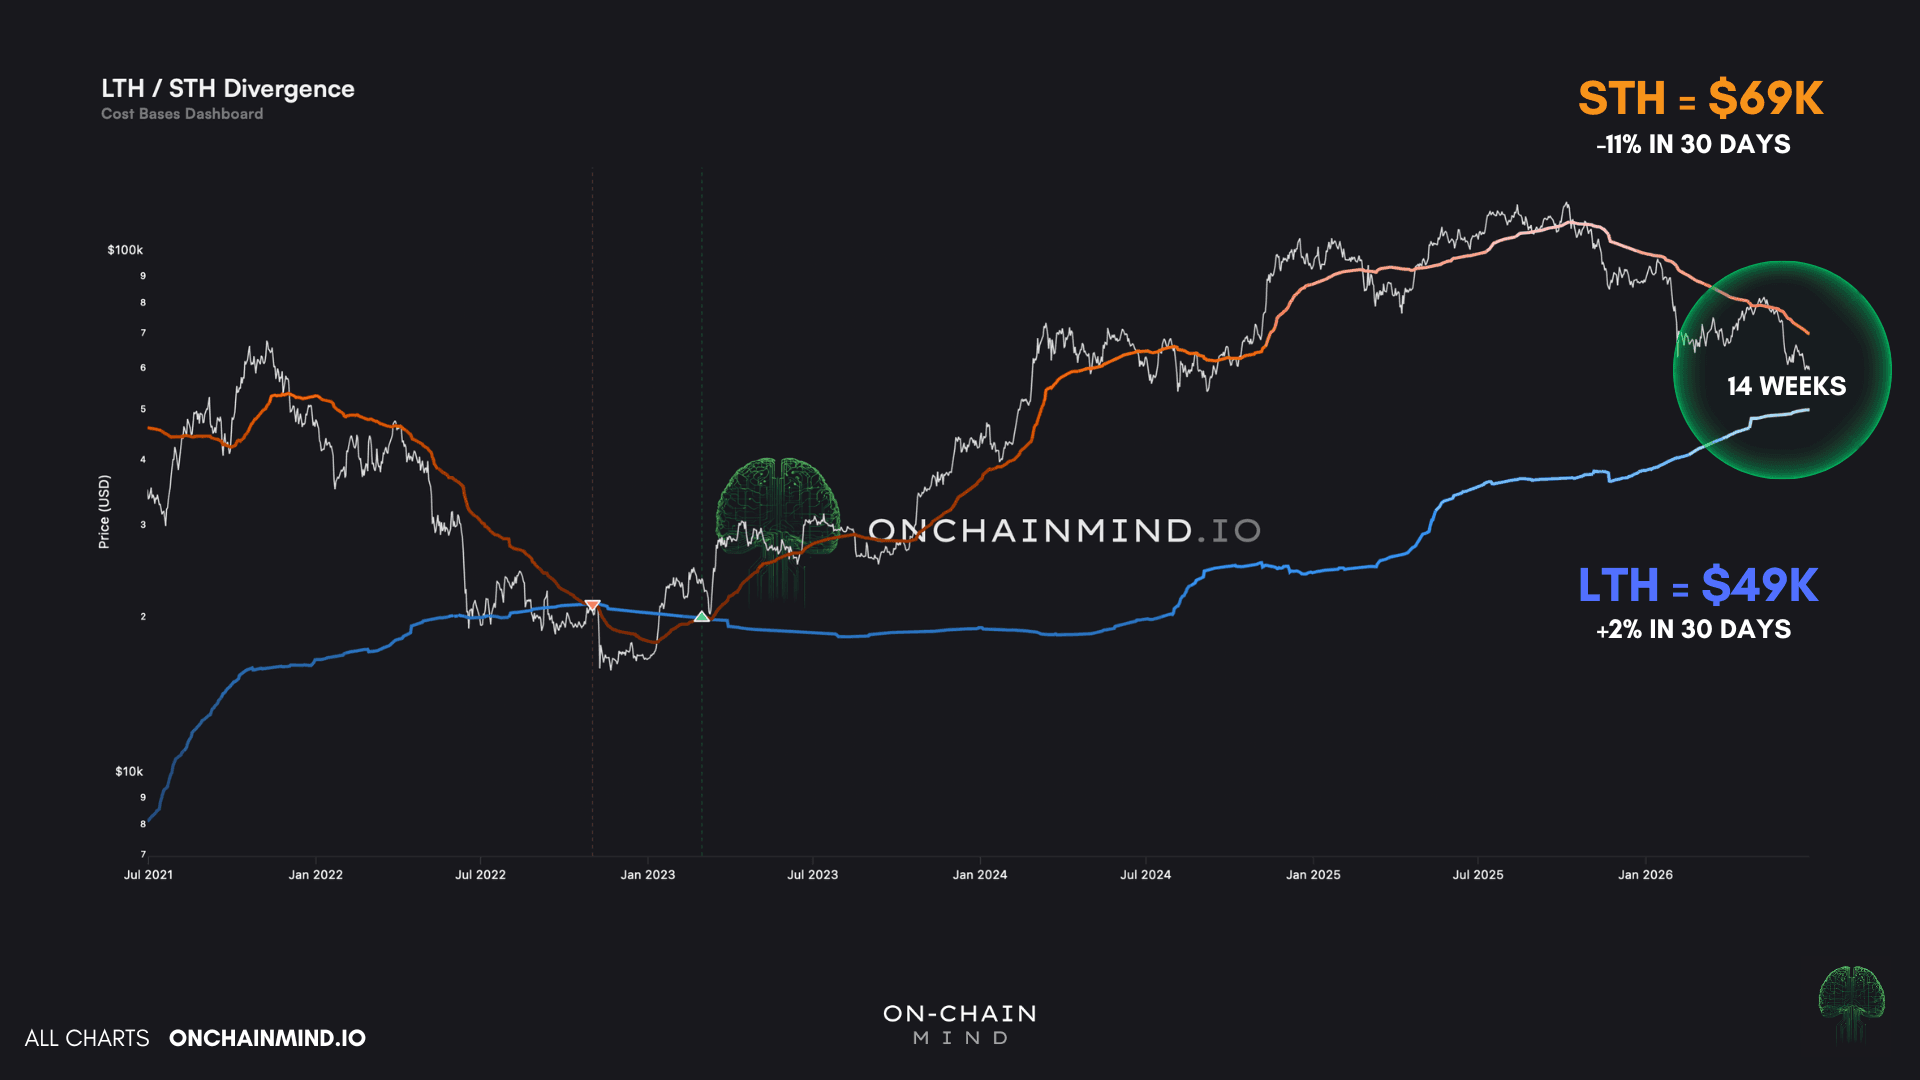
The bottom inverts that order. When the short-term basis sinks below the long-term one, the newest money has been repriced beneath the oldest, strongest hands, and that is speculative excess being flushed out of the system in real time. It is one of the clearest fingerprints of a cycle low we have.
Right now those two lines are closing fast. The long-term holder cost basis sits near $49,000 and is grinding higher, up 2% on the month, while the short-term cost basis has cratered 11% to around $69,000 as recent buyers capitulate or get repriced.
On the current trajectory they collide in ~14 weeks, landing us in late September or early October. A sharp flush lower would only drag that meeting forward, because nothing crushes the short-term cost basis faster than panic.
View live in OCM Studio: LTH STH Divergence
The Power of Stillness
Cointime Conviction is a brand-new metric I have been building at On-Chain Mind, built on top of the Cointime Economics framework. It looks at the network itself and tracks what HODLers are actually doing (or not doing) with their coins. And right now it is pointing somewhere very specific.
At its heart it is a tug of war between two forces: the value sleeping inside old, untouched coins, and the value being dragged out of hibernation and spent.
Coins quietly accrue time the longer nobody touches them, and the instant an ancient coin stirs, every ounce of that accumulated time is wiped out at once. That destruction is the cleanest on-chain fingerprint of selling there is. So when coins sit dead still and almost nobody sells, the metric runs hot, and historically it has run hottest at the precise moments the rest of the market had already capitulated.
Today it sits in its 92nd percentile and is still steadily climbing, even through this sideways, sentiment-dead chop.
That is the part worth sitting with. A falling price can stoke it faster, sure, but the real work is being done by the silence, not the sell-off. The network has simply gone quiet, and not just the profit-takers but the loss-takers too.
The strongest hands are doing the single most powerful thing available to them at a cycle low, which is precisely nothing.
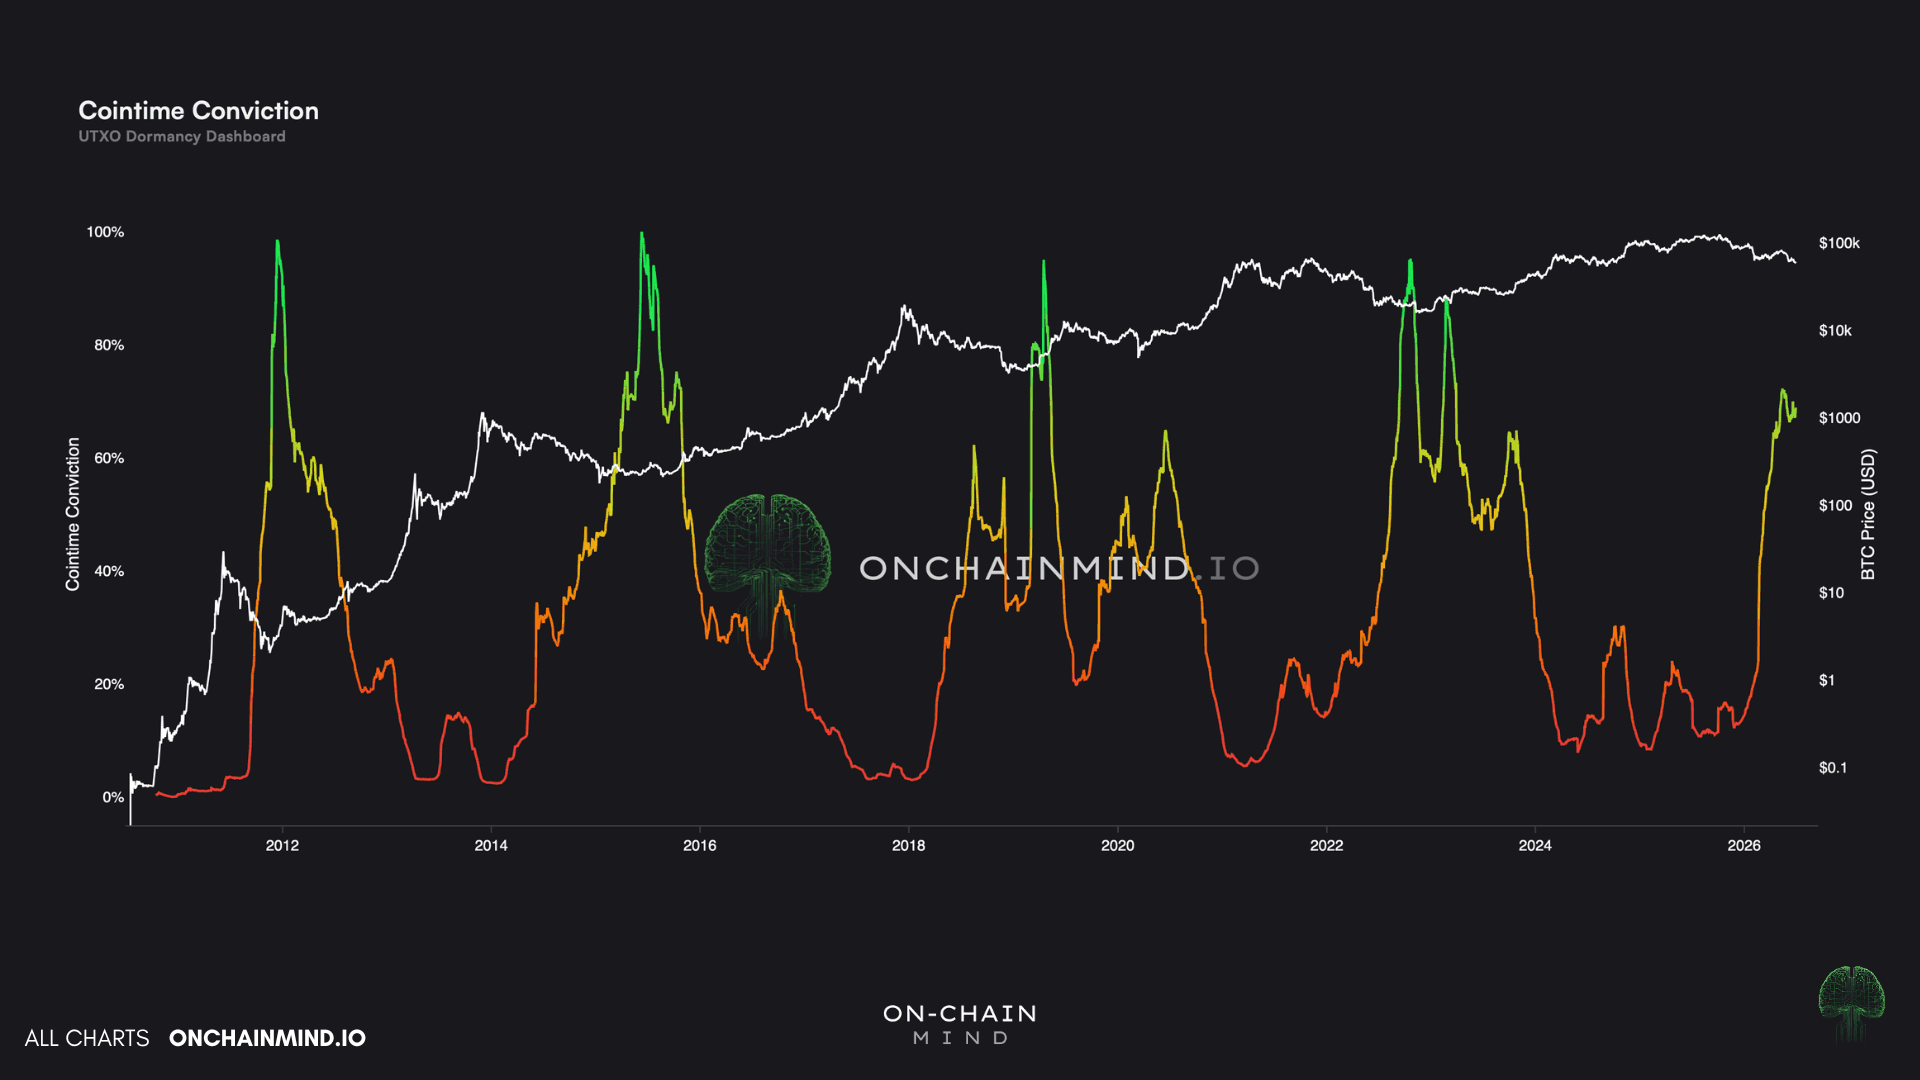
View live in OCM Studio: Cointime Conviction
The Aligning Signals
When you zoom all the way out, there are countless ways to frame this market. If you want to invest purely off the Gregorian calendar while quietly deleting an entire cycle from your data set, then more power to you, but I cannot think that way. I always come back to the data.
And yet the odds of Bitcoin bottoming in or around this window feel stronger now than they ever have, and the reason is not the calendar at all. It is that every one of us, myself absolutely included, chronically underestimates the raw power of collective belief.
Reflexivity and self-fulfilling prophecies are not soft, hand-wavy ideas. They move behaviour en-masse, and behaviour moves price far more than most of us care to admit.
The beautiful part is that I do not have to choose between the two. For once, the story and the data are saying the same thing. The calendar points to late summer into early autumn. The cohort cost bases are converging towards late September. And Cointime Conviction is grinding into its highest readings as the network goes still.
Three completely different lenses, one surprising shared answer.
Make no mistake, we are deep in accumulation territory on almost every measure I respect. But I will not hand you a date and pretend it is gospel. And the ones who do? I would stay well clear of them.
But when the lazy story and the hard data finally agree, that agreement is the signal. I have said it many times in this newsletter this year: bottoms are not bells that ring. They are built in the boring, sideways silence that everyone else scrolls straight past.
And to be clear, the data landing on October does not vindicate the calendar bros. Their case still has no science underneath it. It is simply that, for once, a baseless narrative and a data-driven one happen to be staring at the same window.
Those of us in the OCM community already know the game plan, and none of this changes a single line of it.