
Bitcoin does not need to make new highs for the next bull market to begin.
That sounds counterintuitive, but it’s one of the most important distinctions in cycle analysis.
The real question isn’t where price has to go, it’s where momentum, profitability, statistical mean reversion and broad cycle risk all flip back to bull at the same time.
I’ve run 4 completely independent models to find that level, and the convergence is hard to ignore.
So let’s get into it.
Key insights
Bottom vs. Bull Confirmation: Buying the bottom maximises reward, but the confirmed bull flip usually offers higher near-term certainty.
The Region That Matters: 4 independent models currently point to the same tight confirmation zone, within roughly $3,000 of each other.
Two Valid Strategies: Investors can buy deep accumulation zones and accept chop, or wait for confirmation and pay up for probability.
Bitcoin Is Recovering, Not Confirmed: The market has improved from the lows, but most model-based signals remain below bullish thresholds.
The Bottom and the Bull Flip Are Different Conversations
We’ve been in a bear market for about 6 months now, and I want to be clear that this piece isn’t about timing the absolute bottom. That’s a separate analysis I’ve covered elsewhere.
What I’m interested in here is the moment momentum mathematically flips from bear to bull, because the distinction between those two events matters quite a lot.
Calling the bottom is incredibly powerful for grabbing the best bargain. But more often than not, calling the bottom doesn’t mean the market is immediately going to flip bullish. The period right after a bottom is often where price remains choppy or bearish for a while. By the time the market flips back to a confirmed bull, you’re no longer buying at the best opportunity levels.
But, and this is the crucial point, the probability of any further significant downside from that point is dramatically diminished.
So this becomes a trade-off between maximum reward and maximum probability. If you buy the deep value zone, you accept volatility, chop and the emotional discomfort of being early. If you wait for confirmation, you accept a higher entry price in return for a cleaner signal that the market has structurally repaired.
Both approaches are valid. The key is knowing which game you are playing.
Model 1: The Regime Divider
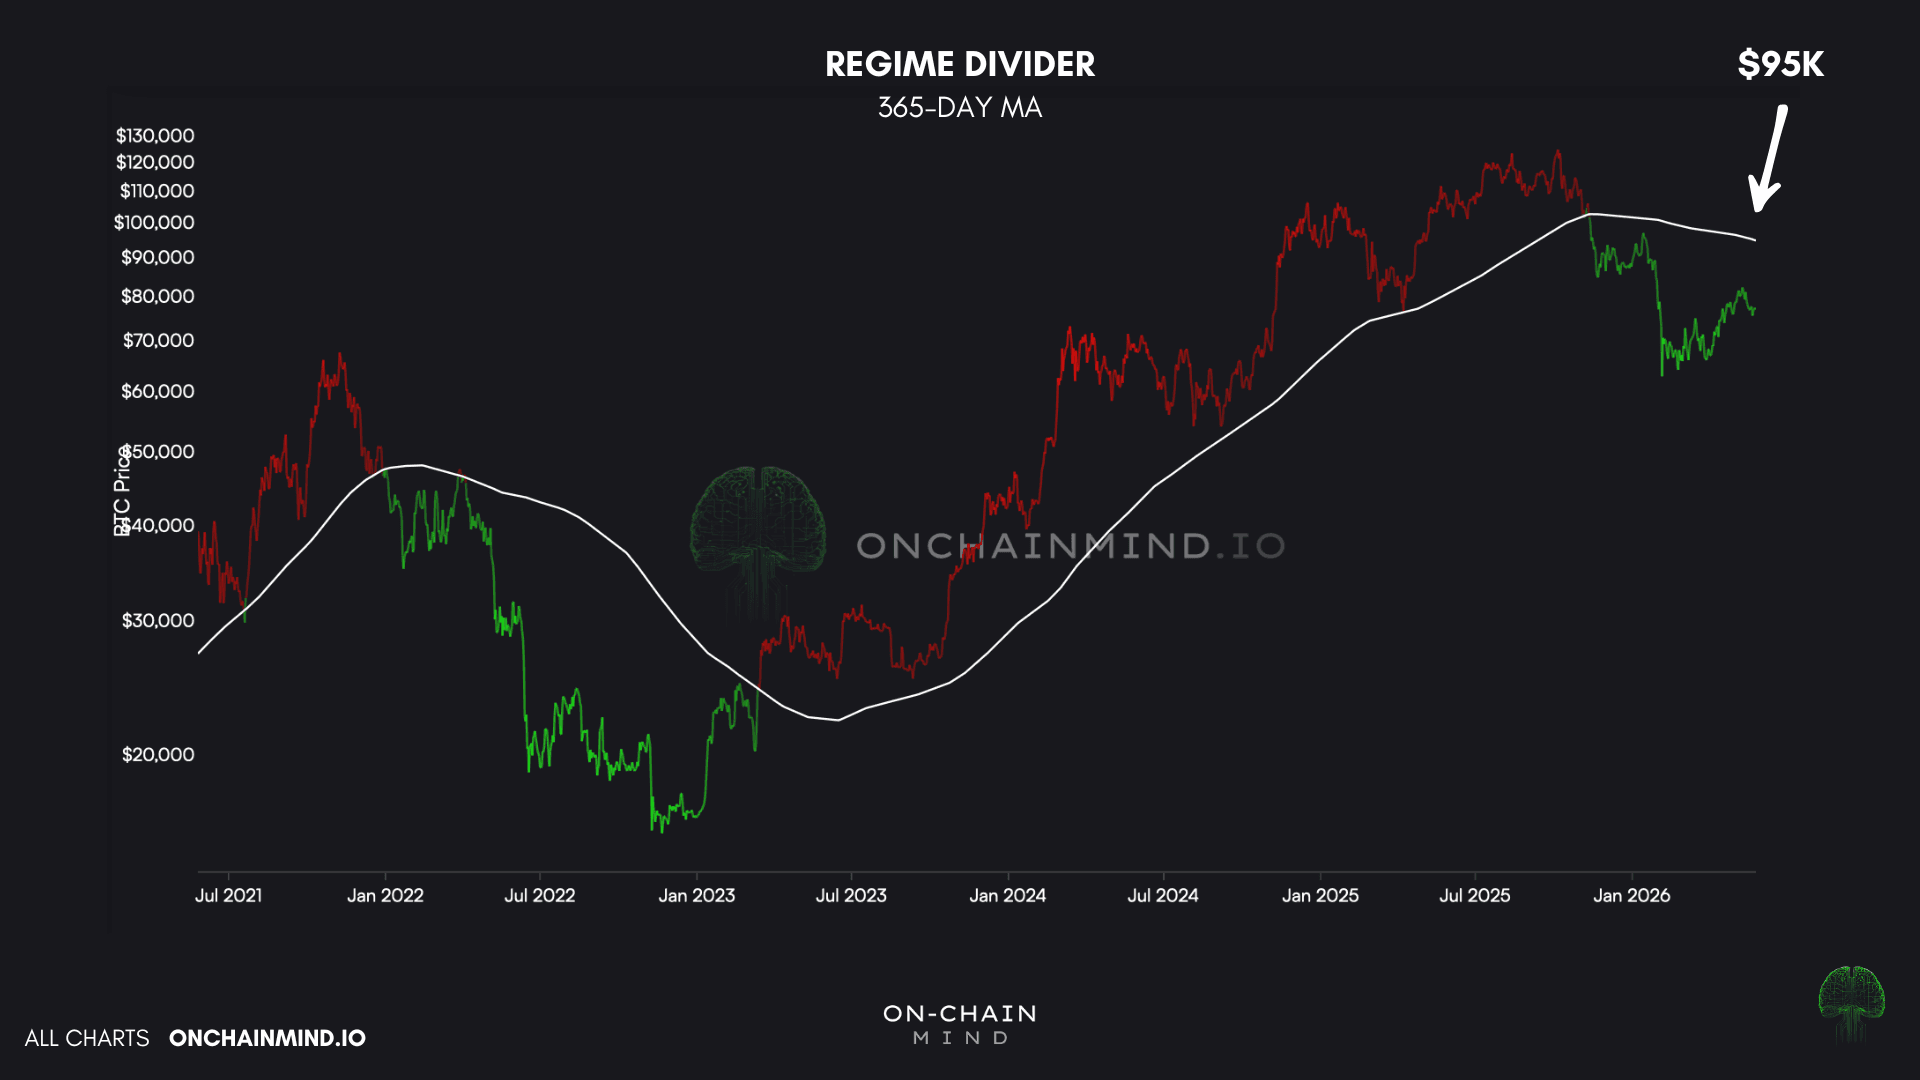
Let’s look at the simplest tool first. I call this the Regime Divider, and the dividing line is the 365-day moving average of Bitcoin’s price. It’s almost embarrassingly simple, but the historical record shows it’s also astonishingly powerful.
You can see it clearly on every previous cycle: the bear market began when price broke below this line and stayed below for months, and the bull market resumed when price reclaimed it and held.
Once that reclaim happened, price tended to stay above until the next bear market began, making it an almost binary regime indicator.
What it’s really telling us is whether price is trading above or below the average cost of momentum over the previous year.
When you’re below, the typical buyer of the past 12 months is sitting on a loss, which structurally weighs on sentiment. When you’re above, that pressure releases.
We talked about this extensively in October and November when the line sat around $102k. Once we broke and stayed below, we got the full crash to the current lows near $60K.
Currently, the 365-day moving average is around $95K, with price about 18% below. Until we reclaim it, the bias has to remain bearish.
First number on the board: $95K.
View live in OCM Studio: Regime Divider
Model 2: The MVRV Yearly Crossover
Stepping up the complexity a notch, we have the MVRV (Market Value to Realised Value). This is the best tool we have for measuring the overall profitability of the Bitcoin network.
High values mark cycle tops where the average holder is sitting on enormous unrealised gains. Low values below 1 mean the average holder is underwater.
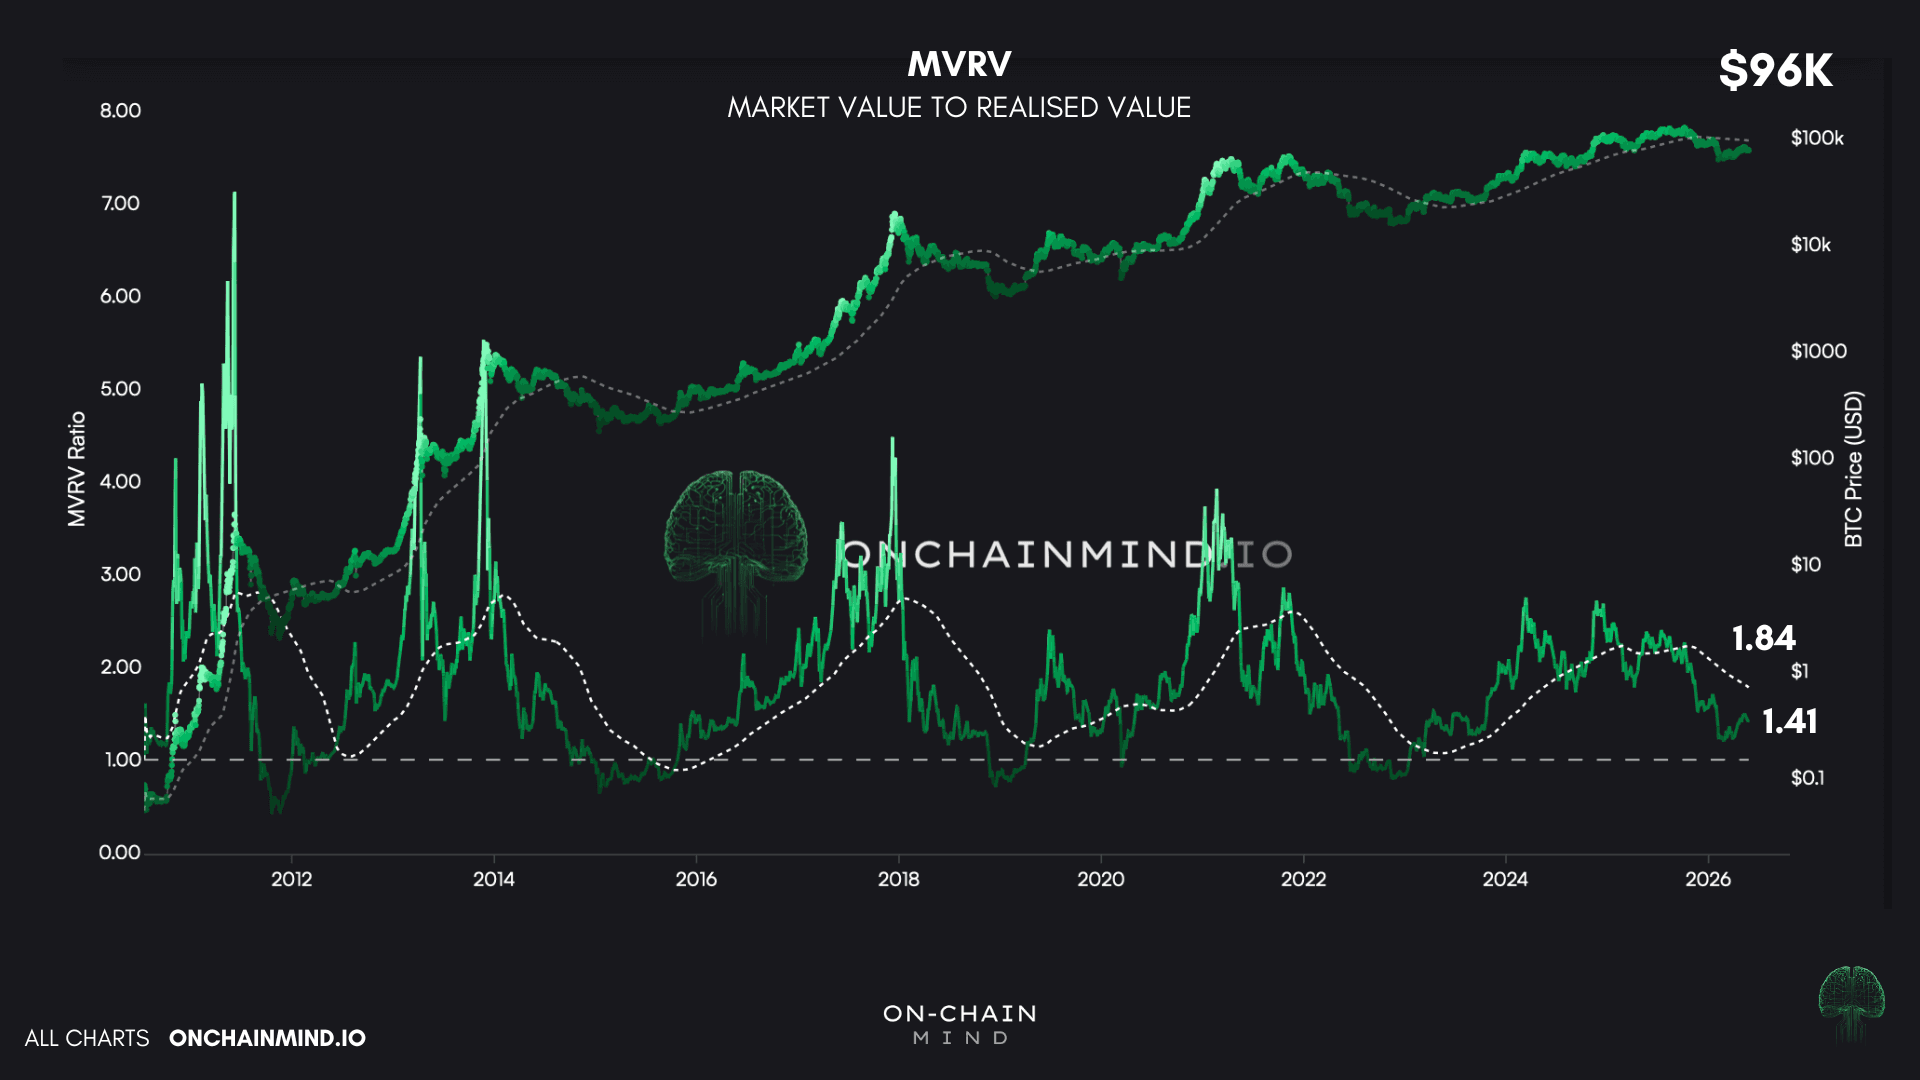
But the MVRV’s real power as a momentum signal isn’t the absolute reading. It’s when the raw MVRV crosses back above its own yearly average, a cross that has marked the start of every major bullish phase in Bitcoin’s history.
The reason this works is elegant. When the raw value crosses above the smoothed yearly average, network profitability is growing at a rate it hasn’t shown in over a year.
Since most Bitcoin bear markets last roughly a year, this tells us profitability is accelerating faster than the typical bear timeline. The whole system is becoming profitable again at an accelerating rate.
Currently, the MVRV is about 1.41, meaning the average holder is still 41% up in unrealised profit. The yearly MVRV sits at 1.84, so we’re about 23% below the long-term average. A linear interpolation of where the two would cross lands at roughly $96K.
That’s eerily close to the technical signal we just looked at. Two different methodologies, one based on price, one on the aggregate cost basis of the network, both pointing to essentially the same level.
Second number on the board: $96K.
View live in OCM Studio: MVRV Yearly Crossover
Model 3: The Z-Score Probability Waves
Stepping up the complexity another notch, we arrive at the Z-Score Probability Waves, hands down my favourite statistical and probabilistic model.
Bitcoin is a dynamic system that gets statistically overstretched and understretched in alternating cycles.
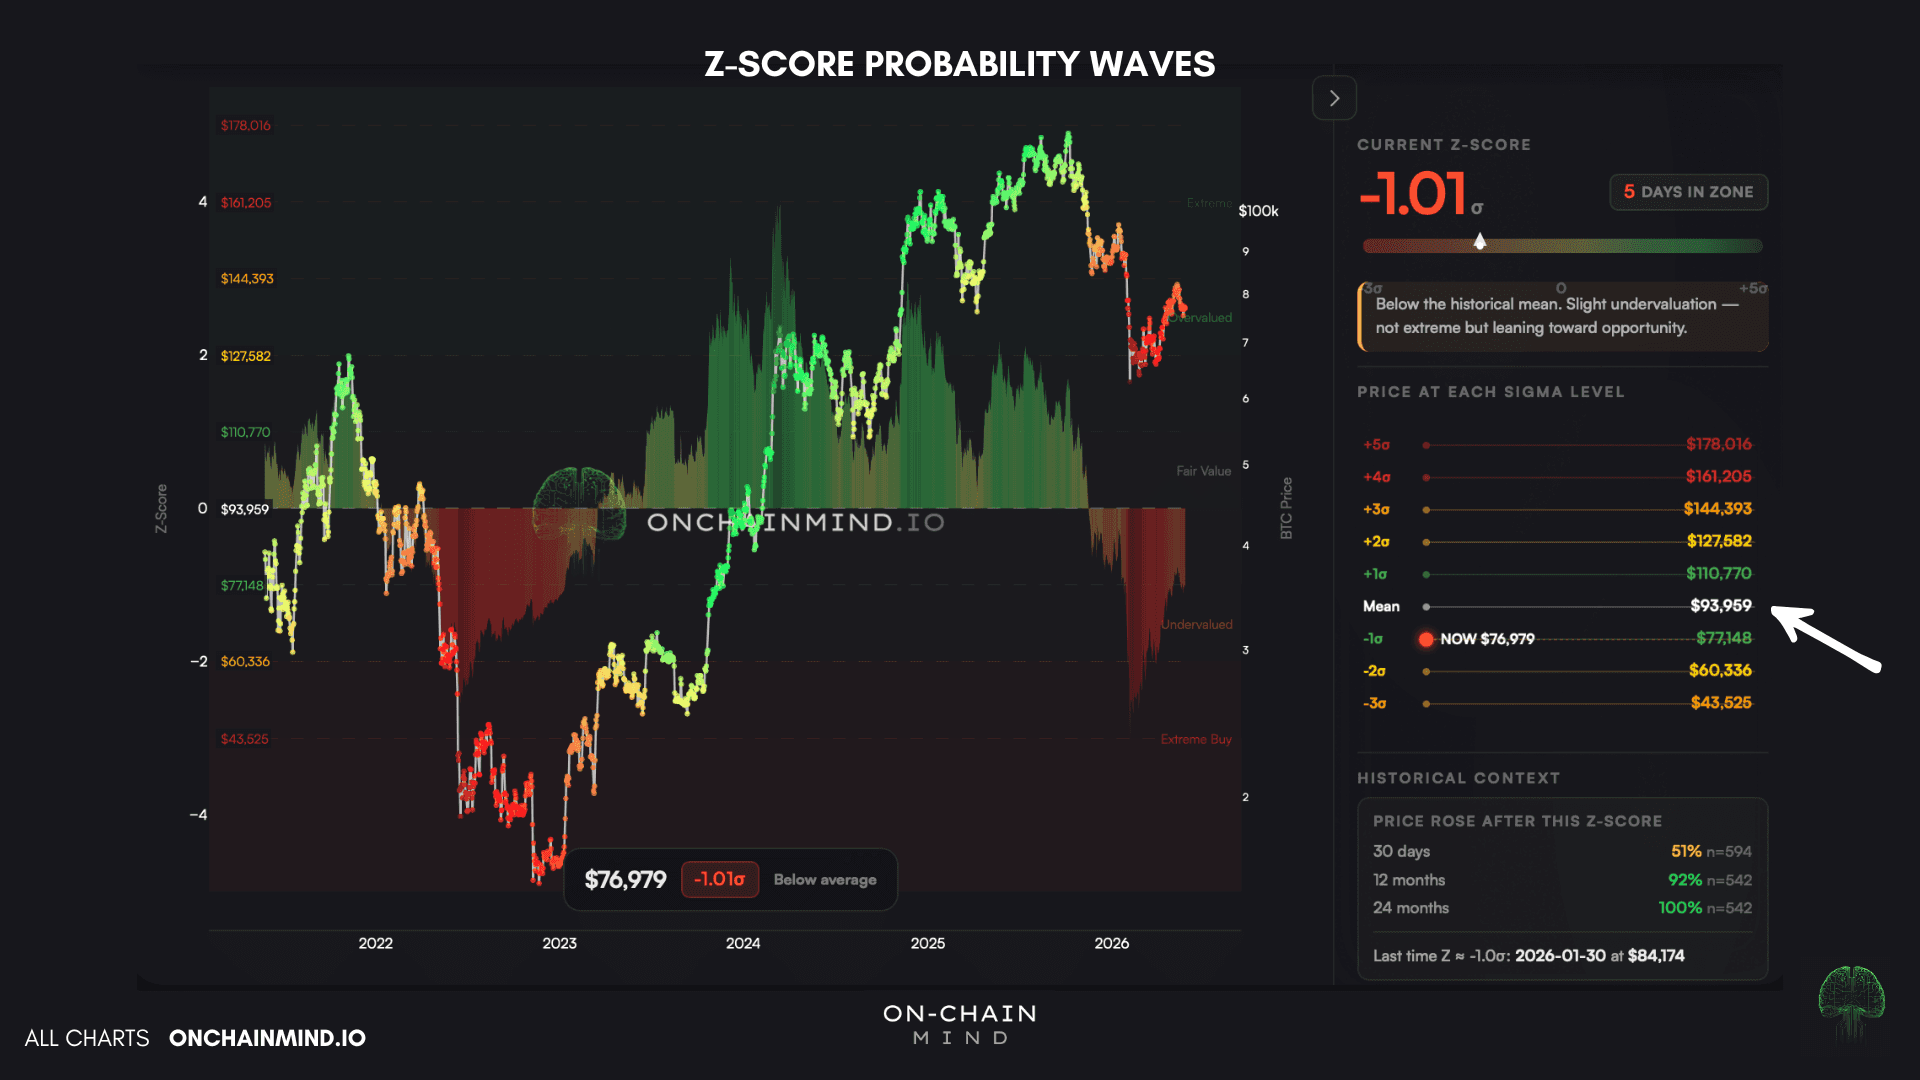
Think of it like a rubber band: when you stretch it, no matter which direction, it wants to return to its equilibrium point. That equilibrium, which is the zero line on the chart, is currently sat around $94K and has marked the transition from bear to bull market with remarkable effectiveness.
Right now, we’re clearly recovering from an extremely undervalued mean reversion event. A few months ago, during the February wash-off, we were deep in the red zone.
We’re not back at equilibrium yet, but $94K is the level that confirms the rubber band has fully snapped back.
Third number on the board: $94K.
View live in OCM Studio: Z-Score Probability Waves
Model 4: The Bitcoin Ω-Score
Finally, we arrive at the most advanced of them all: The Bitcoin Ω-Score.
This synthesises over a dozen metrics from distinct analytical families, blending valuation, on-chain profitability, technical momentum and more into a single 0-to-100% risk score for where we are in the Bitcoin market cycle.
The Ω-Score is primarily useful for buying the bottoms and selling the tops, those extreme 0 and 100 readings.
But it can be used differently: we look at when it crosses back above its 50% mark. This sacrifices some gains from buying the absolute bottom in exchange for confirmation that risk has materially improved.
The target price estimator for when the Ω-Score will likely cross back above 50% is $93K. An extraordinary level of confluence with everything else we’ve looked at.
The current reading is at 22%, and it’s spent 20 days in that zone. We’re still firmly in accumulation territory, but no longer in the deep value zone we were in around February and March, when the score sat in single digits for the first time in a very long time.
The panic has reduced. The market has bounced. But the model isn’t saying Bitcoin has fully flipped into a confirmed bull market yet. We’re improving, but we’re not there.
Fourth number on the board: $93K.

View live in OCM Studio: The Bitcoin Ω-Score
How I’m Actually Playing This
Continue reading with OCM Premium
You have been reading the free preview of this article. The rest of it (about 450 more words) is for OCM Premium members. See OCM Premium plans.