
Gold and silver are absolutely ripping right now, while Bitcoin is, quite frankly, being left behind. At least, that’s how it feels if you’re watching price alone. But whenever markets start to feel this one-sided, I instinctively take a step back and ask a much less comfortable question:
Are these assets actually low risk right now, or are they simply popular?
In this article, we’ll look at the market through the lens that actually matters over the long run: risk-adjusted returns. I want to explore whether rotating into precious metals here really makes sense, or whether the opposite trade is quietly becoming more attractive.
Key insights
The Resource Cold War: Global superpowers are stockpiling silver and gold as strategic national security assets, causing vertical price action.
Extreme Sharpe Ratios: Silver’s risk-adjusted return is at its highest level since the 1980s, suggesting the trade is overextended.
Mean Reversion Risks: Both gold and silver are trading at record deviations from their 200-week moving averages, signalling a bubble.
The Bitcoin Divergence: While metals hit 100% logarithmic risk, Bitcoin remains in a low-risk zone, presenting a superior opportunity.
The Modern Resource Cold War
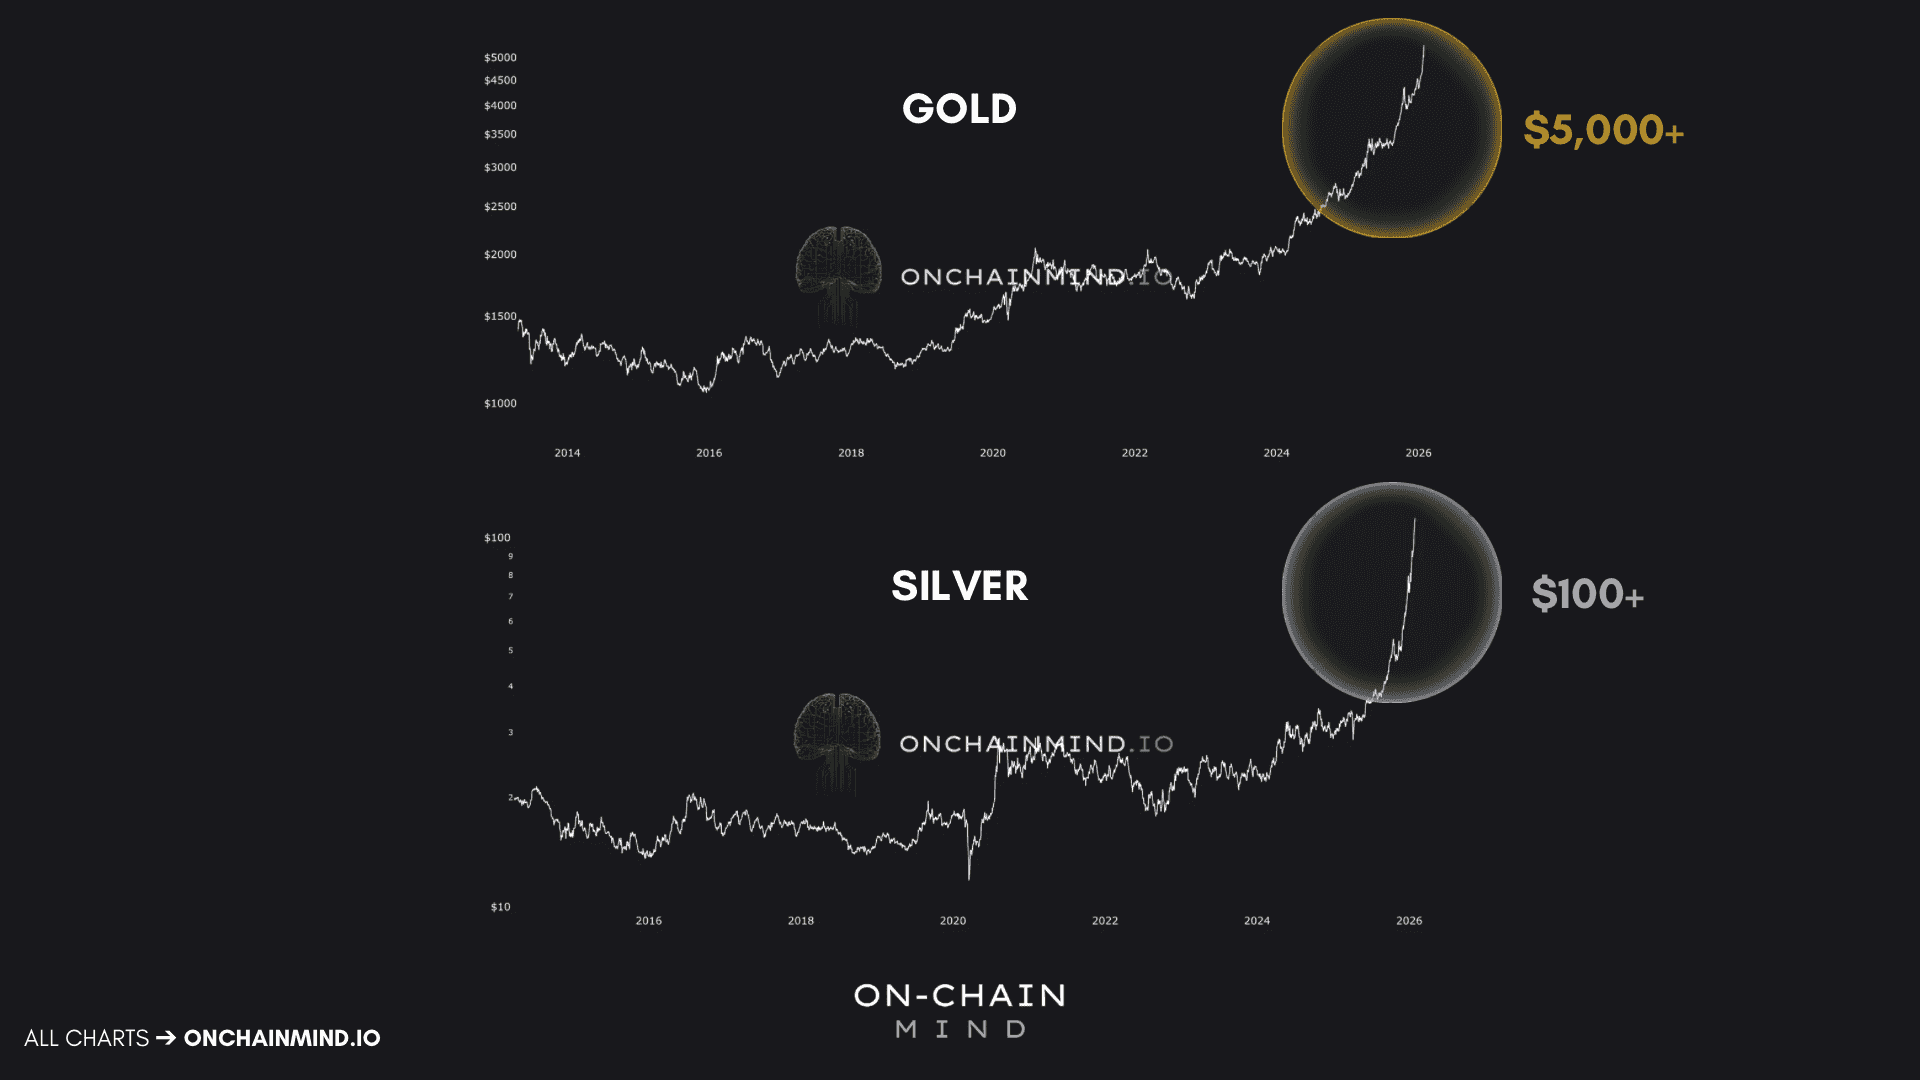
Gold, silver, and most precious metals are on what can only be described as a historic run. Gold has pushed beyond $5,000 an ounce, while silver has broken above $100 for the first time ever. These are not incremental moves or routine breakouts; they represent regime-level price behaviour.
The mainstream explanation is familiar and, to a degree, valid. Investors point to:
Safe-haven demand
Geopolitical instability
Concerns around US fiscal discipline and ballooning deficits
A growing distrust in central banks and the Federal Reserve.
These narratives matter, and they always have. But they fall short of explaining why this move is happening with such speed and intensity now.
Those same macro pressures have existed in various forms for years. They do not explain why liquidity has vanished so quickly, nor why price has accelerated in a way that feels almost vertical, particularly in a market like silver that is historically slow-moving.
What’s happening beneath the surface is far more aggressive.
Over the past year, we’ve entered a quiet but decisive phase of government-led resource accumulation that is fundamentally reshaping supply dynamics. In November 2025, the United States added silver to its critical minerals list for national security purposes. That decision triggered a federal buying programme that absorbed millions of ounces of silver with almost no mainstream attention.
China responded swiftly. In mid-December, it implemented a total export ban on silver, effectively locking domestic supply inside its borders. Silver is a strategic input for solar infrastructure, electric vehicles, semiconductors, AI data centres, and military technology. In other words, silver has quietly transitioned from a commodity into a strategic resource.
Gold has followed a similar path. China’s gold accumulation has reached levels not seen in modern history, as the country steadily converts fiat exposure into hard reserves. What we are witnessing is not a speculative frenzy in isolation, but a modern resource Cold War, where gold and silver are increasingly treated like oil was in the 20th century.
When governments begin hoarding supply in relatively small and illiquid markets, price does not grind higher. It gaps. And once liquidity disappears, particularly in silver, price behaviour becomes explosive.
At the same time, institutional and retail behaviour has aligned in a way that accelerates this dynamic even further. Institutions dislike being under-allocated to outperforming assets, while retail investors are driven by the fear of missing the next major trade. When both sides chase simultaneously, reflexivity takes over.
Silver has been adding entire Bitcoin-sized market capitalisations in a matter of weeks. For one of the slowest-moving assets in financial history, this is not normal behaviour. It is remarkable to watch, but it should also make you deeply uncomfortable.
Visually, the structure is hard to ignore. The steepening curve, the accelerating momentum, the growing belief that price only moves in one direction, it all bears an uncomfortable resemblance to Bitcoin in 2017. And that naturally raises the question of sustainability.
When Safe Havens Become Dangerous
To answer that question properly, we need to move away from narratives and look at risk through a probabilistic lens. One of the most robust and widely respected tools for doing this is the Sharpe Ratio.
The Sharpe Ratio measures an asset’s excess return over a risk-free rate, divided by the volatility of those returns. Put simply, it tells you how much return you are receiving for each unit of risk you are taking. This is the metric investors should be optimising for, not raw upside.
For this analysis, I’m using a 365-day Sharpe Ratio. Returns are annualised, a fixed 3% risk-free rate is subtracted for consistency, and the result is divided by the standard deviation of returns over the same period.
What this reveals is striking.
Silver’s Sharpe Ratio is currently the highest it has ever been in the entire dataset, which extends back to the 1980s. Not marginally higher, but meaningfully so. The implication is clear: while returns have been strong, volatility has risen even faster. On a risk-adjusted basis, this trade is no longer compensating investors adequately.
Historically, every time silver has reached these extreme Sharpe Ratio levels, it has been followed by a significant reversion. The most comparable instance occurred in 2011, after which silver endured a brutal drawdown that took over a decade to recover from.
Gold tells a remarkably similar story. Its Sharpe Ratio now sits at levels comparable only to 1980 and 2011, which were the two major peaks of modern gold history. These were not periods of low risk and high opportunity. They were moments of excess, driven by fear, speculation, and narrative reinforcement.

Detachment From Long-Term Value
Sharpe Ratios alone are never sufficient, so it’s important to confirm this picture with other long-term indicators. One of the most reliable is the 200-week moving average, which serves as a structural baseline for value. When price is near it, risk is typically low. When price stretches far above it, risk increases dramatically.
Silver’s current deviation from its 200-week moving average is unprecedented. Its long-term baseline sits around $30, while the current price is over 3.8 times that level. This represents a complete detachment from historical norms.
Gold mirrors this behaviour almost perfectly, with its highest deviation since 1980. That comparison matters, because 1980 was not a normal market environment. Gold’s surge at the time was driven by double-digit inflation, stagflation caused by oil crises, geopolitical turmoil, the collapse of Bretton Woods, and a collapse in confidence in fiat currencies. It was fear-driven demand on a global scale, and it did not end gently.
What often gets overlooked is that, on an inflation-adjusted basis, gold and silver have been poor long-term wealth builders since that era. These assets are designed for preservation, not compounding. They are famous for doing nothing for decades at a time.
So when they behave like high-beta momentum trades, history suggests risk is already elevated.

The Inversion Most Are Missing

Don’t Fall For The Same Mistake
Watch the video walkthrough on YouTube
Continue reading with OCM Premium
You have been reading the free preview of this article. The rest of it (about 650 more words) is for OCM Premium members. See OCM Premium plans.