
Our platform tracks more than 300 metrics across 70,000+ assets. But before I buy Bitcoin, I look at one.
This isn't minimalism. It's what happens when you watch 299 indicators disagree with each other every morning, each on its own timeframe, each telling a slightly different story.
That disagreement is valuable for deep analysis. For the simple question of how much risk the market is carrying right now, it is noise.
I’m about to show you the model that folds dozens of imperfect signals into a single score, where that score reads today, and what it showed when I ran it, unchanged, on Ethereum.
Let’s get into it.
Key insights
Confluence Over Clutter: We combine dozens of on-chain, technical and macro inputs compressed into one normalised 0-100% risk score.
Normalised Across Eras: A 2013 extreme and a 2025 extreme are read on exactly the same scale, despite diminishing returns.
The 50% Regime Line: We sit at 49% , up from 33% a month ago, which is a serious shift in market risk over a short period.
The Ethereum Test: The untouched Bitcoin framework produced identical quality signals on a completely different asset.
The Problem With 300 Charts
Analysis by paralysis is real, and I say that as someone who builds the very charts causing it.
You open a dashboard, and one favourite metric is screaming caution while another is telling you to back up the truck.
That happens constantly. Every single metric, no matter how powerful, throws false positives. The trick is not finding the one perfect indicator, because it does not exist. The trick is finding the moments when dozens of imperfect ones agree at the same time.
That is what The Bitcoin Ω-Score attempts to do, and many of my seasoned readers will be familiar with it.
It gathers dozens of my favourite signals from the on-chain world, from technicals, from macro, from derivatives, and amalgamates them into a single 0-100% risk reading. Deep blue at the bottom marks the most depressed periods the market has ever produced. The hot readings in red mark the frothiest.
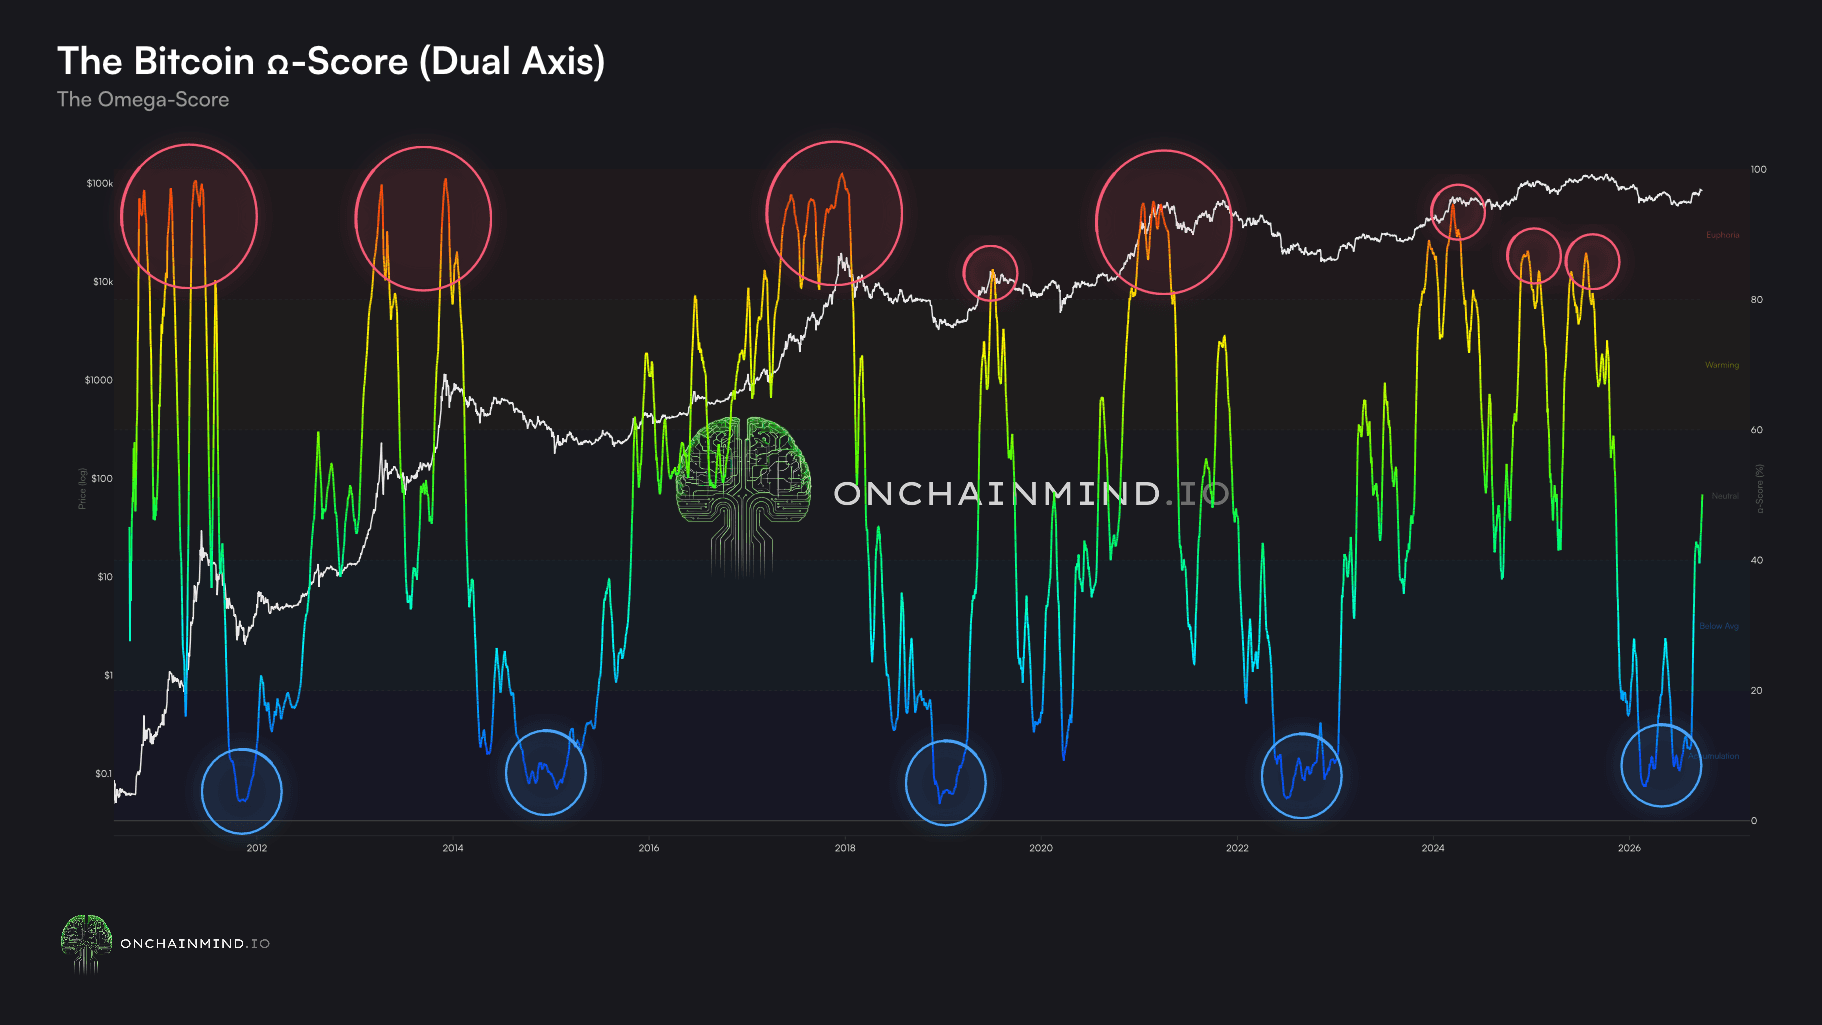
View live in OCM Studio: The Bitcoin Ω-Score (cycle)
Now here is the part most people skip past, and I believe it matters just as much as the inputs themselves.
The score is normalised.
This means that an extreme reading in 2013 is not treated as any more extreme than one today, because Bitcoin is a fundamentally different animal now. Bigger, deeper, more liquid, more institutional. The raw magnitude of moves simply is not what it was 12 years ago.
If you don't correct for that, your model quietly tells you every cycle is tamer than the last, and eventually it stops firing altogether. You end up with a beautiful historical chart that is useless going forward (check the raw MVRV if you don’t believe me).
Normalising means we measure how stretched the market is relative to its own era. Which means we can keep measuring it into the future, rather than watching the signal fade into irrelevance as the asset matures.
A Dial, Not a Switch
My regular readers know I treat this as a DCA dial rather than a binary buy or sell trigger.
I am not in the business of calling the exact top or bottom wick, and I genuinely believe anyone who tries is on a path to missing the boat entirely at some point. The people who need the perfect price are usually the ones still waiting for it when price is 60% higher.
So the rules I actually follow are boring by design. Below ~20%, I am accumulating heavily. Below 10%, I am accumulating a lot harder, and I ramp that percentage up the lower it goes. Above 70% or 80%, I am not accumulating really at all, and my bias flips towards scaling out of a portion of the position if anything.
There is also a second way to read the chart that I find even more useful, and that is the 50% midpoint.
When the score crosses convincingly below 50 at speed, it has historically preceded long stretches of significant underperformance as risk drains out of the market. When it climbs back above 50 with conviction, that has normally marked the start of the serious leg of a bull market. It is a regime line more than a level.
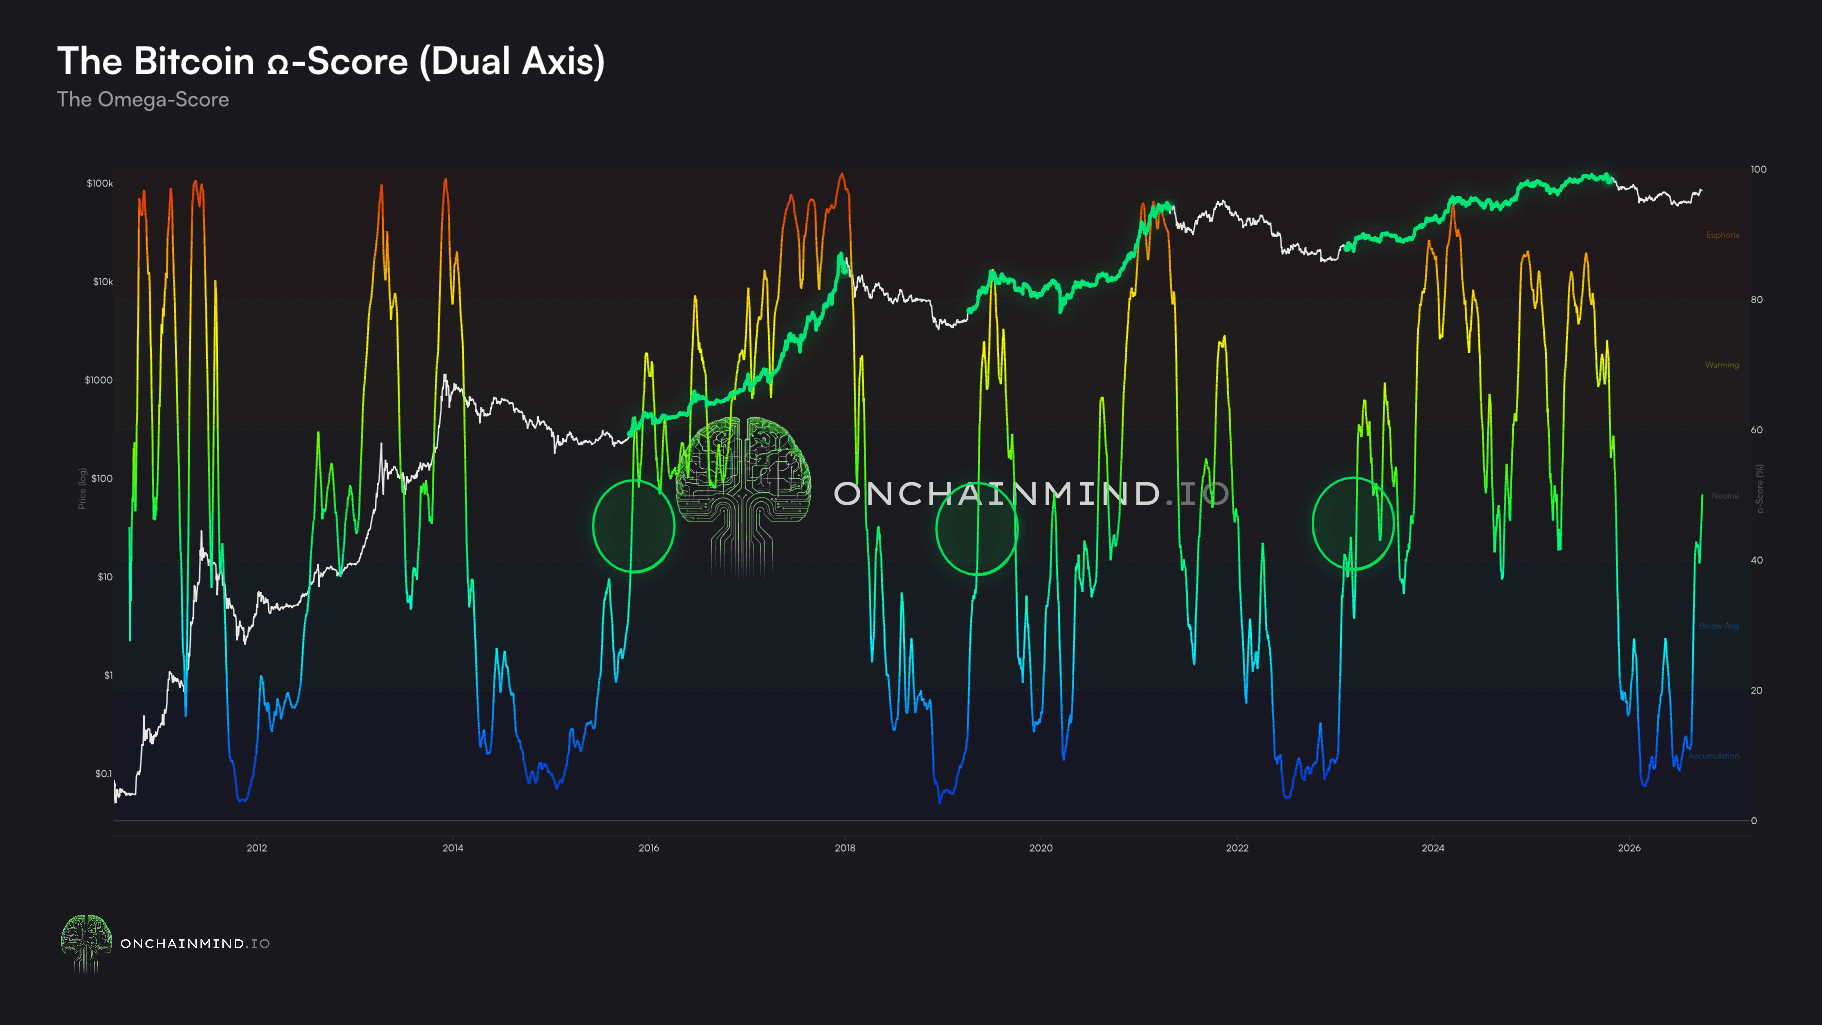
View live in OCM Studio: The Bitcoin Ω-Score (50% transition)
So where are we right now? The score currently sits at 49%. Thirty days ago it was just 33%.
That is a substantial repricing of risk in a single month, and we are sitting directly on the transition point.
Cast your mind back to earlier this year, when we crashed into the high $50,000s and low $60,000s. The score spent time in single digits. For me that was one of the loudest signals we have had that a bear market low was close, and we said so repeatedly in this newsletter at the time.
Could it have gone lower and stayed there for weeks? Absolutely. I did not know, and the model did not know either. But I was never waiting for a specific dollar or Omega number. I was DCAing into readings that told me risk was as depressed as it has ever been, which is a completely different discipline to bottom picking.
At 49%, I am still perfectly comfortable accumulating. However, if we start rocketing higher through this level, then that is when I’ll revisit how often I deploy into this market.
Local Timing and the Ethereum Test
There is also a short-term view of the same framework, and it exists because cycle positioning and entry timing are two separate problems.
The short-term version takes the same categories of data, on-chain, technical and broader market, but applies them over much tighter windows. And crucially, the two views can disagree with each other. You can be in a genuinely beautiful place in the cycle while being locally stretched enough that the next fortnight is likely to be miserable.
Right now, that is roughly where we are. The climb off the lows has pinned these short-term metrics into their upper range.
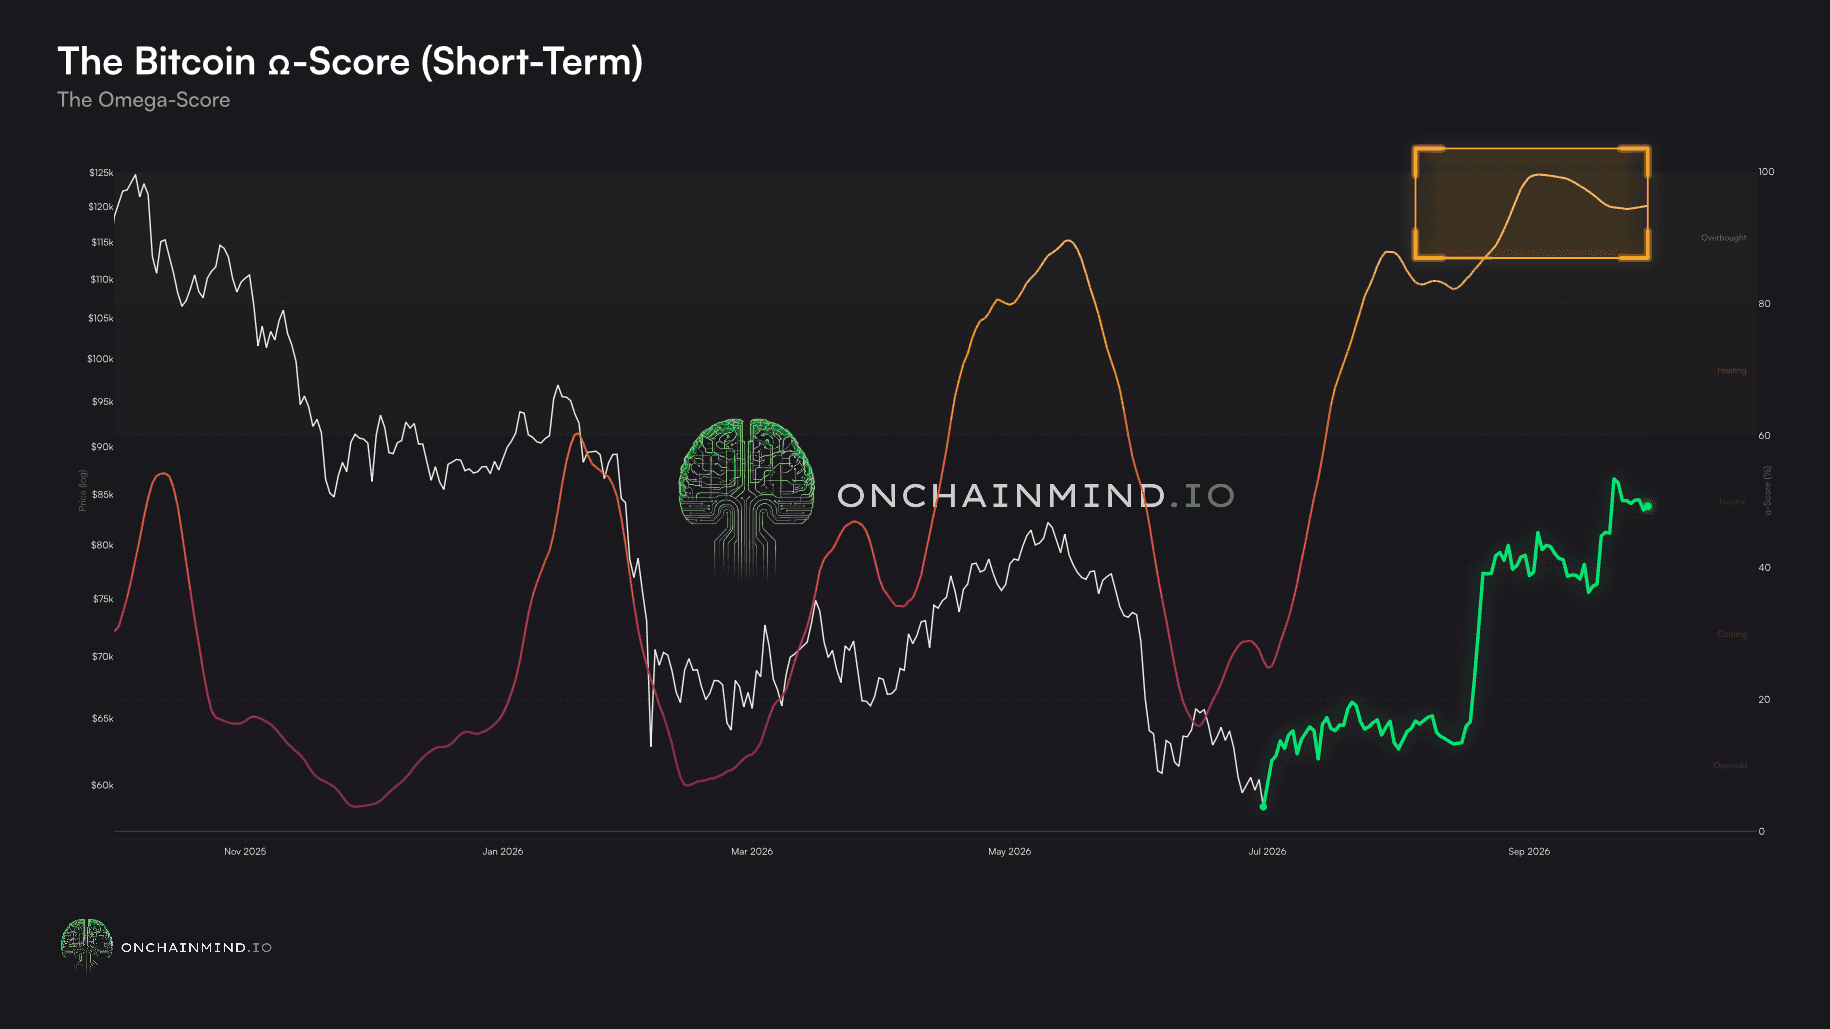
View live in OCM Studio: The Bitcoin Ω-Score (short-term)
For me that is not a sell signal. It is a slow down signal.
If you are DCAing, it is the moment I spread entries out rather than chase green candles with my whole monthly allocation. If you are swing trading, your risk-to-reward on a fresh long has quietly deteriorated, even though the narrative feels better than it has in months.
We saw this exact configuration at the start of the last bull market. Short-term readings pinned high, long-term readings still mid after lifting off the floor. In hindsight, that was not the moment to turn bearish. It was the moment to be patient through the chop.

View live in OCM Studio: The Bitcoin Ω-Score (last bull)
Now the part I found most interesting this week. We recently expanded the score to Ethereum, and I deliberately tried to change nothing.
I used the same metrics, same construction, pointed straight at a completely different chain.
The reason that test matters is simple. The easiest way to build a model that looks brilliant is to tune it until it fits history you already know, and that model betrays you the moment the future stops rhyming. Taking an untouched framework and aiming it at an asset that behaves differently is about as clean an out-of-sample test as you can run.
To my surprise, it held remarkably well. Deep blue clusters in the depths of the 2018 and 2022 bottoms, hot readings into the 2021 and 2025 highs, and the same behaviour around that 50% midpoint.
Which tells me we are measuring something real about investor conviction rather than curve fitting one asset's history.
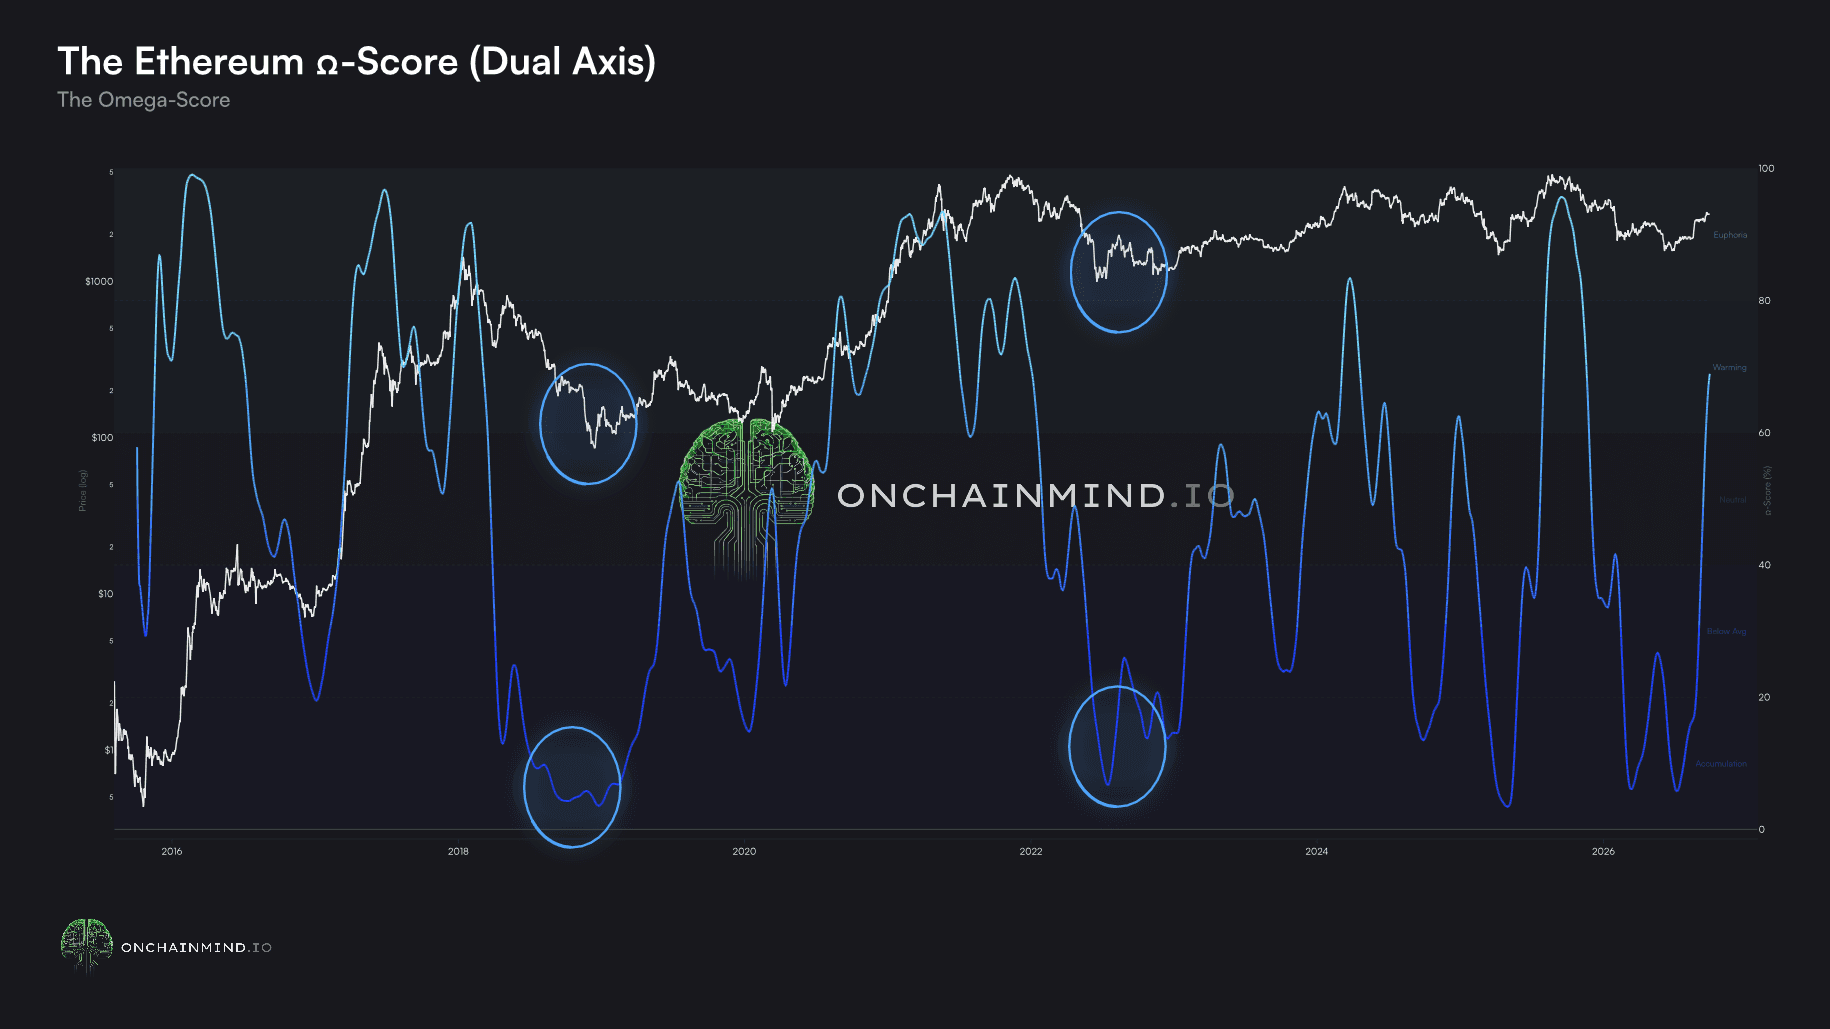
View live in OCM Studio: The Ethereum Ω-Score (cycle)
Both Sides Of The Coin
I will say the thing I actually believe, which is that on the day-to-day scanning of the markets, most people do not need more data. They need better data and more discipline, and those two problems look identical from the inside.
The Ω-Score solved a personal problem long before it became our flagship model. I was drowning in my own charts, flipping between conflicting signals, and making decisions based on whichever metric I happened to look at last.
Compressing them into a single normalised number did not make me smarter. It made me consistent, which is worth considerably more over a full cycle.
Right now the reading is pretty telling about where we are. 49% is not cheap and it is not expensive. It is a market that has repriced risk violently in a few months and is now sitting on the line that has historically separated the two regimes.
The short-term dial remains hot, and that is to be expected. But all this actually does is keeps me spreading my entries rather than chasing them into the rally.
I am not going to dress this current point up as a high-conviction moment, because it isn't one. It is a continuation moment, and those are the ones where most people talk themselves out of a perfectly good plan.
My ask is the one I always make. Go and try to break it. Point it at your own timeframes, disagree with it, stress test it against the periods you remember most vividly.
A model you have not tried to destroy is not a model you should be trusting with your capital.