
Bitcoin rallies are supposed to be loud. Right now, we're sitting in the 1st percentile of volatility readings over the past 7 years.
The last time Bitcoin registered a reading this low, price was at $19,000 in October 2022. What happened next is now legend.
We're back in that same reading today, except price isn't at the bottom of a bear market. This is one of the calmest rallies Bitcoin has produced in nearly a decade, and yet it's pressing directly into the most contested resistance zone of the cycle.
But calm doesn't mean safe, and a bullish trend doesn't mean it's time to buy.
This article is about what the silence is really telling us, how I'm positioning at this critical level, and where price wants to go if the breakout holds.
Let’s get into it.
Key insights
The Volatility Paradox: Bitcoin's quietest rally in years is actually a structural signal worth paying close attention to.
Critical Price Confluence: Multiple high-signal levels are clustering around our current price, increasing the probability of a decisive move.
Buying Into The Trend: We make the probabilistic case for/against entering positions at the exact level we're trading at right now.
Liquidity Targets: Our Liquidity Density Nodes reveal a clear path if resistance breaks, and the probability of a rejection outcome.
The Fractals Are Whispering
The Volatility Fractals indicator has been one of the most reliable tools in my arsenal for years, and the underlying logic is elegantly simple.
It's a custom volatility intensity meter built on classic Williams Fractals. When the purple zones shoot up into those bright white readings, it tells you the market is making unusually powerful and impulsive moves.
Spikes in this indicator have historically marked both capitulation events and local euphoria phases, because volatility itself is the fingerprint of conviction at extremes.
What makes the current reading so unusual is that it's doing the exact opposite of what you'd expect during a rally of this magnitude.
Volatility has actually decreased as price has climbed, which is structurally rare. We're sitting in the 1st percentile over the past 7 years, meaning 99% of the time over that window has been more volatile than this current moment.
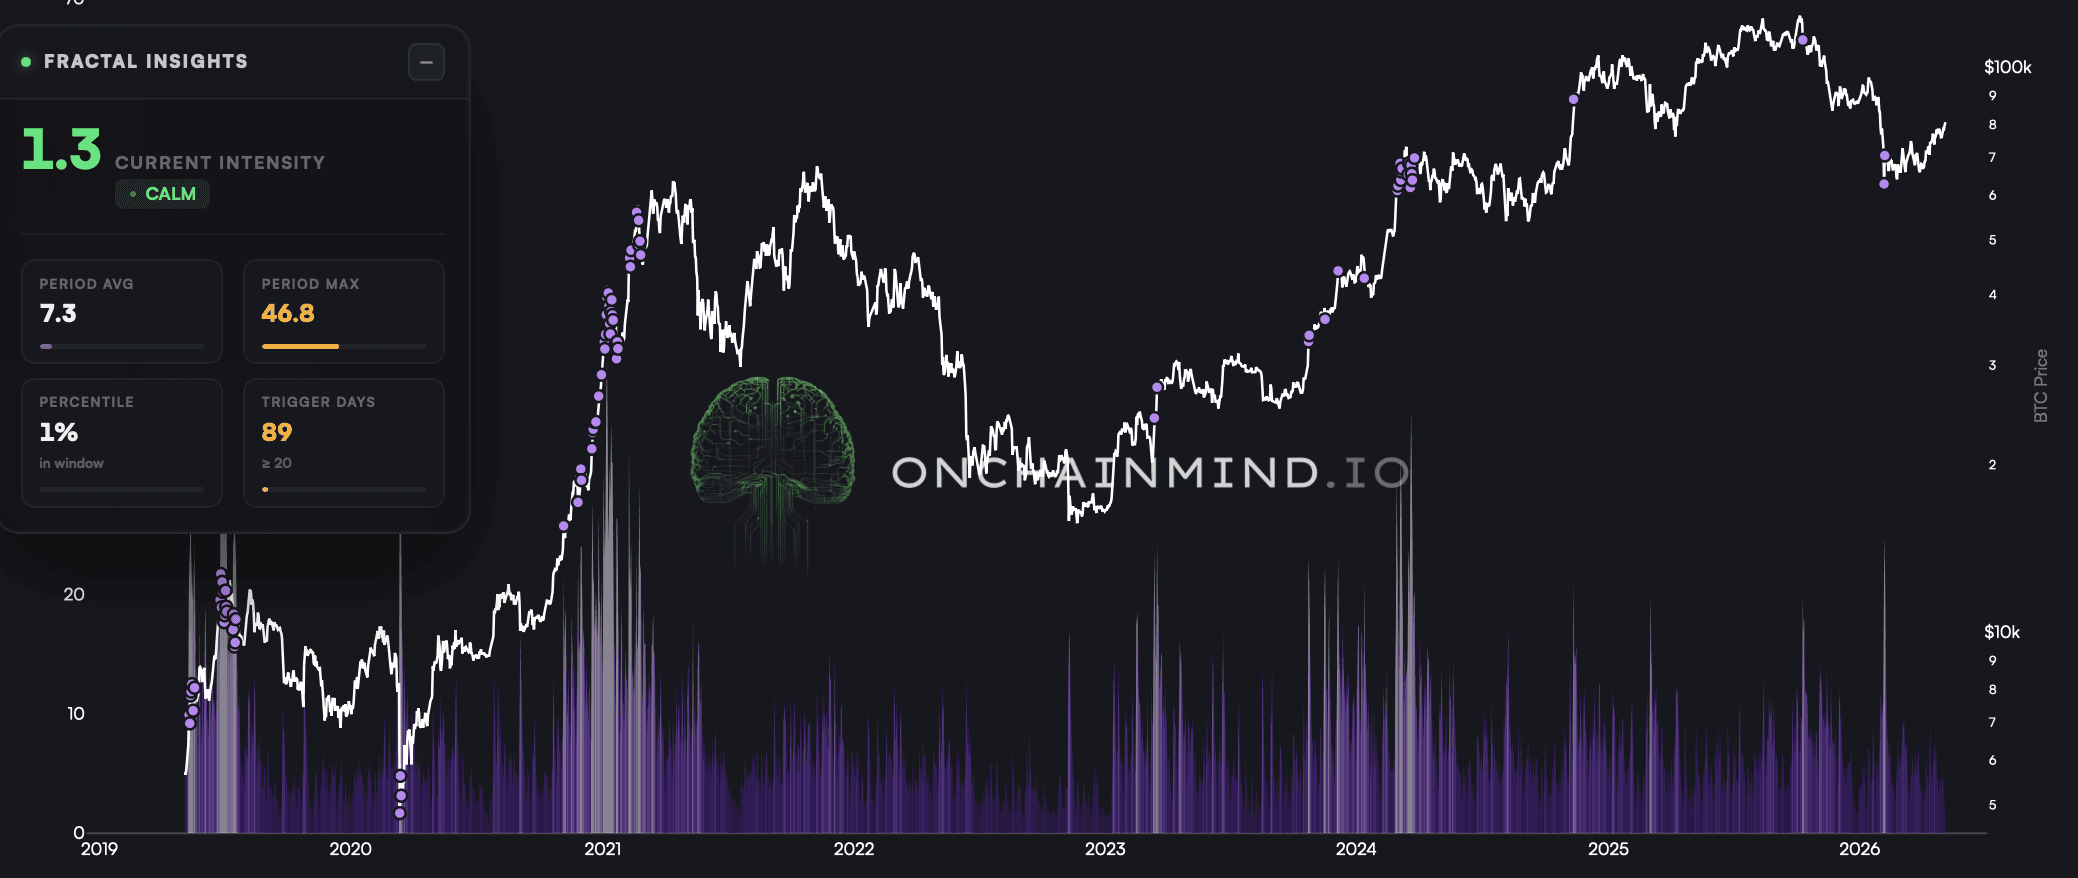
View live in OCM Studio: Volatility Fractals
So what does that actually mean for Bitcoin? The volatility compression is one piece of the puzzle, but it's the confluence with our key pricing levels, trend models, ETF flows, and liquidity nodes that defines the trade.
In my view, suppressed volatility during an uptrend is a double-edged signal.
Continue reading with OCM Premium
You have been reading the free preview of this article. The rest of it (about 2,050 more words and 5 more charts) is for OCM Premium members. See OCM Premium plans.