
Everyone is currently holding their breath, waiting for Bitcoin to either skyrocket again or continue plummeting, yet the data suggests the most likely outcome is something far less cinematic: absolutely nothing.
We are currently living through a historical anomaly that most market participants are completely misinterpreting, and understanding the "mathematics of boredom" is the only way to survive what comes next.
Let’s get into it.
Key insights
The Consolidation Constant: Bitcoin spends nearly half its life doing nothing, frustrating traders who expect constant volatility.
Breakouts Are Rare and Finite: Even in extreme markets, breakout phases average around a month, and directionally bias upward 61% of the time.
Extreme Downtrend Regimes: The current 84% breakout-to-downside streak is a historical anomaly approaching 2017 levels of extremity.
Bottoms are Boring: Sustainable market floors are forged through time-based exhaustion in consolidation rather than price-based capitulation.
The Illusion of Constant Motion
If you spend enough time on crypto Twitter, you’ll be convinced that Bitcoin is a sentient beast that only knows how to sprint. Whether it’s a moon mission or a death spiral, the narrative is always one of extreme movement.
My own Twitter/X poll illustrated this beautifully:
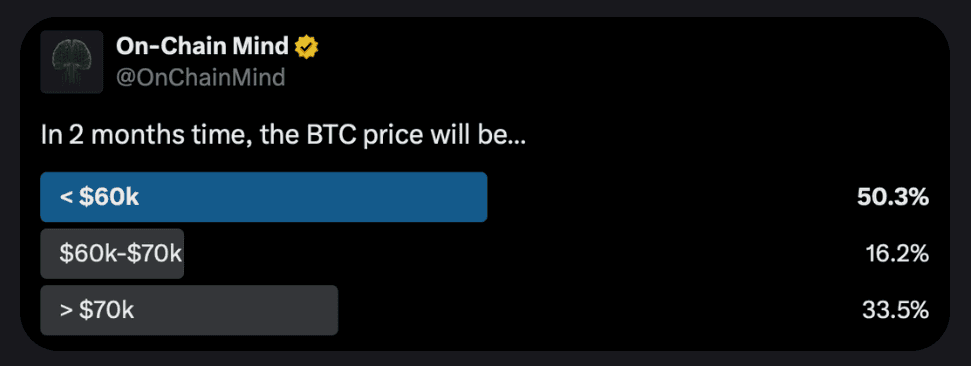
Most expected prices below $60k, some expected BTC to trade above $70k. However, only 16% expected it to do neither and just remain in its current range.
Most traders assume Bitcoin is a perpetually moving asset, either surging or collapsing, but when we look at the return distribution, a different reality emerges.
On a daily basis, Bitcoin’s return distribution is close to normal. In plain English, that means on most days for the vast majority of its existence, the price change has been negligible. This isn’t unique to Bitcoin either. Even higher octane crypto assets like Solana show similar behaviour, albeit with slightly fatter tails due to higher volatility.
But the pattern is clear: markets spend about half of their time in “boring” low-activity regimes.
Mathematically, Bitcoin has spent roughly 46% of its existence consolidating. Nearly half the time, the price simply chops sideways. Only the remaining 54% of the time is spent in what we can call “breakout phases”, when price trends aggressively up or down.
So while breakouts dominate the imagination, they’re actually the exception, not the rule.
View live in OCM Studio: Bitcoin Return Distribution
Understanding Consolidation and Breakouts
Let’s break down what consolidation and breakout really mean. I’ve decided to define this with a composite metric of 4 quantitative signals:
Volatility Ratio: Short-term realised volatility divided by long-term volatility. When below 1, price action is quieter than usual, signalling compression.
Range Compression: Measures how tight daily high-low ranges are relative to historical norms. Shrinking ranges indicate energy is building, but not yet released.
Bollinger Band Squeeze: Tightening bands show a classic coiling effect. The more compressed, the higher the potential energy stored in the market.
Directional Clarity: Assesses whether price is moving with intent or drifting aimlessly. Low directional clarity = noise, not trend.
Combined into a single score, these metrics give an objective view of whether Bitcoin is consolidating or breaking out.
When applied to the past year, the results are telling: we have spent 84% of this year so far in a downside breakout phase. This is actually the 2nd most extreme reading in Bitcoin’s history. Almost no periods of consolidation have appeared, and that is historically rare.
Patterns in Time
Zooming out, the market naturally oscillates between two roughly equal distinct volatility regimes: compression and expansion.
The average consolidation lasts about 30 days, while average breakout phases extend slightly longer at 36 days. When you understand this 30/36-day rhythm, you realise that the market is a breathing organism. It inhales (compresses) and exhales (expands). Currently, however, the market has been exhaling to the downside for so long that it is effectively running out of breath.
The one anomaly we’ve noticed in the data is 2017, when Bitcoin rose from $780 to $19,000 in a near-perfect parabolic move. Consolidation here was practically absent, accounting for only 7% of the trading action that year.
That extraordinary upward breakout was followed by a brutal 2018 bear market, where Bitcoin fell roughly 72% to $3,000. Yet even then, the market spent most of its time consolidating rather than collapsing in straight lines.
This illustrates a critical point: markets need pauses.
Even in the most aggressive conditions, the structure of consolidation underpins sustainability. Floors are built through time, not instant drops in price. Weak hands are shaken out, and a base is laid for the next cycle.
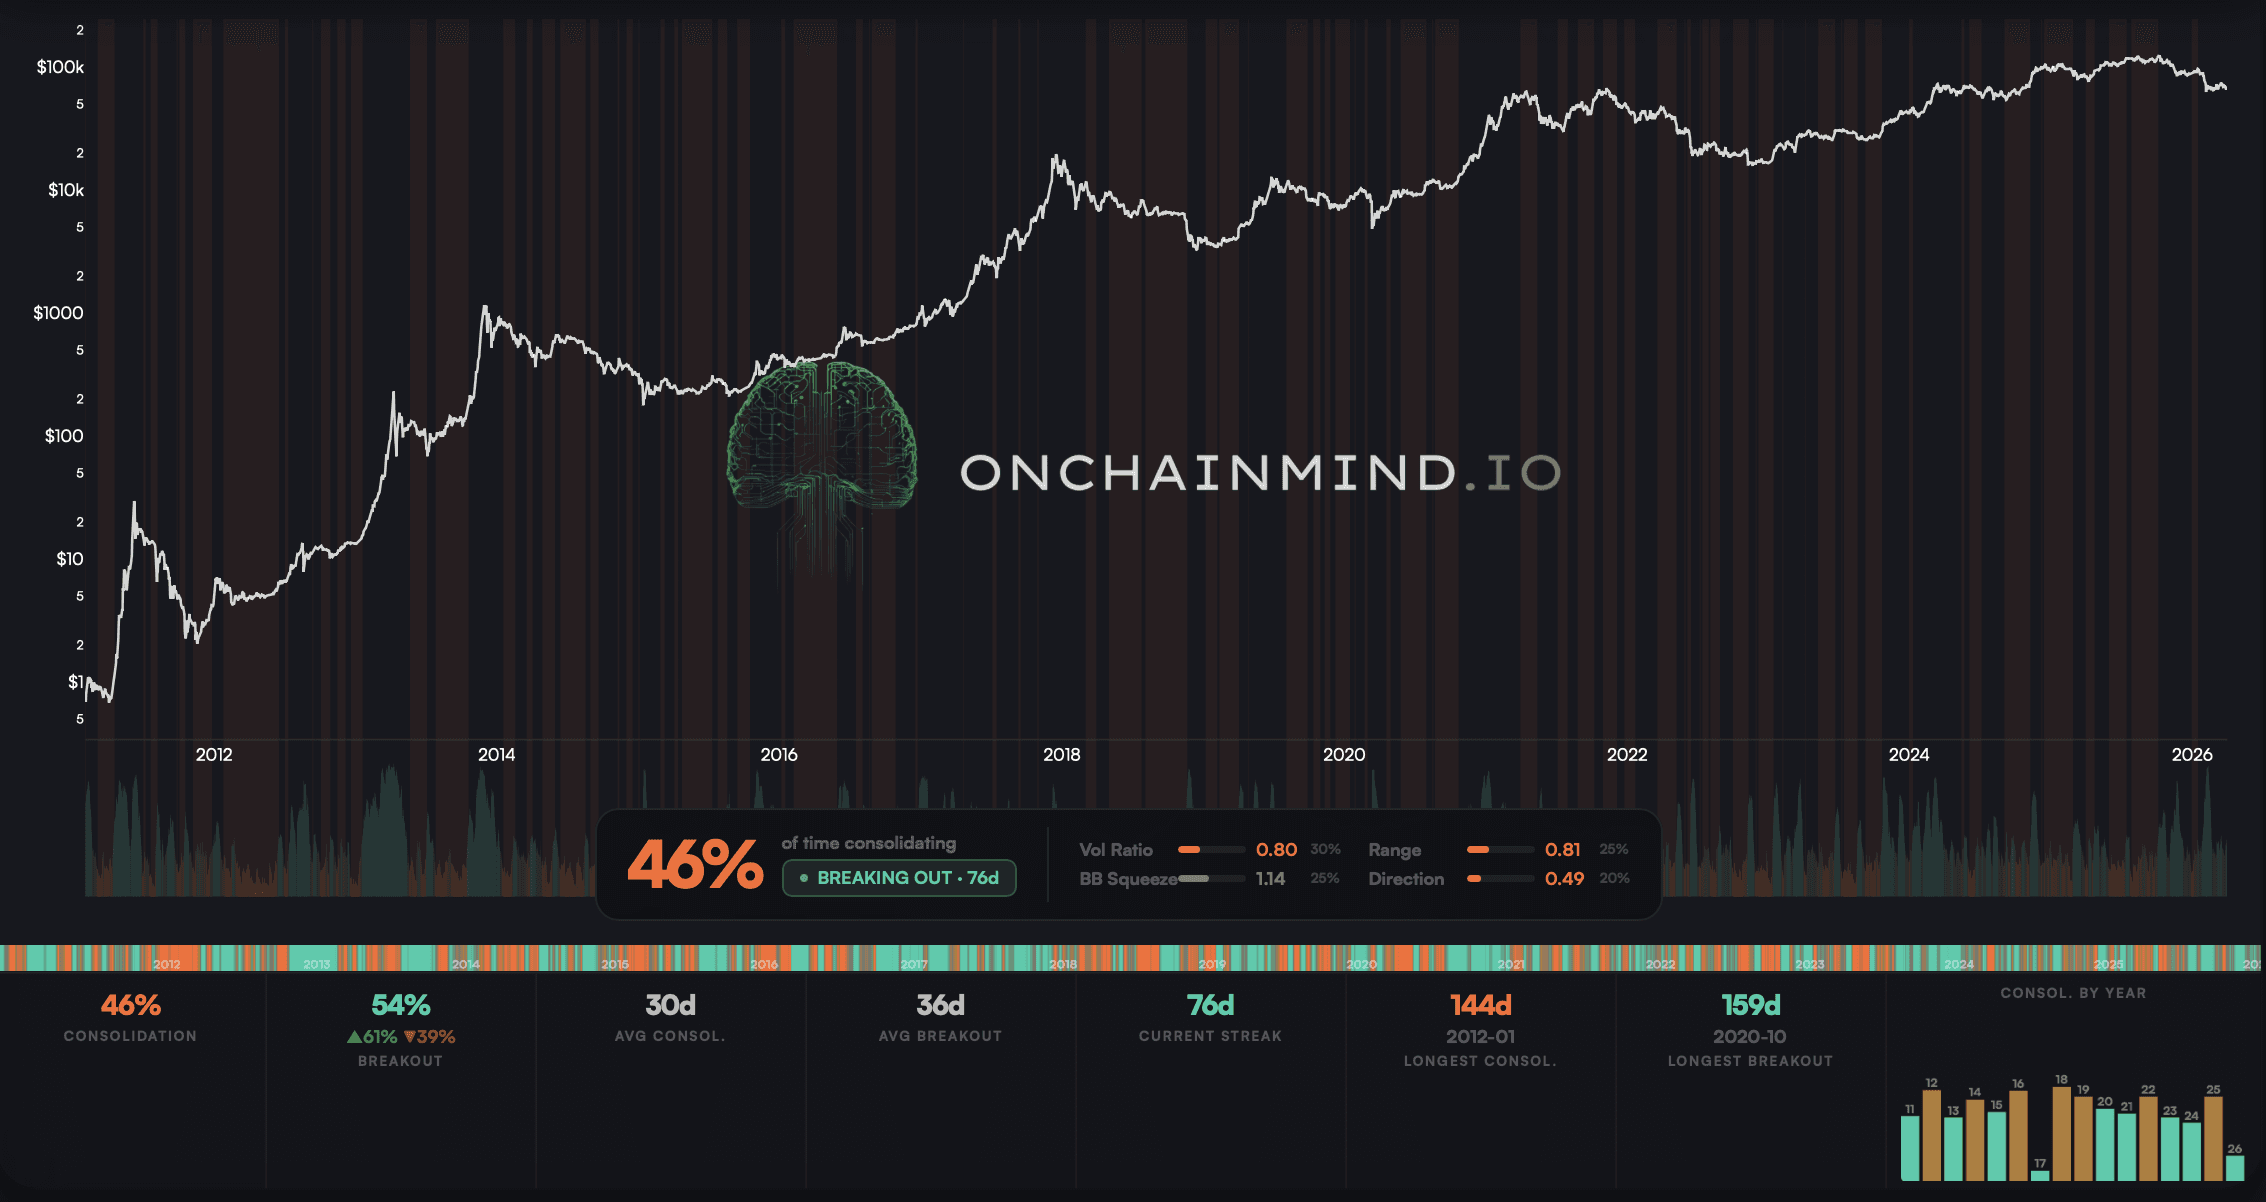
View live in OCM Studio: Consolidation Gauge
2026 — The 2 Potential Scenarios
So where does that leave us today? Well, we are currently operating at the very edge of historical behaviour.
In 2026, Bitcoin has spent around 84% of its time in a breakout phase. And unlike 2017, this breakout is to the downside. The streak is intense and historically rare, and the data tells us it cannot continue indefinitely.
There are two ways I see this playing out:
Mega Aggressive Downtrend: Bitcoin continues a prolonged capitulation, mimicking an “inverted 2017”. While not impossible, this would be unprecedented in history, as previous bear markets always include many periods of consolidation.
Mean Reversion to Boredom: A slow, sideways phase where the market digests prior moves, frustrating traders and building a base for the next bull market. This aligns with historical patterns and is, in my view, the far more probable scenario.
This transition won't be a V-shaped recovery. It won't be a God candle that sends us back to $100,000 overnight. Instead, it will be a slow, frustrating, and drawn-out process of base-building and leaky negative price action.
This is where time pain takes over from price pain. Most investors can handle a quick 20% drop, but they cannot handle 6 months of the price doing nothing. They get bored, they rotate into hotter investments, and they eventually capitulate out of sheer impatience.
Even the most aggressive downtrends eventually reach a statistical equilibrium. This is why expecting the market to continue falling unchecked is an exercise in ignoring history.
How to Bet on the Boring Path
Watch the video walkthrough on YouTube
Continue reading with OCM Premium
You have been reading the free preview of this article. The rest of it (about 350 more words) is for OCM Premium members. See OCM Premium plans.