
For most of this year, the Strategy Lab has been the quiet workhorse of the On-Chain Mind Studio, showing you exactly what would have happened if you had followed our models to the letter.
It was good. V2 is something else entirely.
Every model has been torn down and rebuilt. Every strategy was put on trial against its rivals, and only the strongest three per model survived. A fifth model has joined the line-up. And the whole Lab has been redesigned from the ground up, on desktop and on your phone.
Somewhere in all that testing, one strategy emerged that actually stopped me in my tracks. It is built on what Bitcoin's most patient holders are doing, it sidestepped both of the last two bear markets almost untouched, and I will be running it with a portion of my own portfolio.
Let's get into it.
Key insights
15 Strategies, Rebuilt: Every model now runs only its 3 strongest strategies, each one tested against dozens of rivals.
The Long-Term Holder Edge: A brand-new on-chain strategy that finished 2018 and 2022 essentially flat while Bitcoin collapsed.
What Leverage Really Does: The Lab's new leverage engine shows what 2x does to a strategy that rarely falls hard.
Built to Be Broken: Hold-out years, Monte Carlo fans and cost stress tests show whether an edge survives reality.
Open to Everyone This Weekend
The Strategy Lab is normally for Premium members only. To celebrate V2, I'm opening it up to every reader this weekend.
Have a go with it: https://onchainmind.io/indicators/strategy-lab
Pin a strategy, change the settings, run it through the tests and try to break it. Early next week the Lab goes back behind the Premium wall, so make the most of it while the doors are open.
From V1 to V2
V1 ran four models carrying eight strategies, and if I'm honest, the line-up was uneven. Some were brilliant. Others were average.
V2 starts from one harsh rule: every model keeps its three best strategies and nothing else. To earn a place, each had to beat its rivals from several start dates, across neighbouring settings, with higher costs and a day's delay, and on a hold-out period it never trained on.
The measure I leaned on hardest is return per drop: annual return divided by the worst peak-to-trough fall. It decides whether a strategy is actually holdable, because a strategy you can sit through will always beat a better one you can't.
Here is a taste of what survived, each against holding over the same dates, after costs:
Ω Short-Term Switch: around 100% a year since 2013, against 70% for holding.
Z-Score Smoothed Cross: around 67% a year since 2014 against 51%, with a worst fall of 35% against 83%.
Sentiment Crossover: around 74% a year since 2018 against 29%, with a worst fall of 35% against 77%.
Adaptive Trend Confirmed: finished 2018 flat while Bitcoin fell 73%.
That is the real story of V2. These strategies don't just beat holding. They do it by sitting out the bear markets, which is exactly where buy-and-hold does its damage.
The Strategy That Stopped Me in My Tracks
The newest model in the Lab is Holder Profit Momentum, and its lead strategy is the one I want you to pay closest attention to: Long-Term Holder Momentum.
It is built on the MVRV, the ratio of market value to realised value. In plain English, it is the price compared with what holders actually paid for their coins. This strategy reads it only for long-term holders, the coins that have sat still for roughly 5 months or more.
The rule is beautifully simple: when long-term holders' MVRV is more than 2.5% above its own 120-day average, it holds Bitcoin. When it slips back below that line, it holds cash.
Since April 2014 it has made 73.4% a year with a worst fall of just 36%. Holding made around 51% a year with a worst fall of 83%. That is a return per drop of 2 against roughly 0.6 for buy-and-hold, more than three times the reward for every unit of pain.
And look at how it handled the two worst years in recent memory:
In 2018, while Bitcoin fell 73%, it lost 1%
In 2022, while Bitcoin fell 64%, it gained 3%
The logic is about conviction. When the profit of the market's most patient hands climbs faster than usual, the trend has real energy. When it sinks back to its recent norm, the move is fading, and the strategy quietly steps aside.
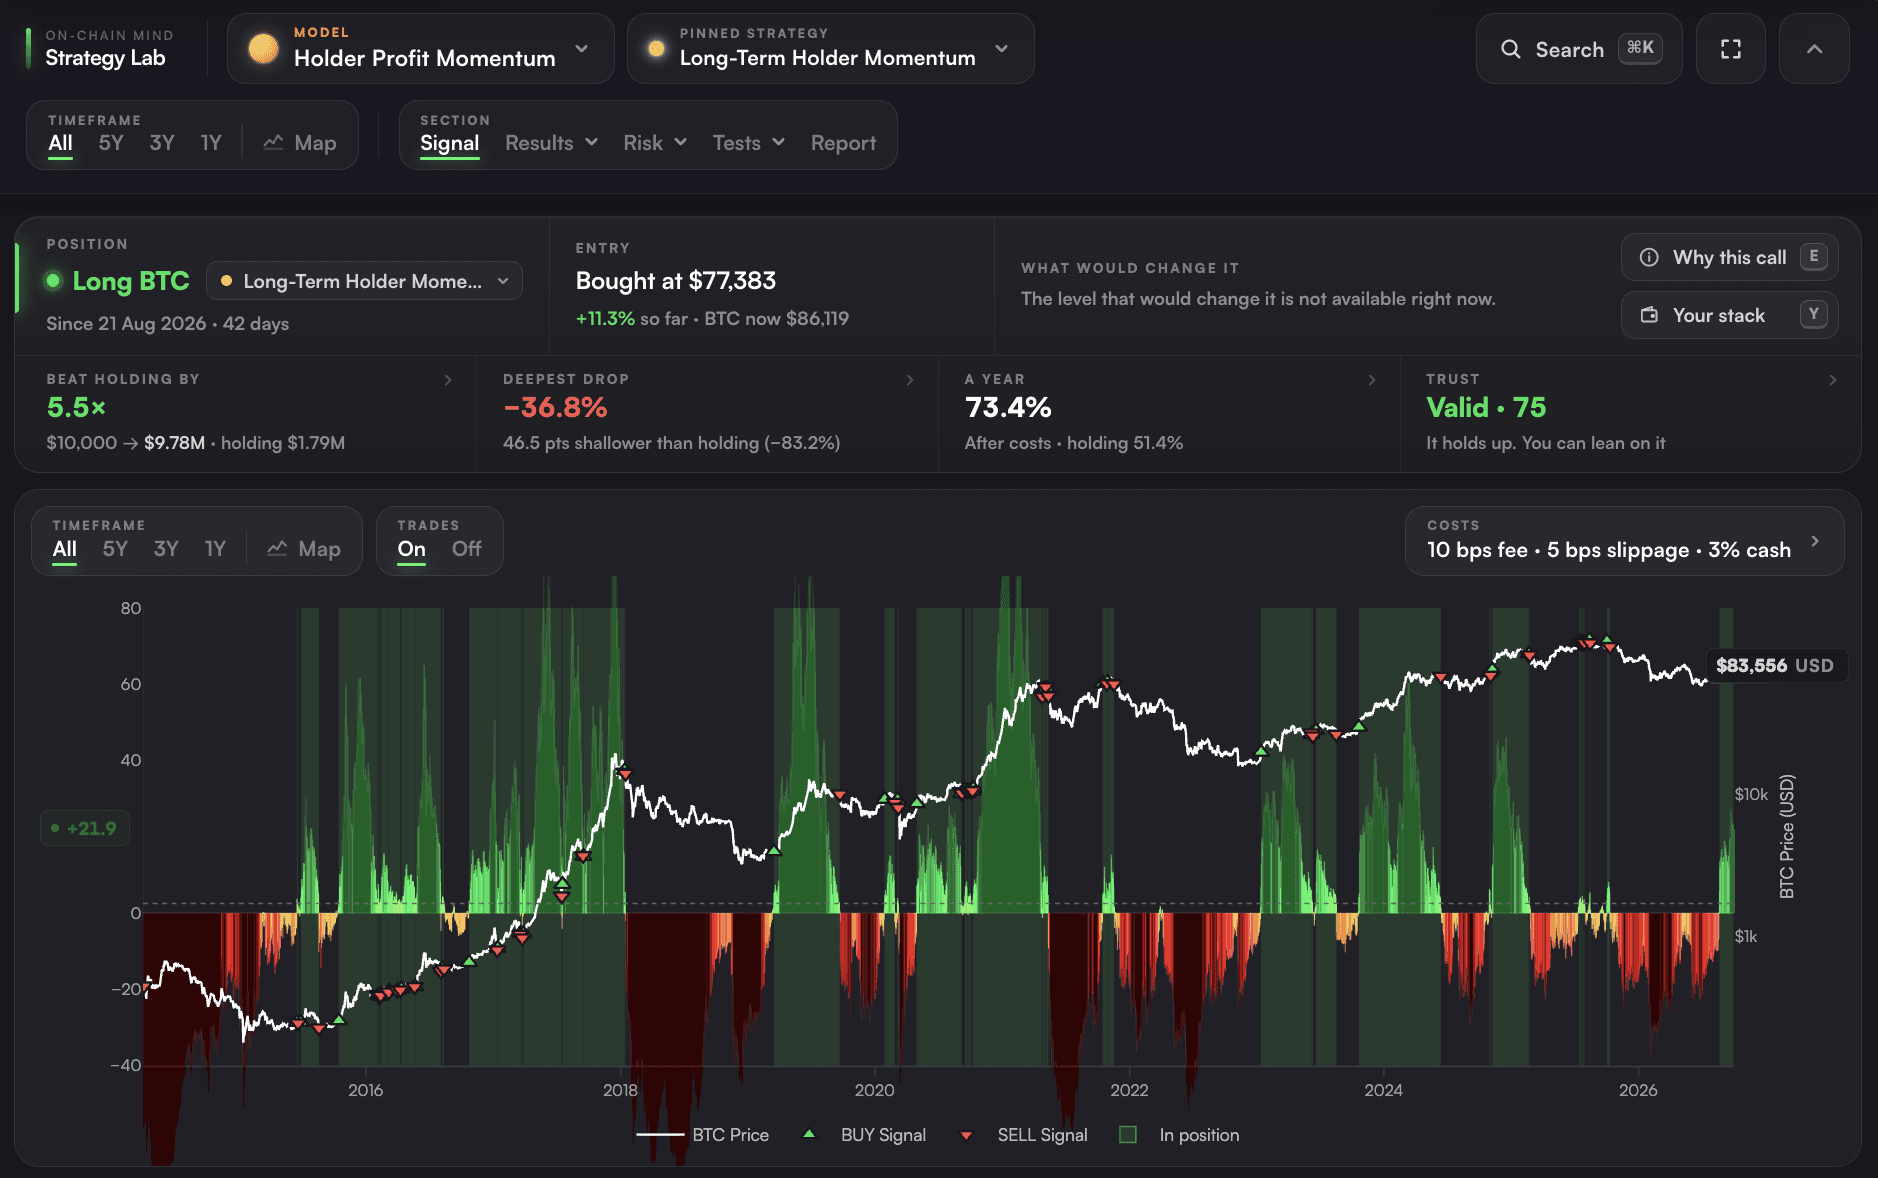
View live in OCM Studio: Long-Term Holder Momentum
Inside the Lab
All of that power was pretty much wasted in V1 because it was hard to read. V2 opens like a morning briefing. One table shows every model, the call it is making today, and how it has fared over the past year. Click into any model and the Signal view tells you whether to be in Bitcoin or cash, what would change that call, and the exact trade that would bring your own stack into line.
And there is more coming. Within the next couple of weeks, alerts arrive in the Strategy Lab. Pick your favourite strategy and you'll get an email the moment it triggers an action. No more checking charts every morning.
I want to give you a very quick overview before you go and try the new features yourself. Behind the lab front door sit the three sections that do the heavy lifting: Results, Risk and Tests.
Results: The Edge
Results is where you see whether a strategy's edge is real or just a good story.
The Leaderboard puts all 15 strategies across all 5 models on one table, each over its own full history with holding's figure right beside it. Rank them by annual return, by return per drop or by return per swing, and click any row to open that strategy.
Around it, Overview shows how $10,000 (or your set amount) would have grown against holding, a staged DCA and even the S&P 500 and other benchmarks. Compare lines every strategy up as a ledger. The Trade Log lists every single fill, and Rolling shows whether an edge is steady or came from one lucky stretch.
A strategy with one monster year and seven mediocre ones is not a strategy. It's an anecdote. Results shows you which is which.
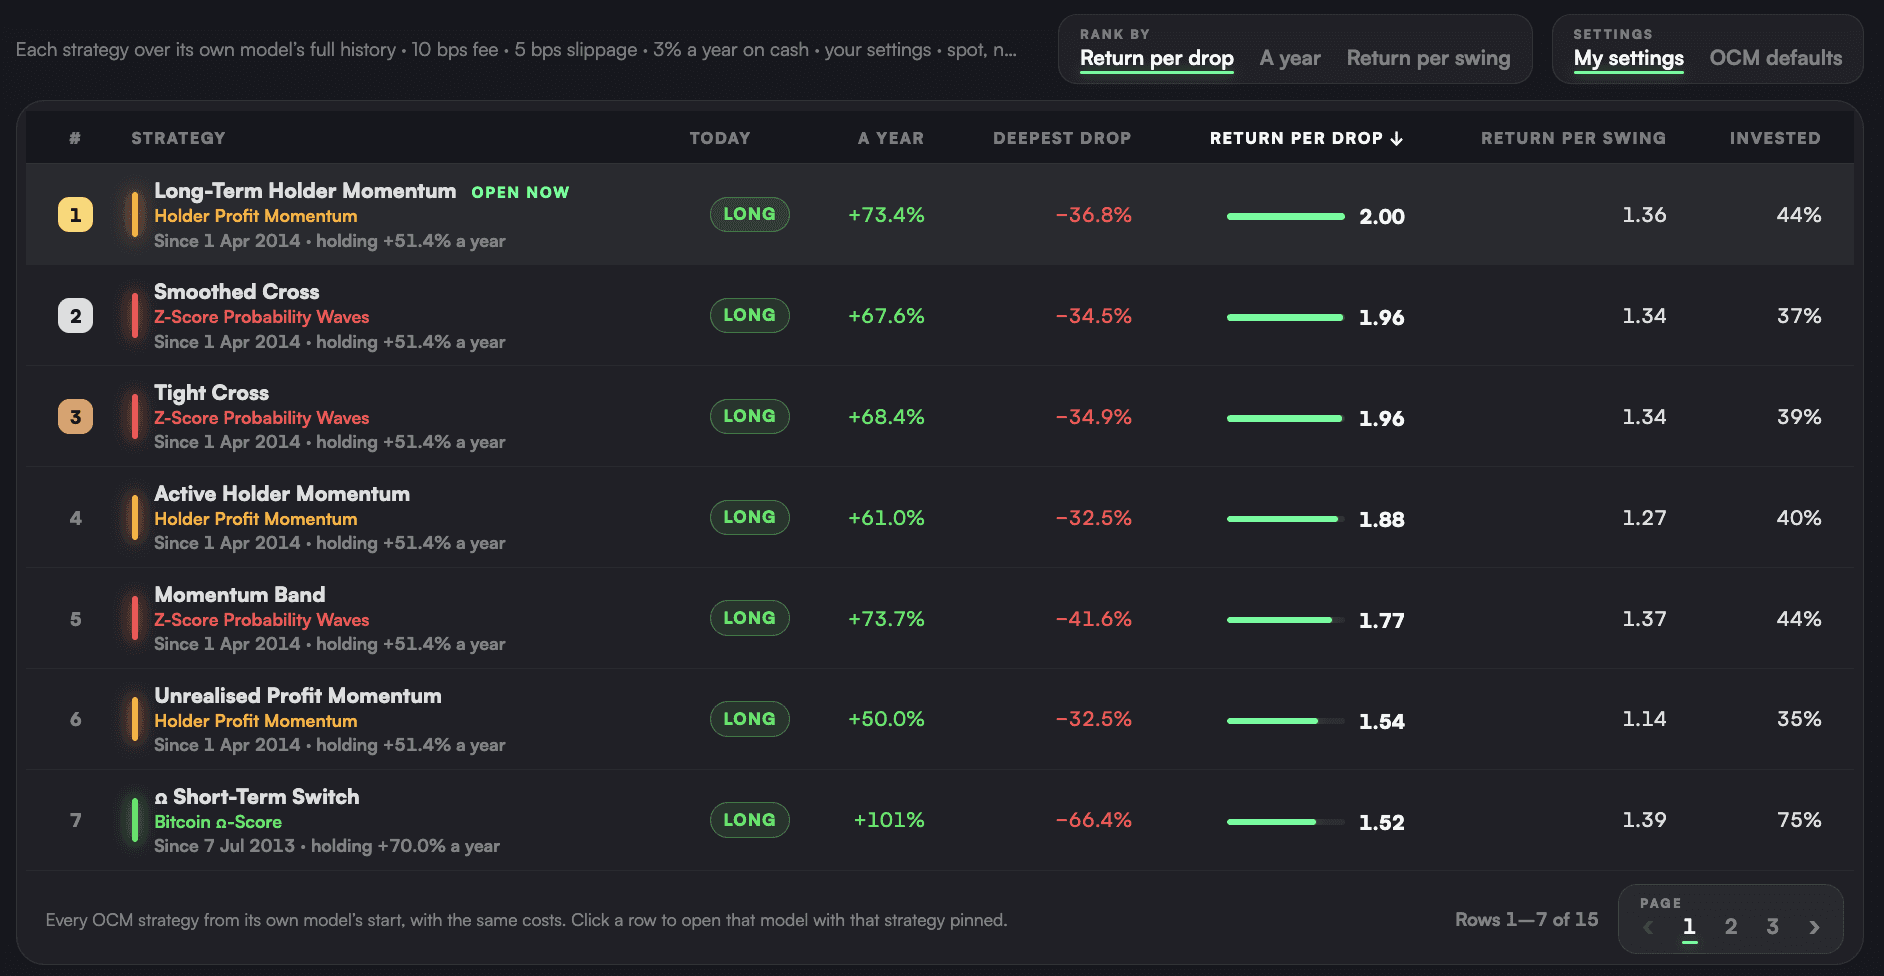
View live in OCM Studio: Leaderboard
Risk: The Pain
Drawdown shows how far each strategy fell and how long it took to recover. Regime shows how it behaved in bull and bear markets. And then there is Leverage, the feature I find most eye-opening of all.
Let me be very clear first: I use leverage very carefully, and nothing here is financial advice.
Leverage multiplies everything, drawdowns included. A strategy that regularly falls 80% is simply wiped out at 2x, which is why most people who use margin on Bitcoin end up with nothing. The Lab doesn't hand you a flattering fantasy either: it charges interest on every borrowed dollar (defaulted to 8%), checks your margin at every daily close, and pays the same fees and slippage as every other run.
The Long-Term Holder Momentum strategy rarely falls hard, so I ran it at 2x. Unleveraged, $10,000 since April 2014 grows to roughly $10 million. At 2x, the same $10,000 became around $195 million: roughly 120% a year, with a worst fall of around 50%.
A 50% drawdown is still brutal, but it is a smaller fall than holding Bitcoin has delivered in every bear market, with twice the exposure, and 100x a buy-and-hold outcome.
I want to be completely clear: none of this is financial advice or an endorsement. I’m simply showing what a rigorous backtest of our models produced, using realistic fees and charges.
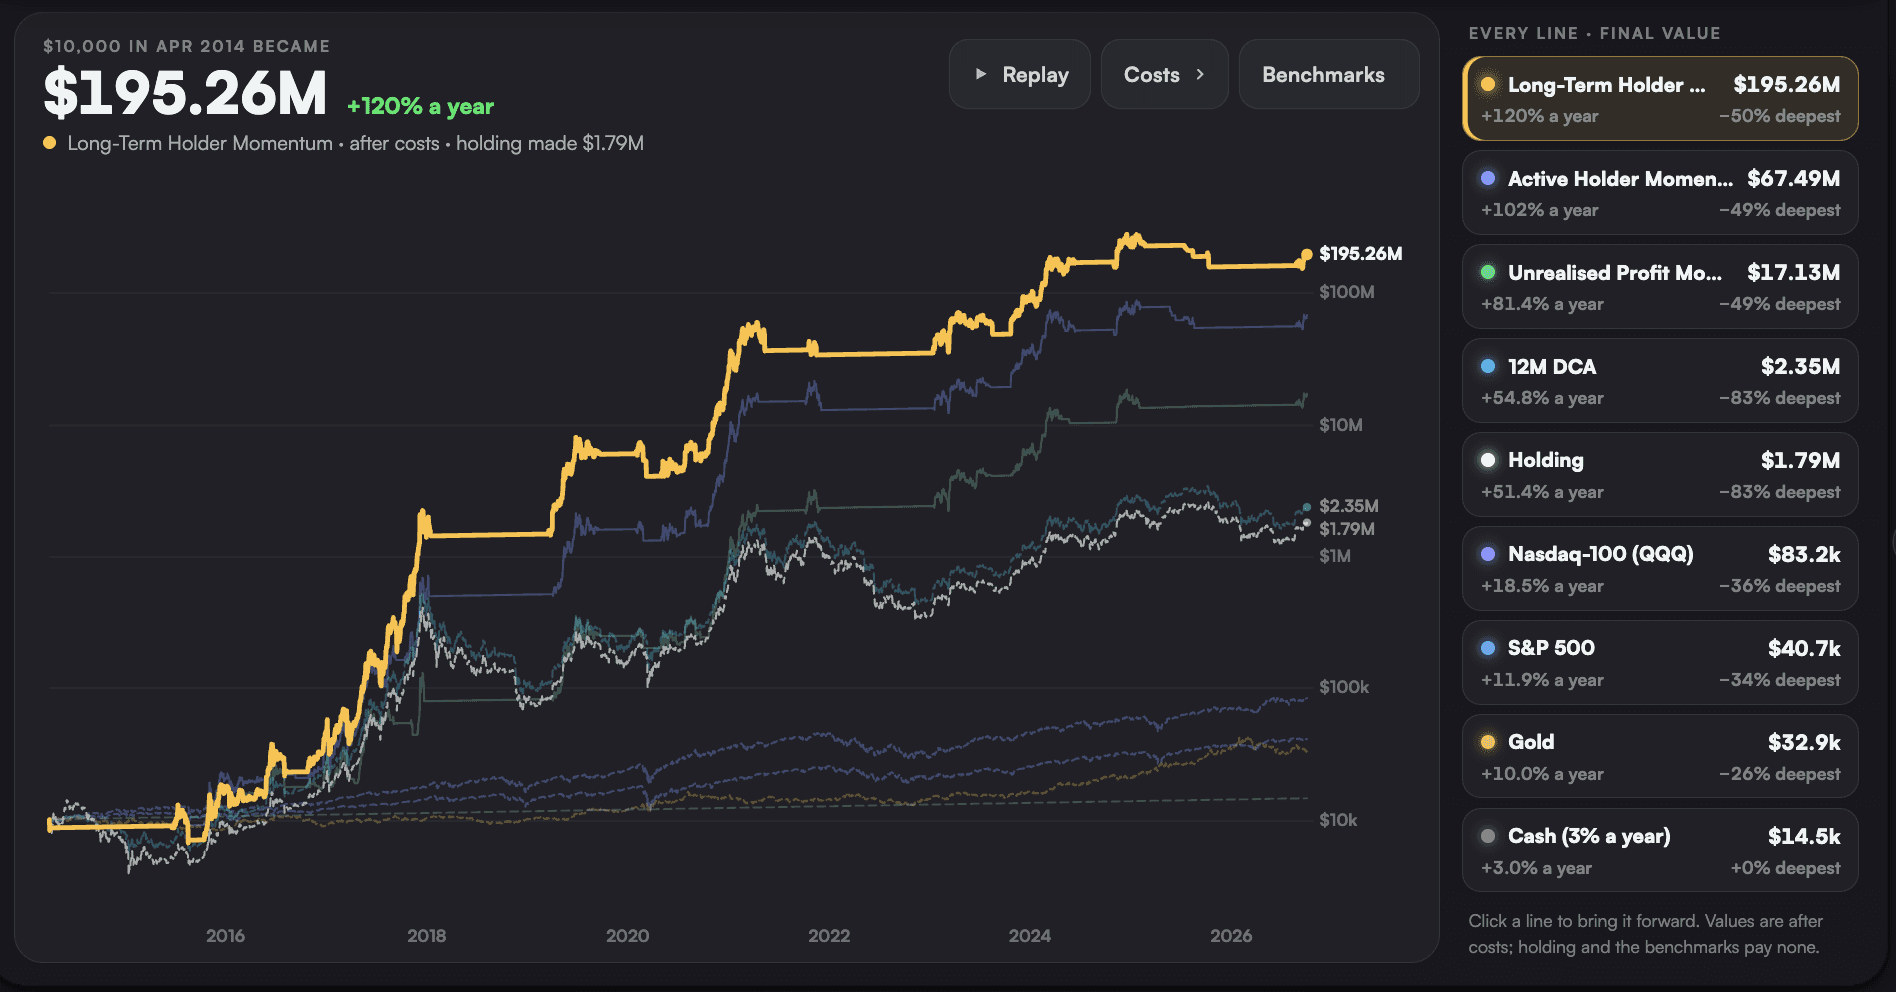
View live in OCM Studio: Leverage Outcome
Tests: The ‘What-If’
This is the section I'm proudest of, because its entire job is to prove us wrong.
The Trust board runs four tests on whatever strategy you've pinned and gives you one verdict:
The hold-out checks the years it never trained on
Monte Carlo reshuffles history over and over to show the spread of outcomes it could have had
Sensitivity nudges every setting to make sure it isn't standing on a knife-edge
Costs and delay asks what survives if your fees are higher and you act a day late
Each strategy passes each test comfortably, and I wouldn’t be satisfied with a strategy that didn’t.
Every reading in the Lab is also built point in time, so no day in the backtest can see data from its own future. That single rule is the difference between a backtest and a cherry-picked fairy tale.

View live in OCM Studio: Tests
Below the line, I'll show you which strategies I'm trusting with our own money, the exact rules I'm running it by, how to size it so a bad stretch never shakes you out, and the three mistakes that ruin good strategies.
Why I Trust It With Our Portfolio
Continue reading with OCM Premium
You have been reading the free preview of this article. The full analysis continues with 7 more sections, charts and takeaways. Read the full article or see OCM Premium plans.