

The invoice for that return was written in 80% drawdowns, and most people handed their position back to the market somewhere in the middle of one.
So the question is not whether Bitcoin compounds. It obviously does. It is whether there is a rules-based way to capture more of that compounding whilst absorbing far less of the pain.
I think there is. Today I want to walk you through one of the strategies we run inside the Strategy Lab, which returned over 80,000% with a maximum drawdown of just 42.9%, and show you where to point your scepticism.
Let’s get into it.
Key insights
A Baseline That Moves: T he z-score renormalises continuously, so a signal in 2015 means the same thing in 2025.
Deliberate Asymmetry: Entries demand a full standard deviation of proof. Exits demand nothing beyond a return to average.
Twenty Times, Not Twice: Doubling the compounding rate produced twenty times the capital, at roughly half the drawdown.
Ten Thousand Histories: Reshuffling the return sequence 10,000 times failed to break either the edge or the outperformance.
A Moving Baseline
Everything starts with the Z-Score Probability Waves, an adaptive mean reversion tool worth understanding before you trade a single signal from it.
A z-score answers one question: how unusual is today, relative to how this asset has actually been behaving?
A reading of +2 tells you price sits 2 standard deviations above its own normal baseline. A reading of -2 tells you it sits 2 standard deviations below. Nothing more exotic than that.
The important word there is “own”, because for Bitcoin that baseline moves a great deal. Bitcoin in 2015 and Bitcoin in 2025 are not the same asset. Volatility has compressed, market cap has grown by orders of magnitude, and the participant base has been replaced almost entirely.
Any model anchored to fixed thresholds, or to an absolute band drawn years ago, quietly decays as the asset matures, and you rarely notice until it has been wrong for eighteen months.
The Probability Waves sidestep that by renormalising continuously. Both the mean and the standard deviation are recalculated from recent data, so the tool measures today against the market’s current character rather than a memory of what Bitcoin used to be.

View live in OCM Studio: Z-Score Probability Waves (Investor)
The Rules
Looking at a signal and trading a signal are two very different things, and that gap is where most people lose money. So here is the strategy itself, which we call the Trading Cross.
Buy when the shorter-timeframe wave crosses above +1
Sell when it crosses back below 0
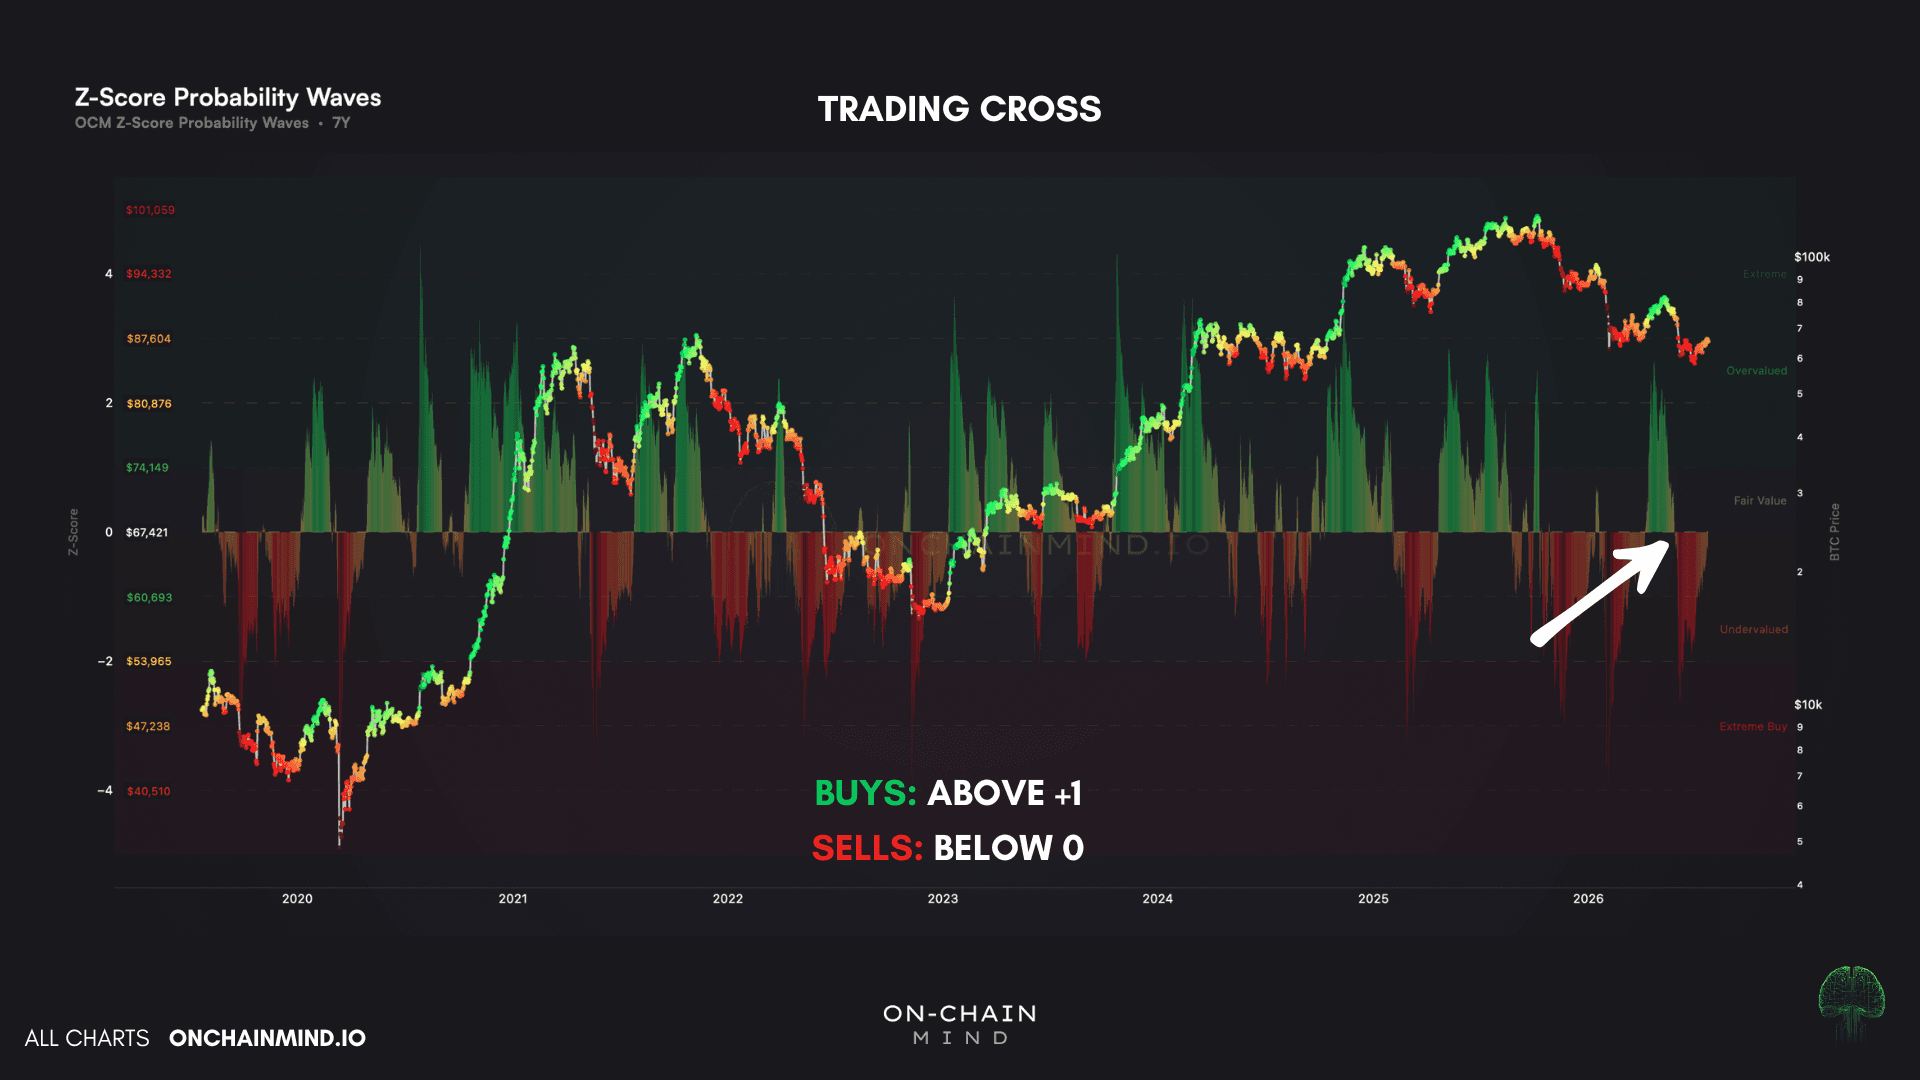
View live in OCM Studio: Z-Score Probability Waves (Trader)
That is the whole ruleset. Notice how deliberately unbalanced it is, because this is the most important design decision in the strategy.
The entry demands proof. You are not buying strength, you are buying strength that has already pushed a full standard deviation above its own baseline, which filters out an enormous amount of noise before you commit a penny.
The exit demands nothing. The moment price slips back to merely average, you are flat. You are not waiting for confirmation of weakness. You are not giving the trade room to breathe. Average is enough to make you leave.
That asymmetry is the mathematical opposite of how most retail traders behave, which is to enter early on hope and exit late on hope.
More Return, Half the Pain
Start all four with the same $10,000 in 2014 and the curves separate brutally:
Dollar cost averaging into Bitcoin grew to around $446,000
Gold reached roughly $32,000 and the S&P 500 about $40,000
The Trading Cross finished above $8 million
That is an 80,000% return at a 72% compound annual growth rate, against DCA’s 4,000% at 36%, roughly doubling the annualised rate of compounding.
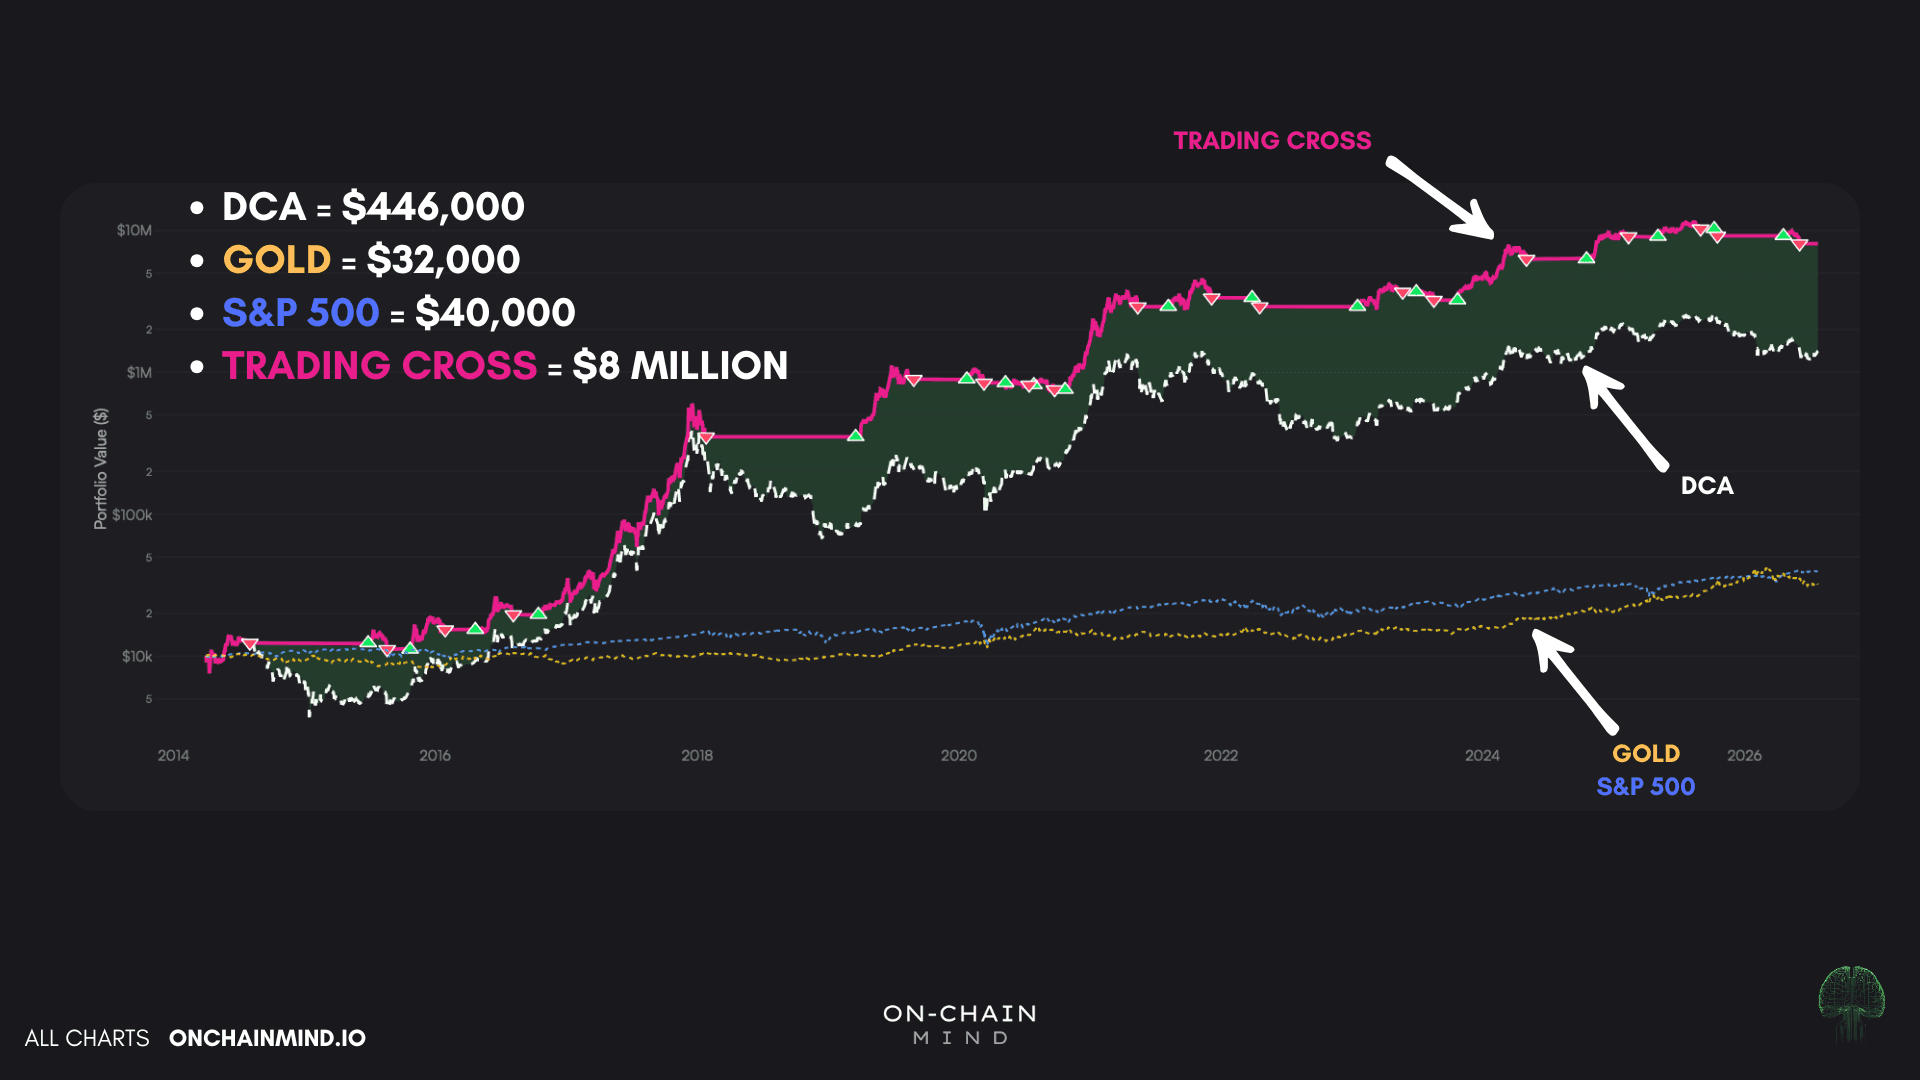
View live in OCM Studio: Strategy Lab - Equity Curve
It’s certainly interesting what doubling a compounding rate does over a decade, because this is the part people under-appreciate. It did not make twice as much money. It made roughly twenty times as much, because the advantage was reapplied to a growing base year after year.
The drawdown side decides whether any of this is investable in real life. The Trading Cross drew down 42.9% at its worst. DCA drew down 83%.
I want cover briefly what an 83% drawdown feels like, because it is very easy to glance at one in hindsight. For every $100,000 you had, you are looking at $17,000, and you need a 490% return simply to get back to where you started.
That is the moment almost everybody sells, and it is why so few people ever captured that brilliant 4,000% DCA return.
The Calmar Ratio captures the trade-off, dividing compound annual growth by maximum drawdown. DCA scores 0.44, so every 1% of peak-to-trough pain bought you 0.44% of annual growth.
The Trading Cross scores 1.68, so the same 1% bought 1.68%. Nearly four times the compensation for identical suffering.
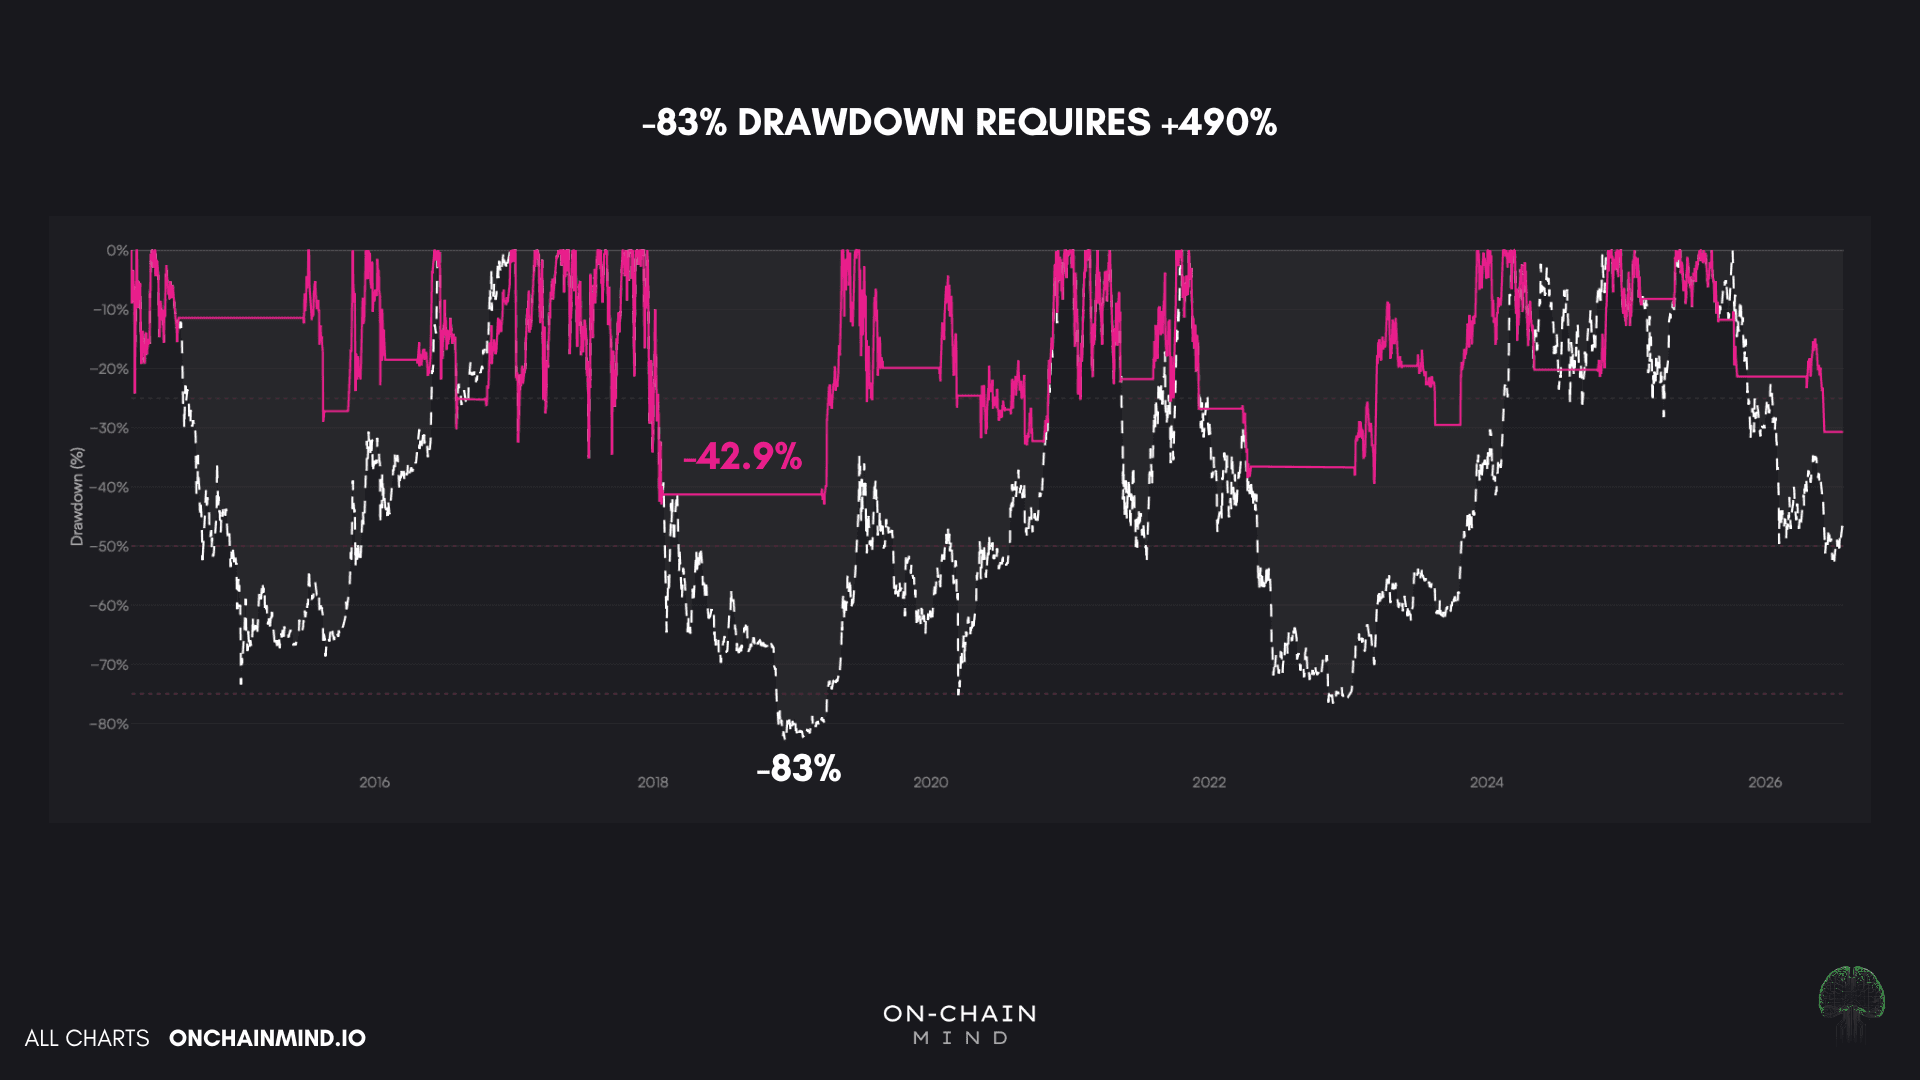
View live in OCM Studio: Strategy Lab - Drawdown
Ten Thousand Versions of History
A single backtest is still one sequence of events, one path through history, and history only happened once. So we ran a Monte Carlo analysis with 10,000 simulations.
The method is simple. Take the strategy’s actual daily returns and reshuffle their order thousands of times, building thousands of alternative histories. The returns stay identical, only the sequence changes.
The question is whether performance depended on getting lucky with the order, or whether the edge is structural.
The answer was clear. Only a tiny fraction of simulations underperformed Bitcoin DCA, and usually by a few thousand dollars. The 5th percentile outcome still finished around $463,000. Run this 100 times under equally realistic conditions and roughly 5 runs land below that, and even those still beat dollar cost averaging.
Here is why the test carries weight. If a headline number exists only because three enormous winners happened to land in a particular order, resequencing exposes it instantly and the median collapses far beneath the backtest.
Instead, this one here sits very close to the median, which tells you the edge comes from the distribution of returns rather than a fortunate arrangement of them.
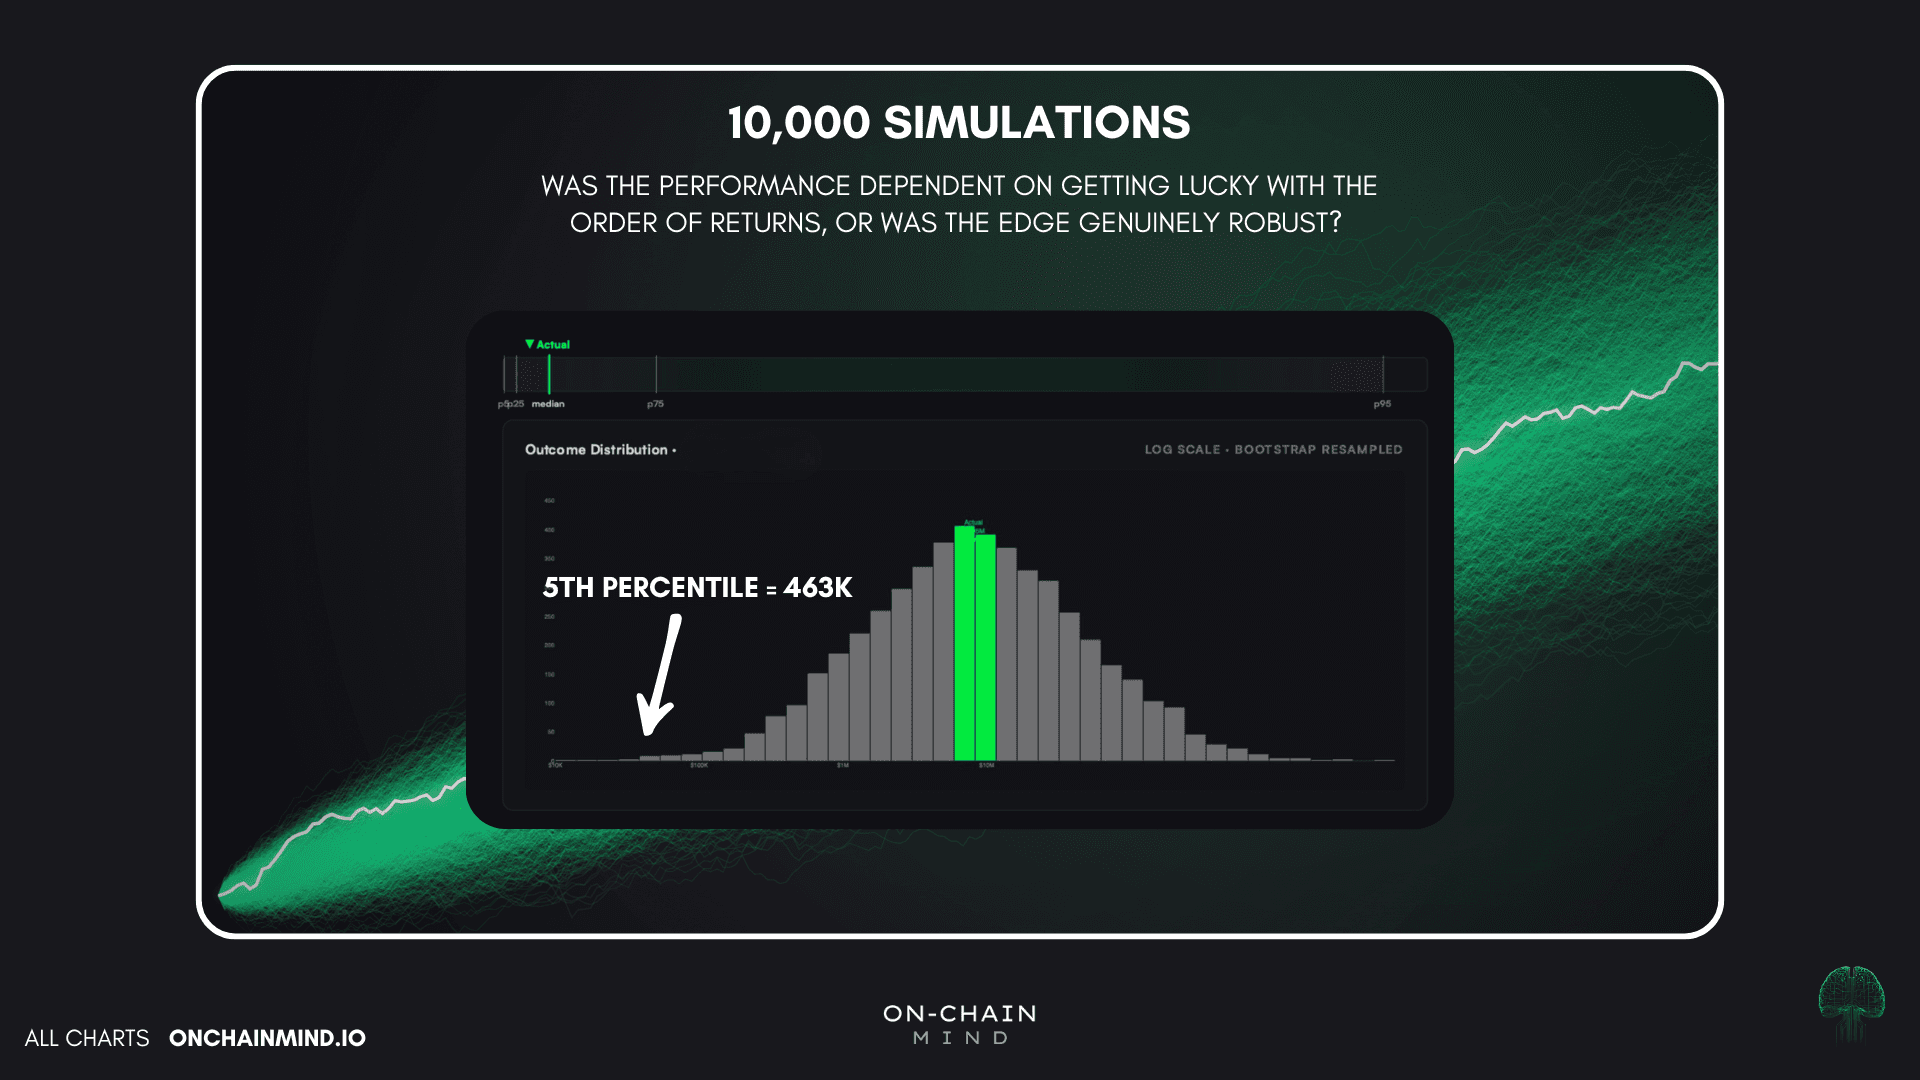
View live in OCM Studio: Strategy Lab - Monte Carlo
Why I Would Rather You Tried to Break It
The part I actually care about here is not the 80,000%.
I have little interest in you believing that number. I would far rather you attacked it, which is the whole reason the Strategy Lab exists in the form it does.
Every rule visible, every parameter adjustable, every result reproducible on your own screen. The goal was never to maximise returns, it was to try to break the strategy and see what was left standing. A backtest you cannot interrogate is marketing, not research.
My honest view on dollar cost averaging is that it is not wrong, I run one almost continuously too. It just is emotionally expensive.
Almost every strategy failure I have watched has been behavioural rather than mathematical, which is why I think the 42.9% matters more than the 80,000%. A slightly worse strategy you can hold through the dark parts will beat a better one you abandon at the bottom, every single time.
I would not treat this as a replacement for accumulation either. Rules and accumulation solve different problems: one manages exposure, the other manages behaviour.
There are costs to weigh honestly. Whipsaws in chop, execution slippage, tax on realised gains, and long stretches sat in cash whilst price runs without you. Those will test you in a completely different way to a drawdown.
But that is rather the point. Every strategy charges you something. The only question is whether you would rather pay in time or in pain, and whether what you must endure is something you can endure for a decade or more.