
If you’ve been in Bitcoin for the last 5 years, your portfolio has compounded at roughly the same rate as a boring index fund: 7% CAGR.
The statement is mathematically true, but it’s also one of the most misleading statements in finance.
So today, I want to walk you through exactly how this compounding metric gets weaponised, and why the next few months might be the most consequential window of the cycle.
Let’s get into it.
Key insights
The CAGR Mirage: Standard compound growth metrics depend entirely on cherry-picked start and end points, distorting Bitcoin’s real underlying growth rate.
A Measure of Network Growth: Bitcoin’s 200-week moving average compounds at roughly 30% annually, giving us the cleanest read on genuine network growth.
The Asymmetry of Patience: Buying near the 200-week historically delivers forward CAGRs of 40%-70%, transforming portfolio outcomes by orders of magnitude.
The Psychological Toll: This strategy works precisely because it feels brutal in real time, which is why almost nobody actually executes it properly.
The CAGR Problem
Let’s start at the beginning. Compounding is the engine behind every great fortune ever built. But understanding compounding properly requires understanding how to measure it properly, and this is precisely where almost everyone in the Bitcoin space gets tripped up.
When we talk about compounding in markets, the metric everyone reaches for is CAGR, the Compound Annual Growth Rate. It tells you the smoothed annual rate at which something has grown over a period.
Simple in concept. Treacherous in application.
CAGR depends on two things and two things only: the start point and the end point. Everything in between is invisible to the calculation. Which means we can effortlessly cherry-pick the data to fit any narrative we wish to push.
Right now, Bitcoin’s 5-year CAGR sits at roughly 7%. Correct, and also pretty underwhelming. Basically S&P 500 territory but with Bitcoin’s notorious volatility tacked on.
But run the same exercise in reverse. Bitcoin’s 3-year CAGR comes out at a fairly impressive 38% per year. Suddenly Bitcoin is a compounding machine again. Except not really. We’ve just conveniently selected the beginning of the last bull market as our start point.
This is the entire game.
Bears pick the top of a cycle and tell you Bitcoin is dead. Bulls pick the bottom and tell you it’s heading to a million dollars next year. Both are technically right depending on which two dots you draw a line between. Both are also functionally useless for understanding the asset.
So how do we strip out the cherry-picking and get to the true underlying growth rate? Because despite what I’ve just said, CAGR is genuinely useful. Most people are just using it in a fundamentally broken way.

View live in OCM Studio: CAGR Perspectives
The Shape of Patience
The 200-week moving average is often described as the average cost basis of investors. It isn’t. It’s a smoothed line of price over time, where each week is given equal weight, and that isn’t how most people actually invest.
The 200-week is a time-weighted proxy for long-term DCA participants, not a true cost basis. That distinction matters because it changes how you interpret what the line is telling you.
Here’s the line I want you to really sit with: if DCA is how investors behave, the 200-week is what that behaviour resembles at scale. It’s the closest visual proxy we have for what disciplined, patient capital deployment looks like, smoothed across an entire cycle. It’s the shape of patience, drawn on a chart.
And because it strips out short-term volatility, the 200-week tracks the actual structural growth trend of Bitcoin. Its CAGR fairly accurately approximates the underlying network growth rate, free from the cherry-picking problem entirely.
Now let’s put real numbers on this. If you’d dollar-cost averaged into Bitcoin every week since 2010, you’d have a CAGR of over 33%. Exceptional by any standard. It would have turned $100 a month into over $640,000.
But Bitcoin’s 200-week has been growing at 70% per year over the past 10 years, and that doesn’t even include the early years which compounded at hundreds of percent annually. The difference between 33% and 70% isn’t a step change. It’s phenomenal.
A 70% CAGR would have produced a final portfolio value of $91 million from that exact same allocation. Just by being smarter about when you deploy capital.
I know what you’re thinking, because everyone thinks it. That can’t possibly be right. Doubling the CAGR can’t realistically produce a difference of that magnitude. But it does.
The reason your brain refuses to accept it is because we are simply not wired to think exponentially. We evolved to think in straight lines. The gap between what feels reasonable and what’s actually mathematically true is the entire opportunity we’re discussing today.
Asymmetric Bets
Random starting points over the past 10 years for DCA typically land somewhere between 15% and 35% CAGR depending on the phase of the cycle you’re in. Respectable. But the real asymmetry is found in being intentional about deployment.
If you’d actually invested at the 200-week, meaning you waited for those moments where price returned to or near that line, the forward CAGRs become genuinely absurd:
April 2015: 73%
December 2018: 44%
March 2020: 45%
November 2022: 58%
These are the moments where price is screaming that the asset is undervalued relative to its structural trend. Historically, every single time, that has been the right call.
So what is Bitcoin’s current “network CAGR”? The 200-week itself has been compounding at 30% per year over the past 1, 2, 3, and 4 years. That’s a pretty accurate read on the real underlying growth rate.
Today, Bitcoin’s 200-week is sitting around $60,000, and with it steadily compounding at 30% annually, it looks likely to end the year near $71,000. That’s the line worth watching very carefully indeed.
I have to be honest with you, because if I’m not, this all starts to sound like a free lunch, and there are no free lunches in markets.
Buying the 200-week looks magnificent in hindsight. In real time, it is utterly brutal. Price doesn’t respect that line as a hard floor. It chops around it for many gruelling months, sometimes spending extended periods below it before recovery plays out.
That’s the toll the market extracts in exchange for those 50%+ forward CAGRs. The strategy works precisely because it doesn’t feel easy. If it felt easy, everyone would do it. And we know from the on-chain data that the vast majority of holders simply don’t.
One important caveat. You cannot just apply this to anything and hope for the best. It has to be a winning asset. Apply this to a dying one and you’re catching a falling knife on a longer timeframe.
The 200-week works on indexes and on Bitcoin because they represent something broader than any single entity. Bitcoin’s growth is adoption-driven. The S&P 500’s is earnings-driven. Both are ultimately powered by the debasement of the dollar and the expansion of global liquidity, which shows absolutely no signs of slowing.
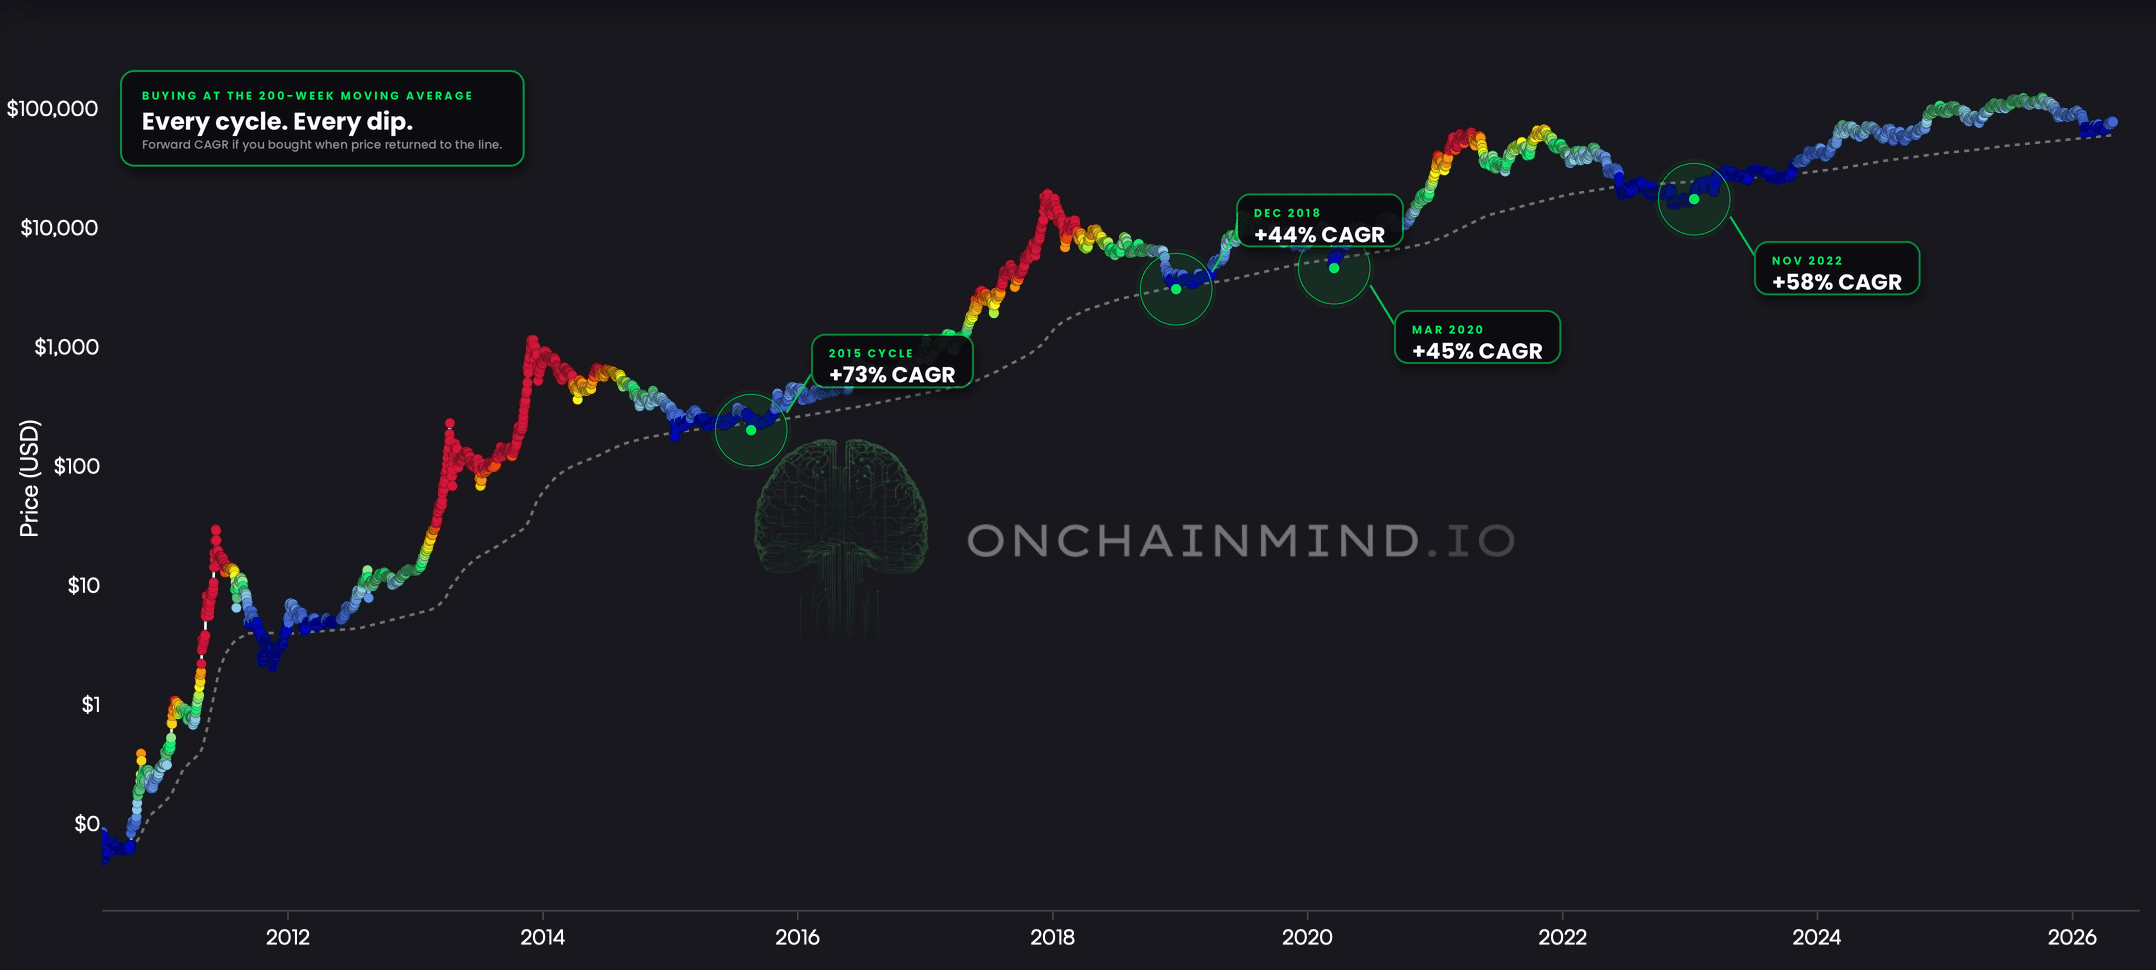
View live in OCM Studio: CAGRs Buying At The 200-Week
The Execution Is Everything
The hardest thing about investing isn’t finding the strategy. The hardest thing is sitting on your hands when everyone else is panicking, and being aggressive when every fibre of your being is screaming at you to wait for a better price that never comes.
DCA shouldn’t be abandoned. It’s your baseline, your default, the thing that keeps you participating regardless of what your emotions are doing.
The upgrade is to scale your aggression based on where price sits relative to the 200-week. Above the line, reduce DCA size or pause lump sums. At or near the line, ramp up significantly. The exact ruleset matters less than the principle: be more aggressive when the asset is cheap relative to its trend, less aggressive when it’s expensive.
I’m telling you for a fact, as simple as it sounds, from looking at the on-chain data daily, that the holder base is overwhelmingly not doing this.
So here’s what I’m watching. Bitcoin’s 200-week is sitting around $60,000 and projected to reach $71,000 by year-end. If Bitcoin retests or remains anywhere below that $70,000 range over the coming months, history is screaming that this is the moment. Not the comfortable one. The one that compounds at serious rates going forward, while everyone else is busy being scared.
The magic of compounding comes down to two things only:
Your entry point
Your time in the market
You are in control of both. You cannot control what the global economy does, but you have absolute control over when you choose to be aggressive and how long you are willing to wait.
The best strategies aren’t complicated. They’re just hard. And that’s why I see hardly anybody executing this correctly on-chain.
And that is, paradoxically, exactly why it works.