

Bitcoin per Share is the number every treasury bull has been tracking for a while, and until recently, it was the right number to quote.
At the end of 2020, Strategy held about 70,000 coins, owed almost nobody anything, and every coin in the warehouse belonged to the common shareholders
Today there is roughly $19 billion of debt and preferred stock standing in the queue ahead of you, and Bitcoin per Share still counts every one of those coins as though it were yours.
I have been picking through a site called CEBE Tracker for a few weeks now, and I think it finishes a piece of maths the rest of us have been leaving half done. I still like Sats per Share. But this is a sharper way of seeing what you actually own, and I have now built it into the DATs dashboard with 2 new metrics of my own.
Let’s get into it.
Key insights
The Warehouse Problem: Bitcoin per Share counts every coin a company holds, including the ones already promised elsewhere.
The Price Of Ruin: There is an exact coin price where common equity mathematically hits zero, and it ratchets higher.
The Discount That Isn’t: MSTR’s headline discount to net asset value very nearly vanishes once senior claims are netted out.
Percentiles Over Multiples: A raw mNAV figure tells you almost nothing until it is ranked against a company’s own history.
The Metric That Finishes The Maths
CEBE stands for Common Equity Bitcoin Exposure, a framework published in January 2026 by Bobby Tierney. The question it asks is refreshingly blunt: if this company sold every coin it holds today, how many sats would each share actually receive?
The maths is not complicated. Take total holdings, subtract senior claims expressed in coin terms, and divide by fully diluted shares.
CEBE = (Total BTC − Net Senior Claims ÷ Spot) ÷ Shares
Net senior claims is debt plus preferred stock minus cash, because cash can service obligations and therefore reduces what compresses your ownership.
What lifts this above an accounting exercise is that the drag is dynamic. Senior claims are denominated in dollars while the treasury is denominated in coin, so every move in spot silently re-cuts the pie.
When Bitcoin rallies, those fixed dollar claims shrink in coin terms and common equity absorbs a growing share of the stack. That is the embedded leverage everyone celebrates. When Bitcoin falls, the same claims swell in coin terms and quietly eat into the part that belongs to you. Nobody celebrates that half.
CEBE Per Share, And The Price Of Ruin
So, of course, I built some metrics to test this idea.
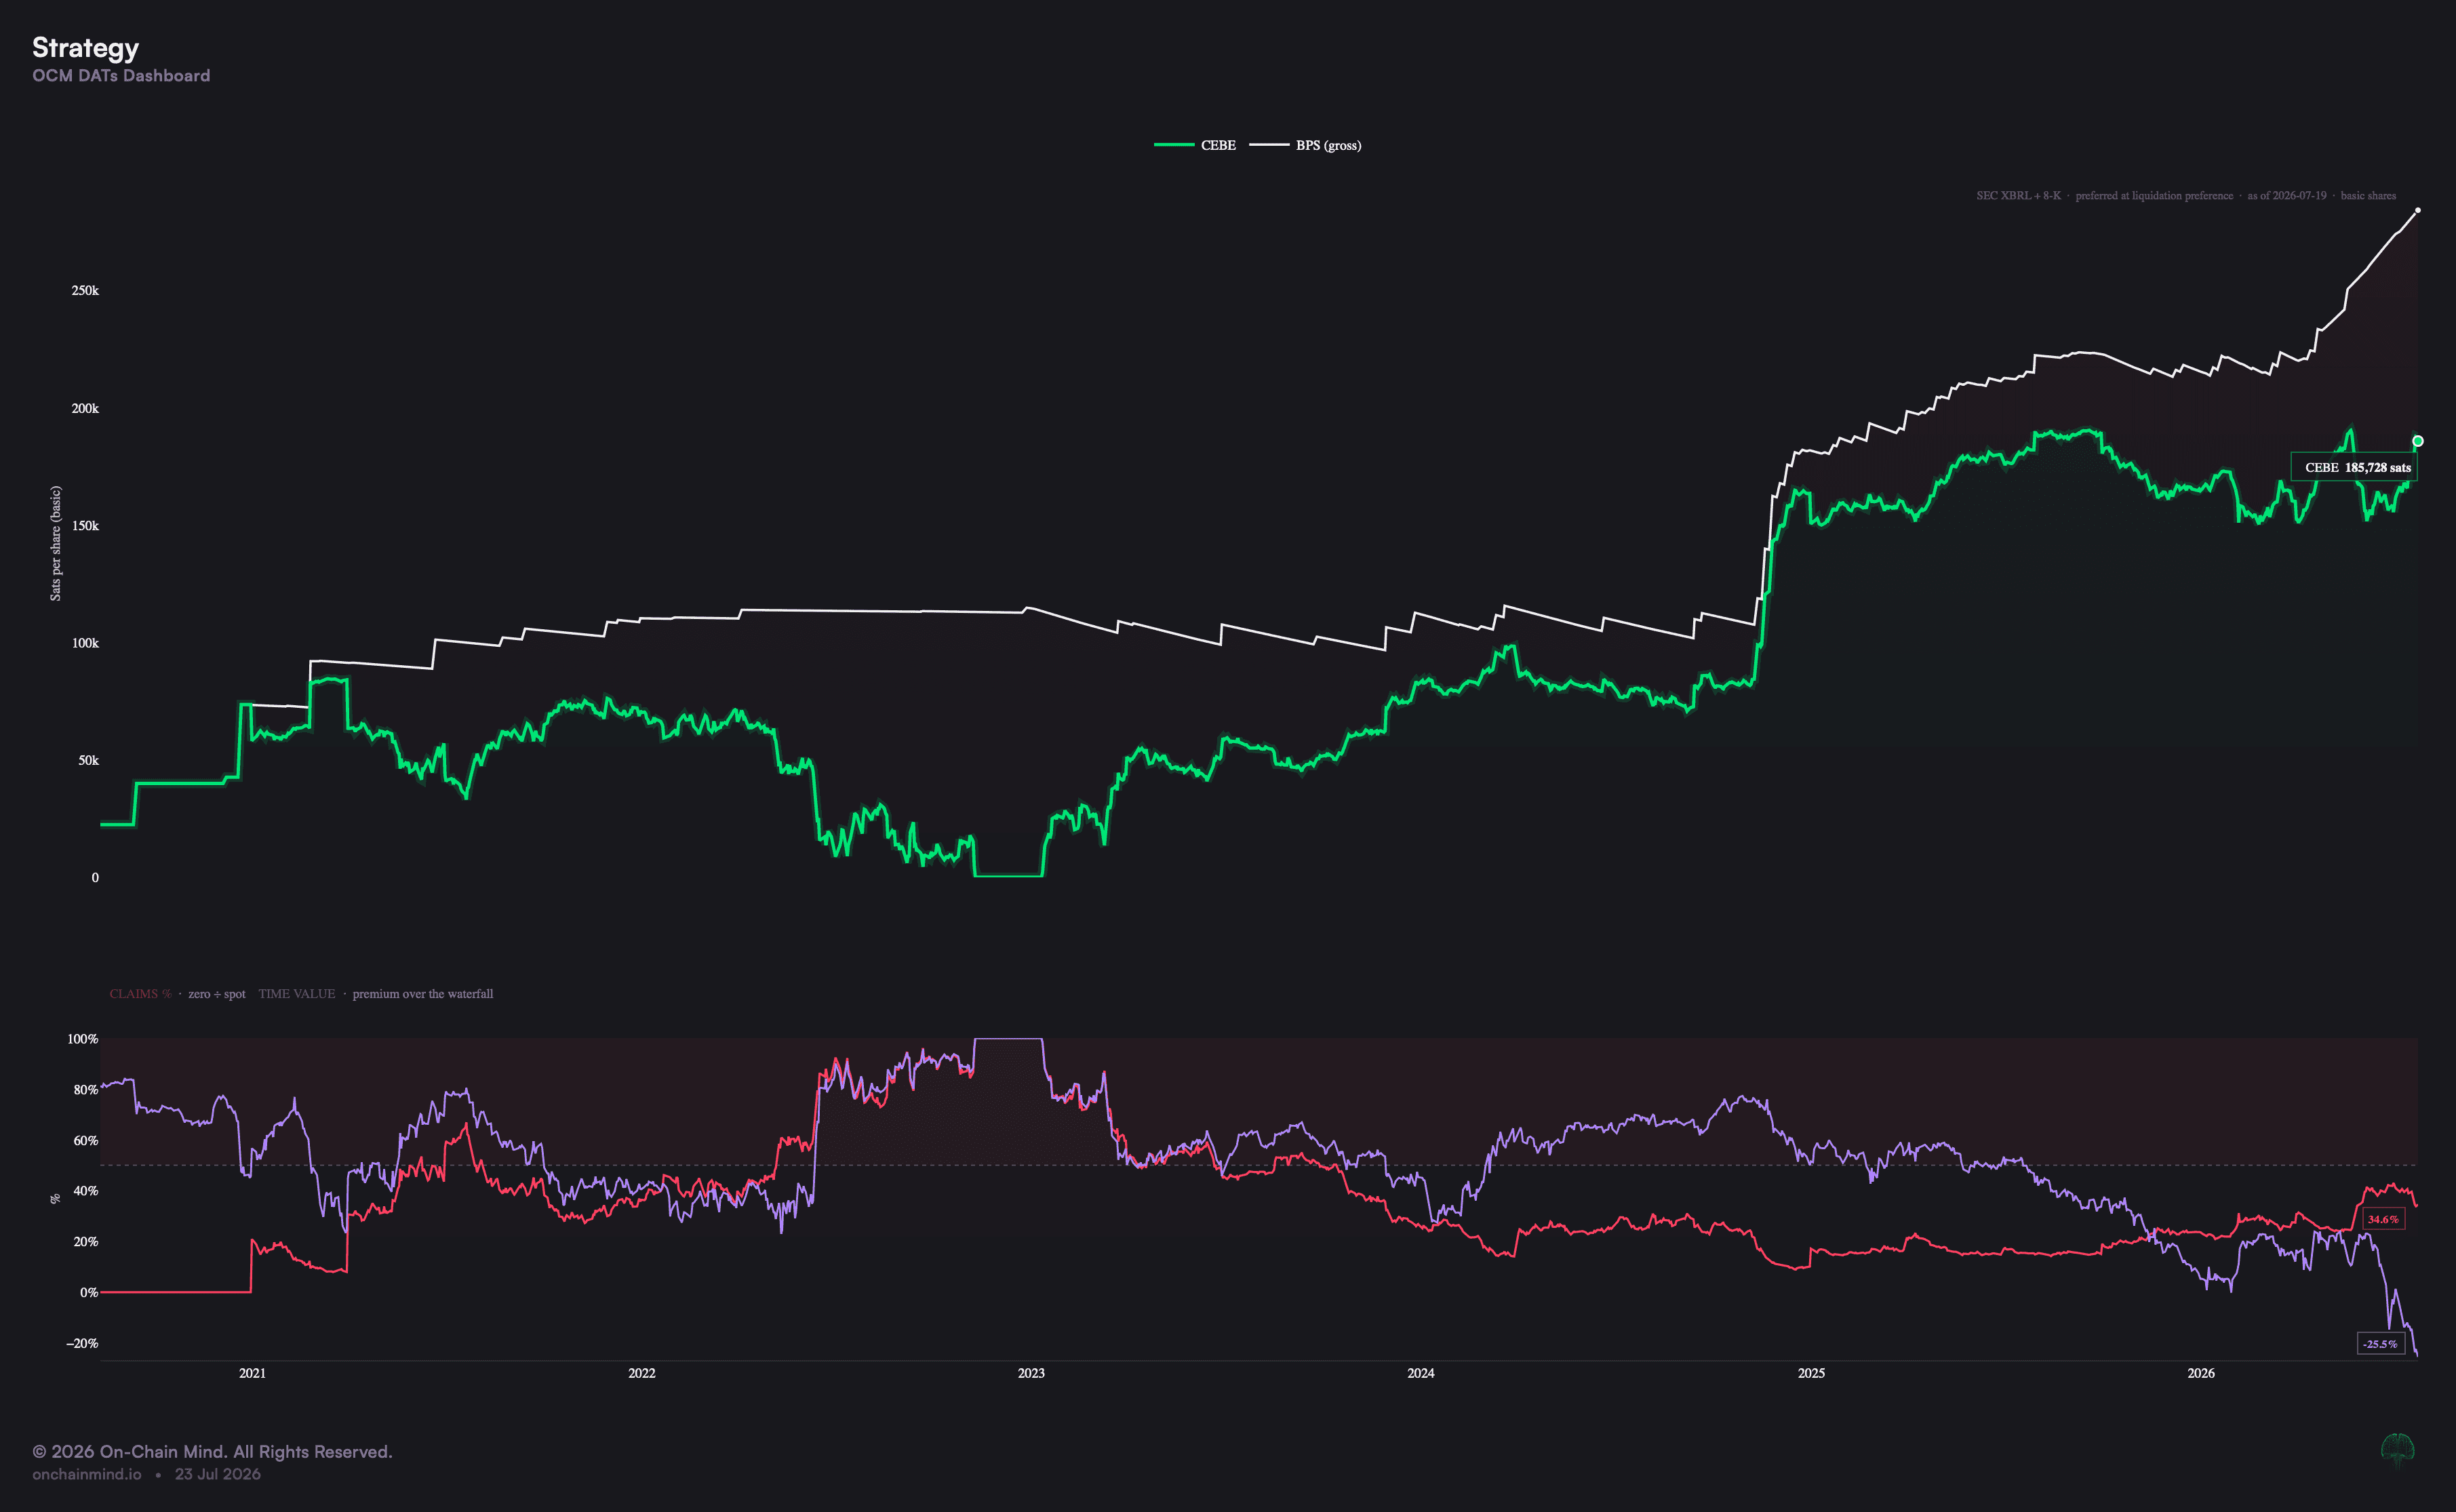
The DATs dashboard (https://onchainmind.io/indicators/digital-asset-treasuries-dats) now carries a CEBE / Share view where the white line is gross Bitcoin per fully diluted share and the green line beneath it is what common equity genuinely owns.
The red wedge between the 2 is the part the claims stack consumes at spot, and watching that wedge breathe with the coin price teaches you more in 30 seconds than any spreadsheet will.
View live in OCM Studio: CEBE / Share
Continue reading with OCM Premium
You have been reading the free preview of this article. The full analysis continues with 9 more sections, charts and takeaways. Read the full article or see OCM Premium plans.