
Why the markets quietest moments are often its most prosperous
Bitcoin is doing something unusual: volatility has collapsed, price is caught below every major structural level, and yet the data quietly signals an early bullish expansion.
This is one of those setups that doesn’t linger in the shadows for long. Markets rarely remain subdued when the forces underneath are building. And whether it resolves to the upside or downside, it’s likely to catch most participants off guard.
In this article, we’ll unpack the on-chain and probabilistic signals today to weigh up 2 plausible paths forward: a textbook bear market completion or a bold break from the traditional 4-year cycle narrative.
Let’s get into it.
The Loaded Spring: Bitcoin’s historically low volatility is unsustainable and has always preceded significant moves ahead.
Directional Bias Matters: Beneath the flat price action, upside volatility is quietly dominating downside, signalling early accumulation of bullish pressure.
Critical Structural Levels: The $100k region converges multiple critical metrics, acting as the ultimate line in the sand.
Asymmetric Outcomes: The next few months could either complete the classic bear market playbook or disrupt the 4-year cycle entirely.
Mechanics of the Spring
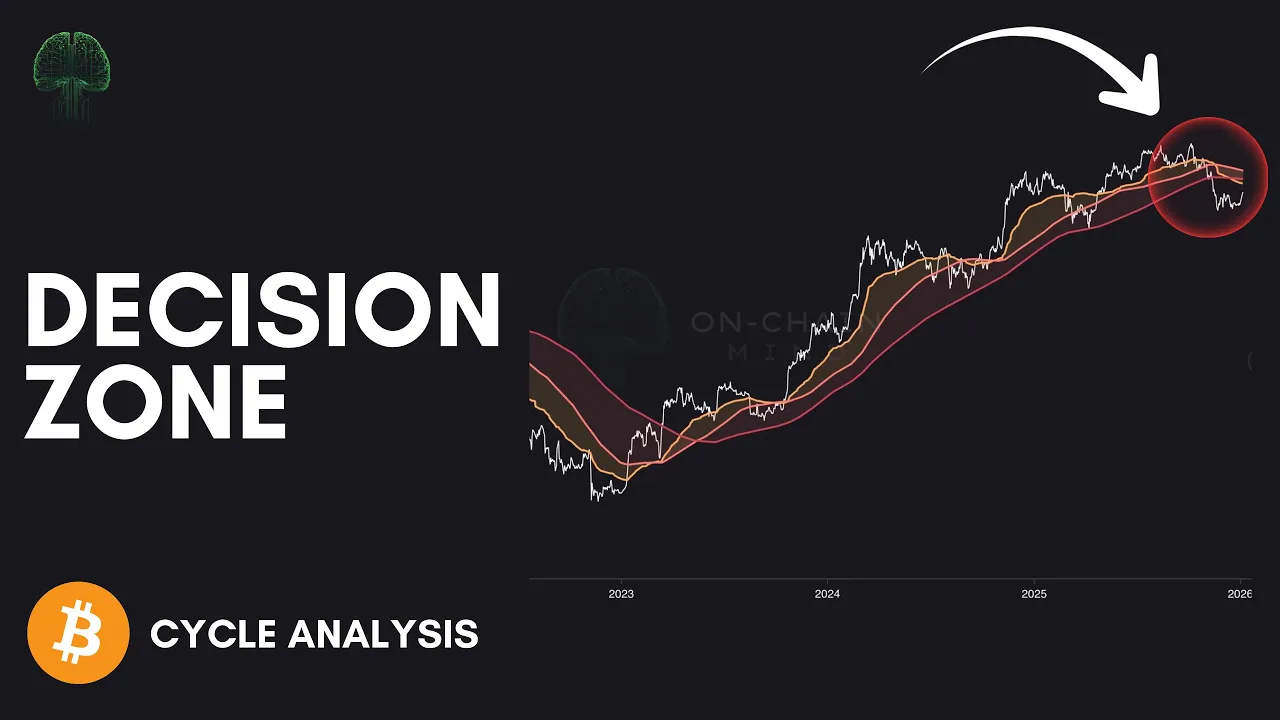
After the descent in late 2025, Bitcoin has settled into a clear consolidation range. Price has gone quiet again, volatility has compressed, and traders are growing bored.
But to understand where we are going, we must first quantify the "quiet".
For this, I use a tool called the Volatility Waves, which measures Bitcoin’s 7-day logarithmic returns. Unlike raw dollar changes, which are deceptive, logarithmic returns standardise the intensity of price fluctuations. A $1,000 swing at $20,000 carries far more market weight than the same swing at $100,000.
Currently, the Volatility Waves reading is at 43. Historically, when this metric dips into ranges this low, it doesn’t linger for long. Compressed volatility acts like a spring being loaded, where the energy eventually releases violently, either upwards or downwards.

Bitcoin Volatility Waves
The Hidden Bias
So, we expect that a major move is likely round the corner. But knowing that a move is coming is only half the battle. We need to also identify its Volatility Directional Bias (VDB).
The VDB measures the balance between upside and downside volatility.
It provides directional context: whether bullish pressure is quietly building or bearish pressure is dominating, even when price is flat.
Right now, the VDB is signalling the early stages of a bullish expansion. And it doesn’t appear to be chopping or indecisive either. It is trending with intent. While this isn’t a guarantee, it does mean that, probabilistically, the next time the spring uncoils, it is currently weighted to strike upwards.
And when the directional bias flips and holds, like it is now, it usually remains consistent for a month or two before any significant mean reversion occurs.
But volatility alone doesn’t tell the full story. For that, we need to understand where Bitcoin sits relative to its most critical structural levels.

Volatility Directional Bias (VDB)
The $100k Line in the Sand
While volatility gives us the "when", market structure gives us the "where".
There are 3 key pricing levels that I like to focus on, and they are all converging on the same psychological territory: the $100,000 mark.
Short-Term Holder Realised Price ($99,000): This represents the average cost basis of investors who bought within the last 5-6 months. These are the weak hands or (more politely) the most price-sensitive participants. When the price is below this level, these holders are underwater and prone to panic-selling.
365-Day Moving Average ($101,000): A smoothed yearly average that acts as the ultimate divider between bullish and bearish sentiment.
200-Day Moving Average ($106,000): The most widely watched trend filter in global finance.
To me, the convergence of these three levels around the $100k level is significant. It’s not just technical; it’s psychological. Markets gravitate toward round numbers. It’s where liquidity clusters and where traders’ attention concentrates.
My framework here is simple: as long as Bitcoin trades below all 3, we remain in a bearish regime.
We saw a mirror of this in December 2021. Back then, Bitcoin rallied back to its key averages, failed to reclaim them as support, and subsequently rolled over into a year-long winter.
We are at that exact precipice again. A rally to $100k is likely, but whether that level acts as a brick wall or a floor for 2026 will decide the fate of the market.

Bitcoin Key Pricing Levels
Quantifying The Risk
To move beyond speculation, we turn to statistically grounded indicators. My go-to is the Z-score Probability Waves, which measures how extreme the current price is relative to its historical mean.
It maps price onto standard deviation bands (σ levels) against a smoothed trend.
Current readings show Bitcoin between neutral and -1σ. Not overheated, nor oversold.
Directional bias is returning to neutral, aligning closely with the $100k structural battleground.
The downside risk, if history rhymes, is substantial. By looking at the Z-score framework, we can identify a "statistical washout" level. If this is a true bear market continuation, the maximum downside risk with the point of maximum pessimism sits around the $75,000 mark, potentially wicking down into the $65,000–$70,000 range with further consolidation. This would represent a full reset and a classic bear market floor.
So what are the 2 scenarios I could see playing out? Let’s have a look:
Scenario 1: Bearish Continuation
Rally towards $100k driven by volatility expansion.
Price fails to reclaim key pricing levels as support.
Rejection leads to a drop to the $70k region, completing a textbook bear market pattern.
Scenario 2: Bullish Expansion
Rally to $100k, consolidation occurs, and key levels are reclaimed as support.
Market transitions into a broader uptrend, influenced by macro liquidity and institutional flows.
Classic 4-year cycle narrative completely dismantled as we structurally shift back into a bullish regime.
Both scenarios are easily tradable, but they require discipline and data-driven frameworks rather than emotional speculation. Easy to say. Slightly harder to execute.

Z-Score Probability Waves
How I’m Positioning for Asymmetry
I’ll be honest with you: I am genuinely comfortable with either of these outcomes. Here’s why.
Many of you might be terrified of Scenario 1 (the rejection and roll-over to $70k), but I see it as a gift. If that happens, we have a predictable, tradable bear market structure. We use the rallies to trade and manage risk and we go all-in once we hit that statistical Z-score floor. It’s a textbook play that has worked for over a decade now.
However, I am increasingly leaning into Scenario 2. If we reclaim $100k and turn those averages into support, the 4-year cycle narrative that some are emotionally anchored to is officially nailed dead. This would signal that Bitcoin has matured beyond self-fulfilling prophecies and has evolved into a macro-liquidity sponge, driven by institutional flows and global debasement rather than being fixated over revolutions around the sun.
Personally, I was actively accumulating in the $80,000 region because I refuse to be caught underexposed if Scenario 2 unfolds and the classic bear market playbook fails.
If we continue to see positive macro tailwinds into 2026, new all-time highs aren't just a possibility; they are the probable outcome. I’m not interested in guessing; I’m interested in being positioned so that no matter which way the volatility resolves, I am ready to capitalise on it.
So to me, the overarching lesson is clear: Bitcoin’s behaviour right now is a lesson in probabilistic thinking.
I’m not emotionally anchored to either outcome — I’m anchored to the data. And the data has given us the map. Now it’s just a matter of having the conviction to follow it.
I’ll catch you in the next one.
Cheers,
