
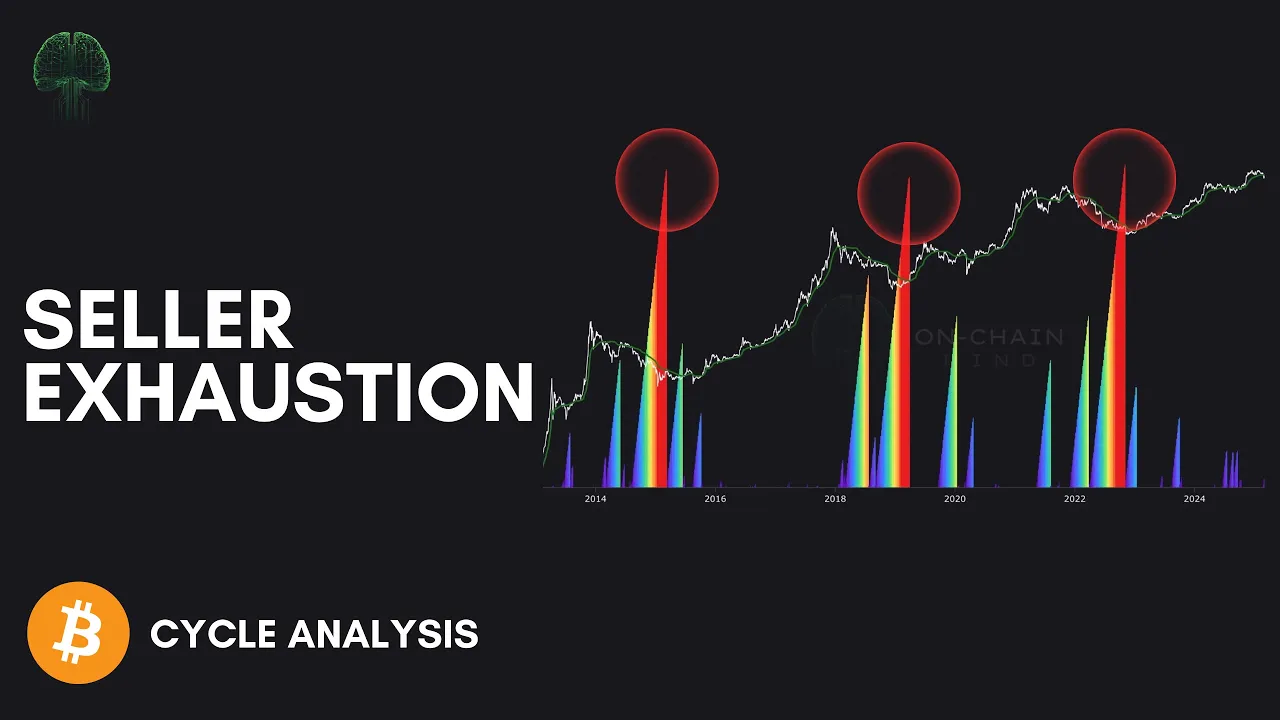
The hidden time limit behind Bitcoin market bottoms
There’s a point in every Bitcoin downturn where selling simply stops working. Not because the news improves. Not because sentiment flips overnight. But because the people most likely to sell have already done so. What follows is exhaustion. And once you know how to measure it, market behaviour becomes far more predictable than most realise.
This article breaks down one of the cleanest, most psychologically grounded ways to identify Bitcoin market exhaustion using time, not price. We’ll explore why short-term holders matter so much, how long pain typically lasts, and what history suggests about where we are right now.
Let’s get into it.
Market Exhaustion Is Time-Based: Bitcoin bottoms form when sellers run out of patience, not when headlines turn positive.
Short-Term Holders Drive Capitulation: Newer market participants are the most reactive and define periods of peak selling pressure.
The 100-200 Day Pain Window Repeats: Across cycles, Bitcoin consistently bottoms after similar durations below short-term holder cost basis.
We’re Closer to the End Than It Feels: Current data suggests the market is already deep into the exhaustion phase.
Market Structure vs. Market Psychology
Right now, Bitcoin is failing to reclaim 3 major structural levels:
The 365-day moving average
The 200-day moving average
The short-term holder realised price
That combination alone tells you something important: confidence still hasn’t returned. Attempts to rally are being sold, not chased. Supply is still meeting demand.
But structure only tells part of the story. Price levels show where the market is struggling. They don’t tell you how long that struggle is likely to last.
That’s where psychology comes in.
Markets don’t turn because valuation models say they should. They turn when participants are emotionally, financially, and psychologically exhausted. And in Bitcoin, no group reflects that exhaustion more clearly than short-term holders.
Short-term holders are defined as coins that have moved within the last 155 days. In plain English, these are newer entrants: late-cycle buyers, breakout traders, momentum participants, and speculators. They’re the most sensitive to drawdowns, the least anchored to long-term conviction, and the quickest to exit when pain persists.
Their realised price represents the average cost basis of that entire cohort. When Bitcoin trades above it, short-term holders are in profit. Confidence builds. Risk appetite returns. When Bitcoin trades below it, the opposite happens: stress, impatience, and eventually capitulation.
This is why the short-term holder realised price has become one of the cleanest regime-defining levels in Bitcoin. Above it, the market behaves like a bull market. Below it, behaviour shifts decisively bearish.
But what’s even more interesting isn’t just being below that level. It’s how long we stay there.

Bitcoin Key Pricing Levels
Measuring Capitulation with Time
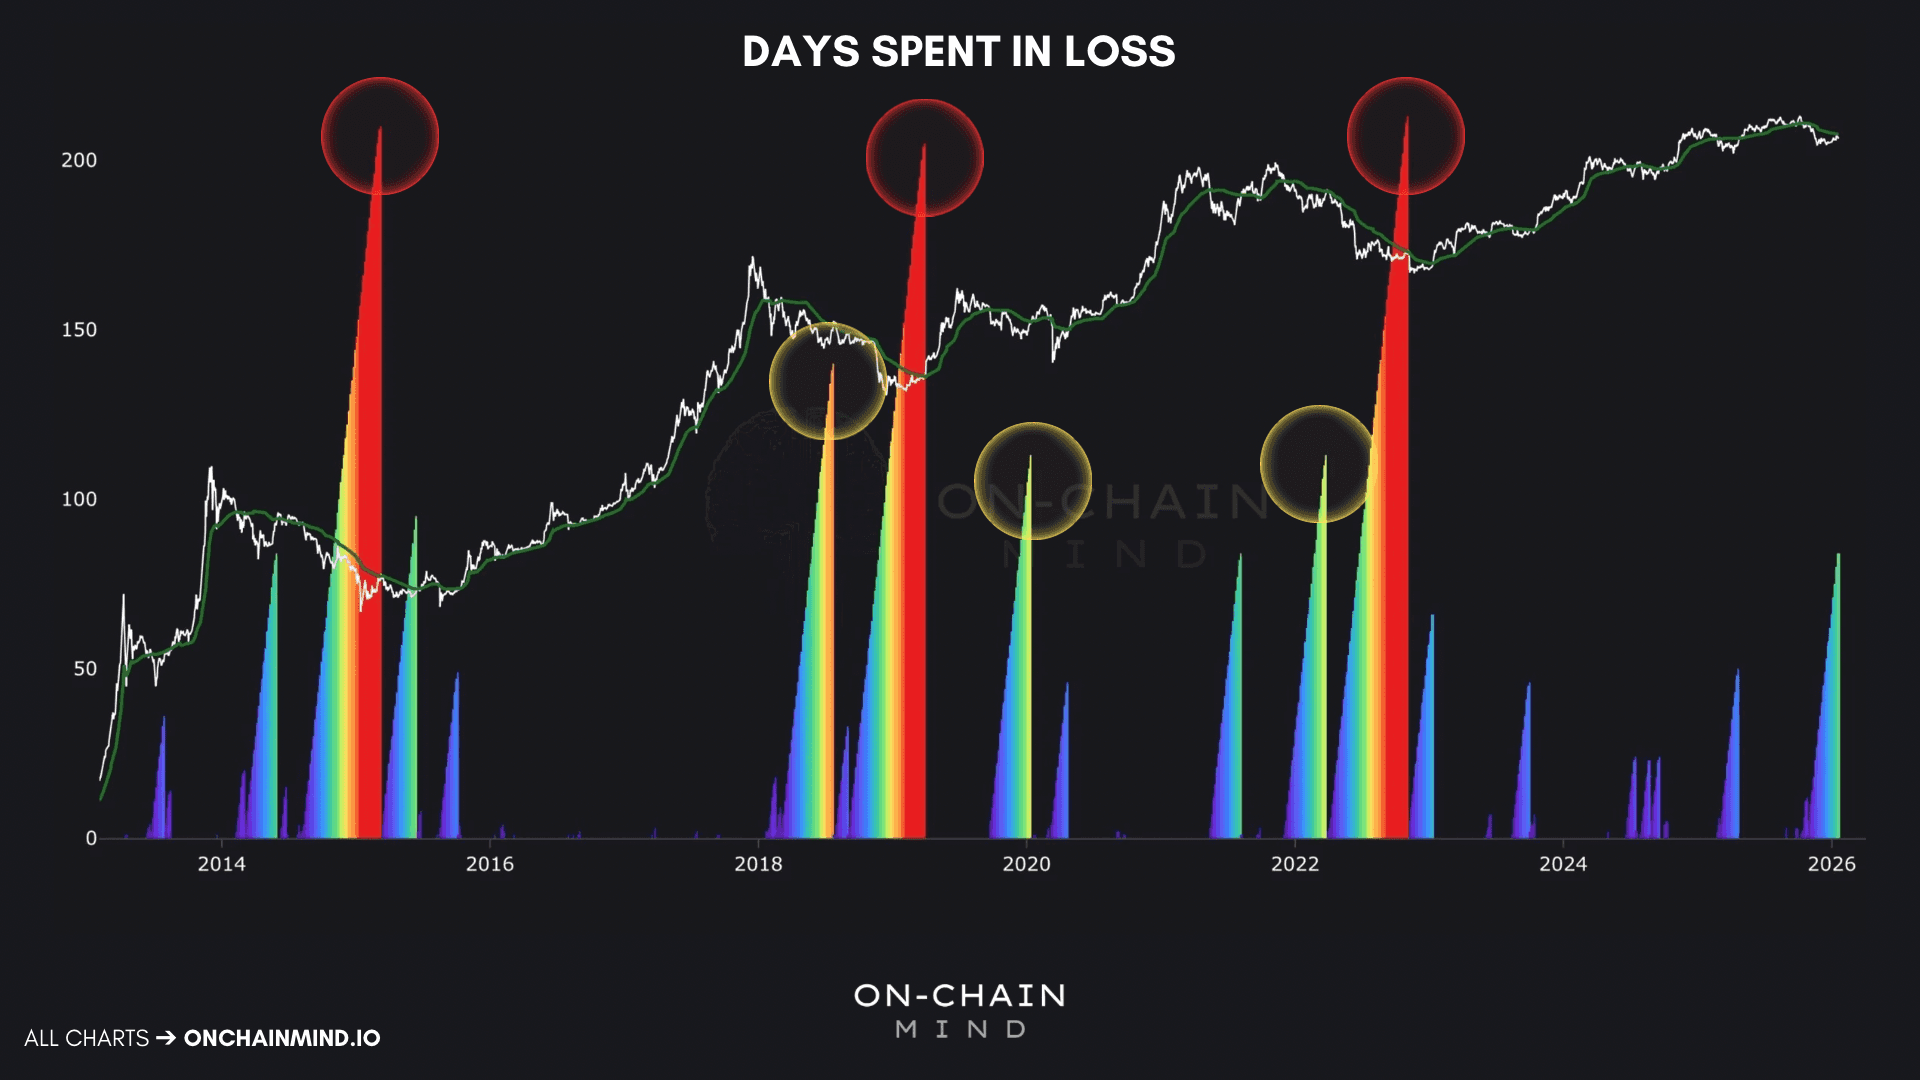
The Days Spent in Loss indicator tracks the number of consecutive days Bitcoin’s market price remains below the short-term holder realised price. It’s deceptively simple, and that’s precisely why it works.
Rather than measuring complex on-chain flows, it simply measures patience. It asks a single question:
How long are newer participants willing to stay underwater before they give up?
The answer, historically, is remarkably consistent.
Visually, this indicator uses colour intensity to represent duration. Early days below the cost basis show up as cooler colours (blues and purples), signalling mild distress. These often appear during shallow pullbacks or temporary uncertainty.
As time passes and price fails to recover, colours transition into yellows and reds. This marks prolonged stress. At this stage, short-term holders aren’t just uncomfortable, they’re losing conviction. Every failed bounce reinforces doubt. Every extra day underwater increases the probability of capitulation.
This is where the market quietly changes character.
By the time you reach these brighter zones, most reactive sellers have already exited. Those who remain are either long-term holders, forced bag holders, or participants with enough conviction to endure the drawdown. Selling pressure begins to dry up at this stage. Not because optimism returns, but because there’s simply no one left who needs to sell.
That’s when markets become asymmetric.
At exhaustion, demand doesn’t need to surge. It just needs to exist. With supply exhausted, even modest buying pressure can push price higher. This is why bottoms often feel boring, frustrating, and disbelieved in real time. They form not on excitement, but on apathy.
Human psychology hasn’t changed across cycles. The market has evolved. The narrative has rotated. But the pain tolerance of participants remains strikingly stable.

Bitcoin Days Spent In Loss
The 100 and 200 Day Thresholds
When you zoom out and study previous Bitcoin bear markets, a pattern emerges that’s almost uncomfortable in its consistency.
Across the last 3 major cycles, Bitcoin bottomed around an eerily similar mark below STH realised price:
2015: 208 days
2019: 203 days
2022: 210 days
Different macro backdrops. Different liquidity regimes. Entirely different market participants. And yet, the duration of pain before bottoming was nearly identical.
That’s not coincidence. It’s behavioural.
Roughly 200 days appears to be the outer limit of tolerance for short-term holders in severe downturns. Beyond that point, the cohort has effectively been flushed out. What remains is a market structurally incapable of sustained selling.
But there’s another level that matters: the 100-day mark.
In milder bear markets or mid-cycle corrections, Bitcoin often doesn’t need a full 200-day capitulation. Around 100 days below cost basis has historically been enough to exhaust sellers in the short-term.
Think of it as a fork in the road:
~100 days: Shallow bear correction, seller exhaustion arrives early.
~200 days: Deep bear market, prolonged structural damage, full reset.
This methodology essentially frames probability. It tells you how far through the psychological process the market has progressed.
The 100D and 200D Thresholds
The Current Market
As of now, Bitcoin has spent 84 consecutive days below the short-term holder realised price. That places us firmly in the later stages of distress, but not yet at historical exhaustion.
From here, 2 scenarios matter:
The first is a 100-day capitulation event. In this case, we’d expect roughly another 2 weeks of negative or sideways price action before seller exhaustion sets in. That would place a potential turning point in early February. This aligns with milder bear market corrections rather than full-blown capitulation events.
The second scenario is a deeper drawdown toward the 200-day level, implying another 4 months of suppressed price action. This would suggest more structural damage and a longer recovery phase.
Personally, I lean toward the first. The reason lies in market structure and historical analogy; specifically 2019.
That period wasn’t a euphoric blow-off followed by collapse. It was a slow bleed. Distribution at highs, followed by gradual sentiment erosion and extended boredom. Sound familiar?
The current cycle didn’t end in mania either. It ended in exhaustion. That distinction matters.
In 2019, Bitcoin spent over 110 days below the short-term holder realised price before aggressively reversing. And what followed wasn’t a timid recovery. It was a liquidity-driven expansion phase that caught most participants off guard.
When you overlay that behaviour onto today’s backdrop, the parallels are hard to ignore. Liquidity conditions are definitely improving. Macro expectations are shifting. And markets, as always, tend to front-run those changes long before they appear in headlines.
If this scenario plays out, we should expect choppy consolidation around the short-term holder realised price once reclaimed. Confidence doesn’t rebuild overnight. Short-term holders need time to regain profitability, and sentiment needs space to stabilise.
But once that process completes, the groundwork for a sustained rally is already laid.

Are we mirroring the 2019 mini-bear?
My Take on Where This Leaves Us
What I like most about this framework is its honesty. It doesn’t promise perfect timing. It doesn’t rely on any particularly complex data either. It simply acknowledges something most market participants try to avoid: pain has a duration.
Rather than asking, “Is this the bottom?”, a far better question is, “How much psychological damage has already been done?”
Right now, the data suggests we’re far closer to exhaustion than fear would have you believe. That doesn’t mean price must reverse tomorrow. But it does mean the pool of forced sellers is shrinking by the day.
I truly believe we are in the final innings of this specific period of distress. Whether it takes another 15 days or another 100, the selling energy is being depleted every single day we stay down here.
We are much closer to the end of this corrective phase than the beginning.
The macro backdrop for the rest of 2026 looks incredibly healthy from a liquidity perspective, and markets are experts at front-running that reality.
This is why behaviour-based analysis is so powerful. Price can be manipulated. Sentiment can be noisy. But time spent underwater leaves scars. And once those scars accumulate, behaviour changes.
So if you anchor yourself to probabilities rather than predictions, this phase of the cycle becomes far easier to navigate.
The human brain hasn't changed in thousands of years, and it certainly hasn't changed since the last Bitcoin cycle.
I’ll catch you in the next one.
Cheers,
