
Why Strategy’s risk has collapsed, upside is asymmetric, and the market still isn’t pricing it properly
Most investors think something broke with MSTR. The price lagged. mNAV collapsed. Sentiment turned sour. But that conclusion says more about emotional anchoring than it does about what actually happened under the hood.
In this article, I walk through why MSTR executed exactly as designed, why mNAV compression (not strategy failure) drove the underperformance, why momentum signals are now at historic extremes, and how the risk profile of this trade has quietly but materially reset here in 2026.
Let’s get into it.
Satoshis Per Share Dominance: Strategy’s core yardstick keeps climbing relentlessly, delivering a 35.8% BTC yield in 2025.
mNAV Compression Complete: The massive valuation premium that fuelled earlier outperformance has largely evaporated, leaving far more upside than downside risk.
Extreme Oversold Signals: The Velocity RSI (priced in BTC) has never been this oversold, even versus the depths of the previous bear market.
Asymmetric Payoff Structure: Bitcoin downside is now the primary risk, while mNAV expansion offers leveraged upside that could prove spectacular.
The Uncatchable Bitcoin Juggernaut
I think 2026 could be a brutal year for many Bitcoin corporate treasury companies. Some will underperform badly. Some may quietly unwind. A few could even go bust. And if that happens at scale, it won’t be particularly helpful for short-term Bitcoin price action either.
But Strategy sits in a completely different category.
With 673,783 BTC now on the balance sheet, MSTR is not just ahead, it is uncatchable. There is no plausible path where another public company closes that gap. Not through capital markets. Not through operating cash flow. Not through timing luck. That race is over.
And this matters, because Bitcoin treasury strategies are not equal. In stressed conditions, size becomes defence. Liquidity becomes survival. Credibility becomes optionality.
MSTR has all three.
More importantly, their strategy is still executing exactly as designed. You have to anchor on that fact, because it gets lost when price underperforms.
Let’s look at what actually happened in 2025.
Their primary performance metric is not share price. It’s Satoshis Per Share. And on that front, they delivered.
Satoshis per share increased from 158,600 at the end of 2024 to 215,406 at the end of 2025.
That equates to a BTC yield of 35.8% for the year.
In practical terms, MSTR generated more Bitcoin per share than the year before.
To put that into perspective, in 2024 you needed 551 shares of MSTR to equate to 1 Bitcoin. By the end of 2025, that number dropped to 464 shares. That is not failure. That is mechanical execution.
And this is where many investors lose the plot. They look at relative performance, feel pain, and conclude something broke. It didn’t. The engine did exactly what it was supposed to do. The valuation layer on top of it is what moved violently.
Which brings us to the uncomfortable but necessary question.
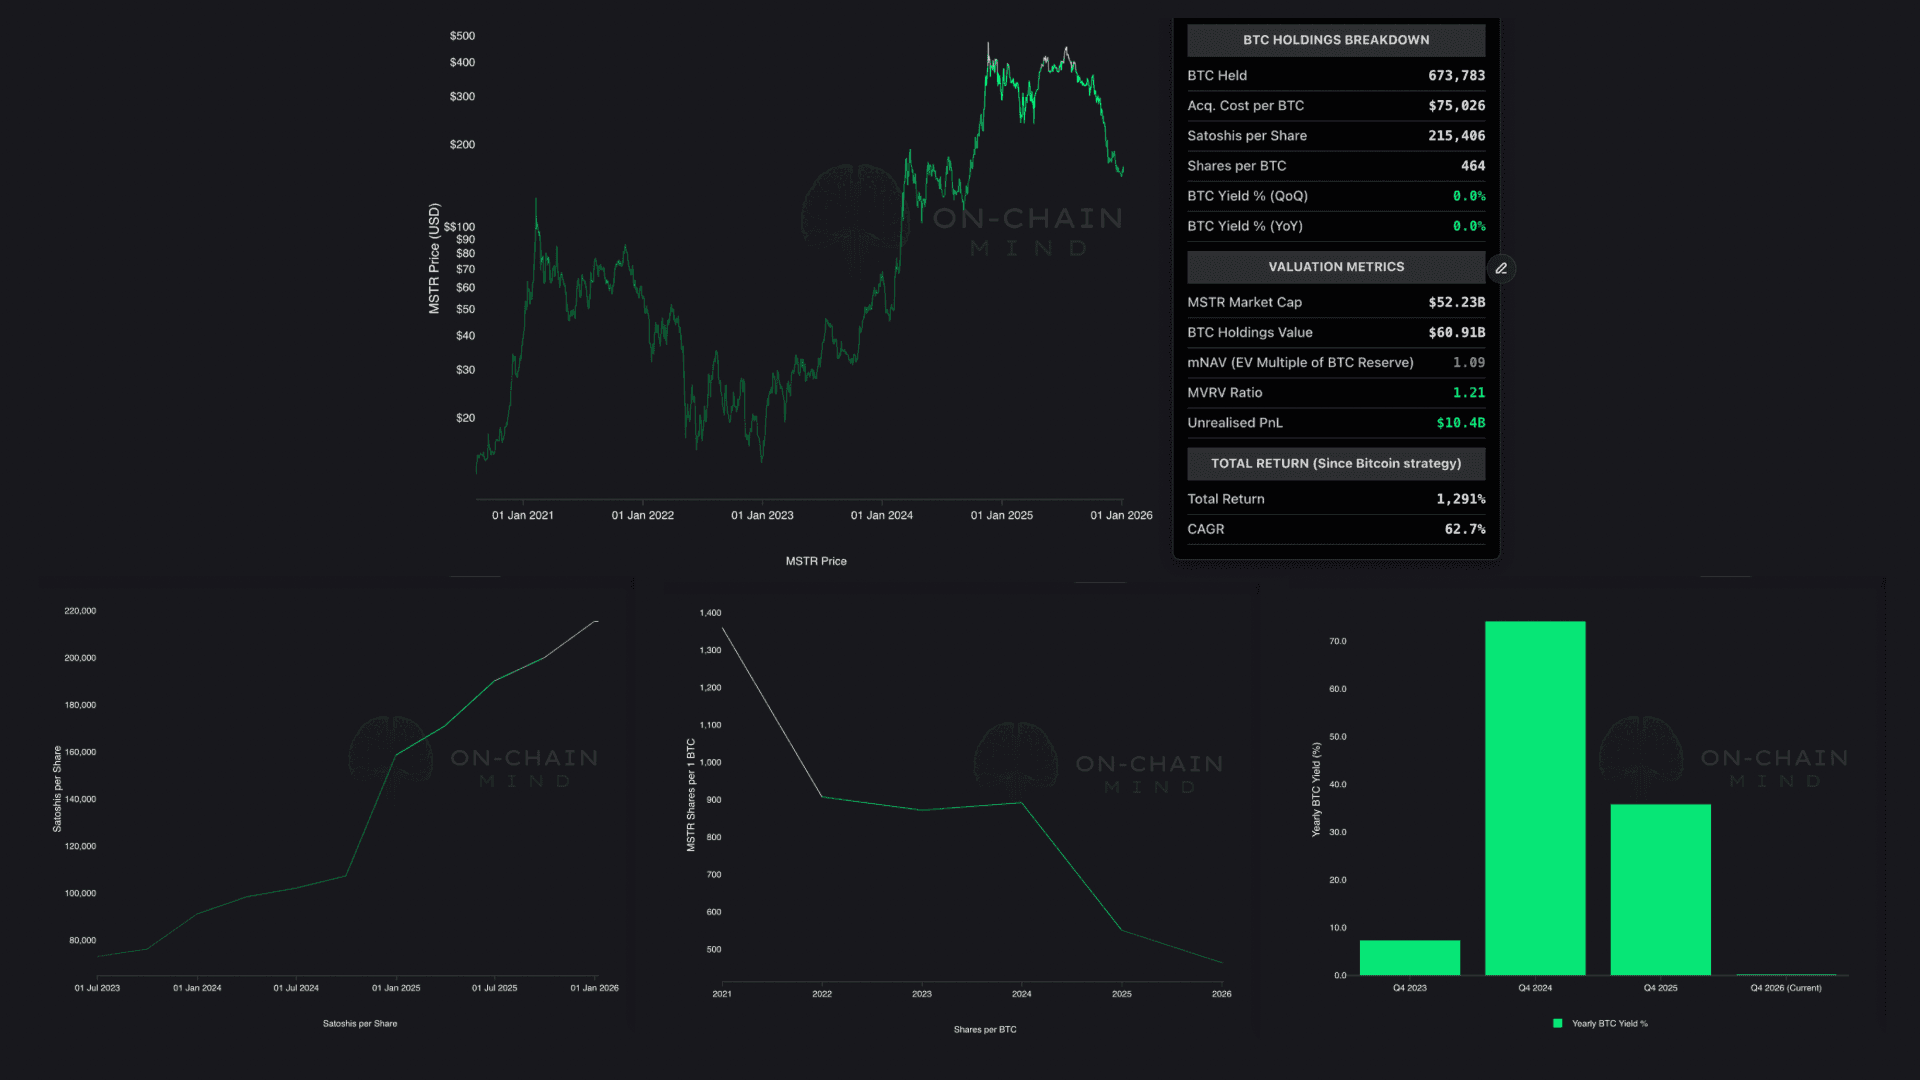
MSTR Dashboard, including Satoshis per Share, Shares per BTC and BTC Yield %
Why did MSTR Suffer?
MSTR underperformed Bitcoin in 2025. That’s not debatable. But the reason why is often misunderstood.
Its Relative Performance Ratio fell from around 3x to roughly 1.77x. In simple terms, you are still 1.77 times better off holding MSTR than holding spot BTC compared to the start of the strategy in August 2020. And that’s not a collapse, that’s mean reversion.
So what actually caused the drawdown in relative terms? It wasn’t poor strategy execution, it wasn’t balance sheet risk, and it certainly wasn’t dilution failure. The answer is far simpler and far more mechanical.
It was mNAV compression.
At the start of 2025, MSTR was trading at over a 2x multiple to its Bitcoin net asset value. Just a few months earlier, in November, that multiple briefly stretched to around 3.5x. That level of valuation was always fragile. When a stock trades that far above its underlying asset value, it carries significant downside risk from valuation alone.
Fast forward to today and the picture looks completely different. The mNAV now sits at roughly 1.09x, which is effectively parity. In other words, almost all of the excess valuation has already been wrung out.
This shift changes the entire risk profile. When a stock trades at 3-4x mNAV, compression can destroy relative performance even if the underlying asset performs well. That is exactly what happened in 2025. The strategy worked, Bitcoin exposure increased, but the valuation layer collapsed on top of it.
Now flip that logic. At an mNAV of ~1:
The downside from further compression is minimal.
The upside from expansion is potentially enormous.
Even a move to a modest 2x mNAV generates substantial BTC outperformance.
Historically, MSTR has repeatedly traded between 3-4x during strong phases.
This is the key insight most people miss: the risk has been deflated out of this stock.
Today, the probability-weighted outcomes look completely different to a year ago. The chance of further meaningful downside from valuation is far smaller than the chance of upside from re-rating.
And crucially, all of this happened while MSTR executed flawlessly.
That’s not a broken trade. That’s a reset.
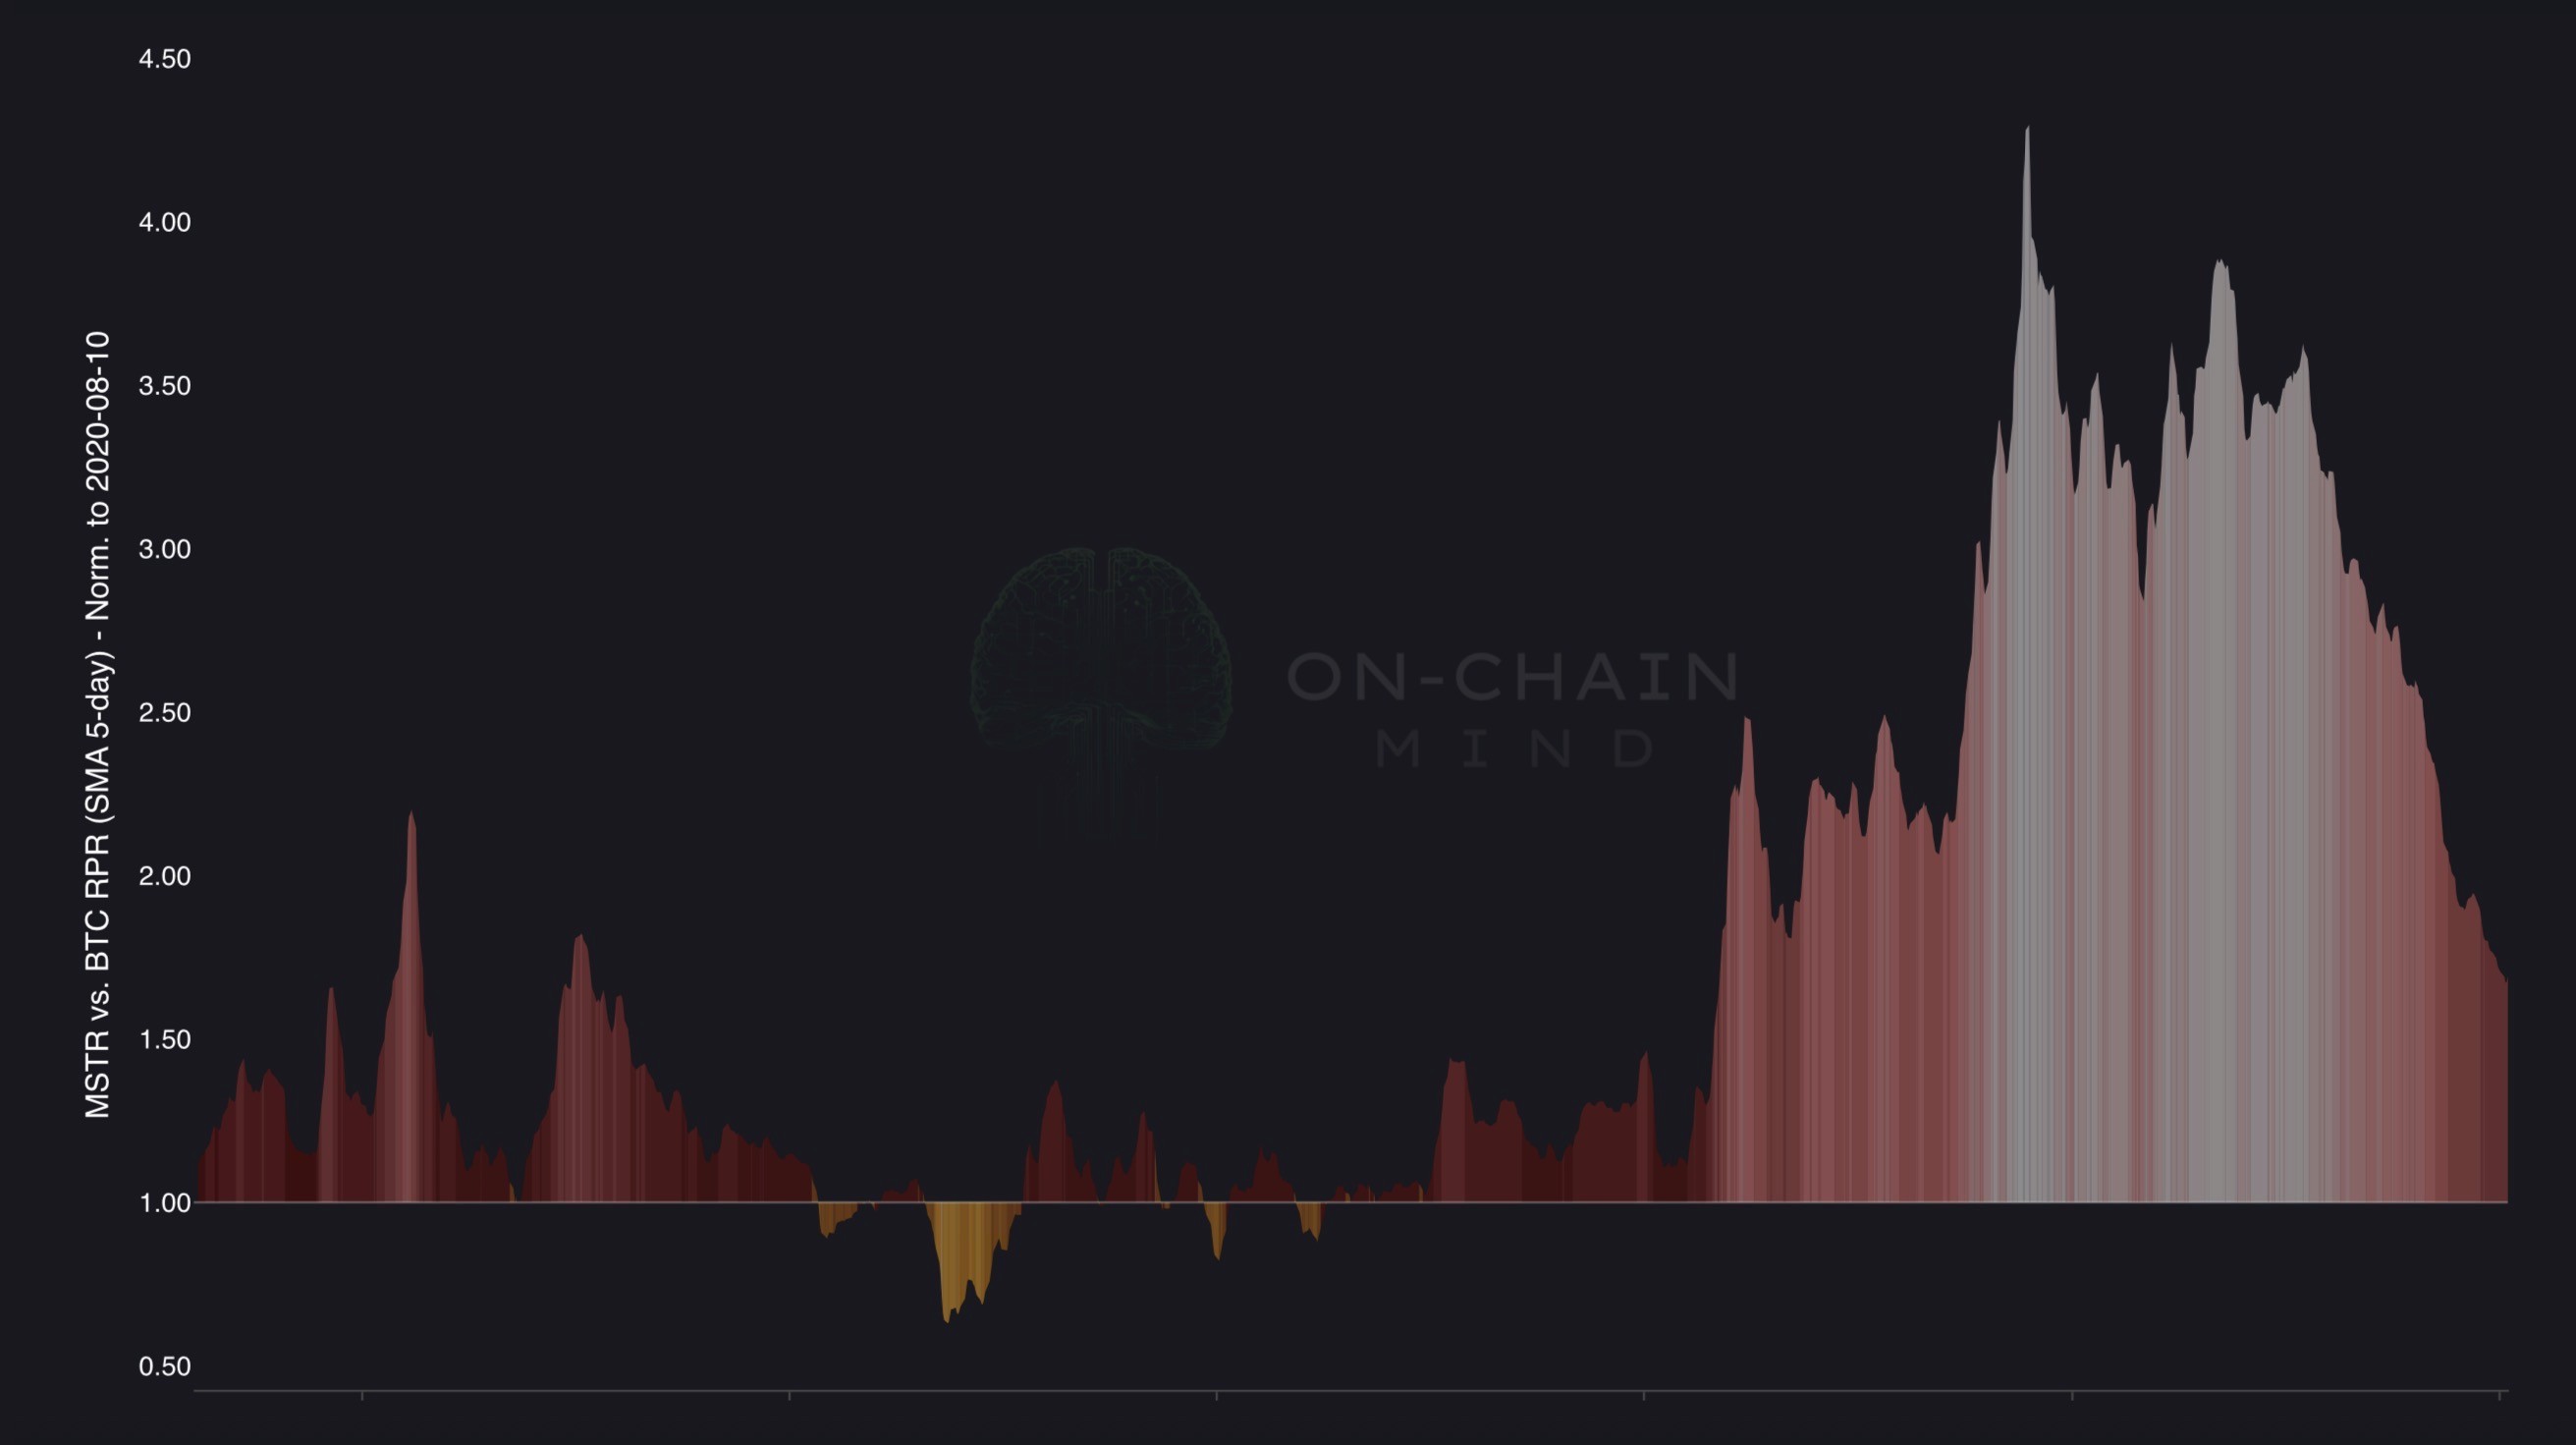
MSTR Relative Performnance Ratio (RPR)
Momentum Signals Don’t Get More Extreme Than This
Now let’s talk about the technical momentum measured properly. Right now, the weekly Velocity RSI, denominated in BTC rather than USD, is at the most oversold level in MSTR’s history. More oversold than during the depths of the previous bear market.
That should make you pause.
This indicator is custom-tuned specifically for Strategy’s extreme price behaviour. It enhances the classic RSI by:
Incorporating price velocity, not just price change.
Measuring the directional speed of recent highs and lows.
Applying RMA smoothing to balance responsiveness with signal clarity.
The result is a metric designed to capture MSTR’s explosive parabolic advances (and its equally violent reversals) with exceptional precision. And when this indicator reaches extremes, it tends to matter.
An oversold reading like this, particularly in BTC terms, tells you something very specific: MSTR has underperformed Bitcoin at a rate that is historically unsustainable. That doesn’t mean price immediately reverses tomorrow, but it does mean the odds increasingly favour relative strength returning over the medium term.
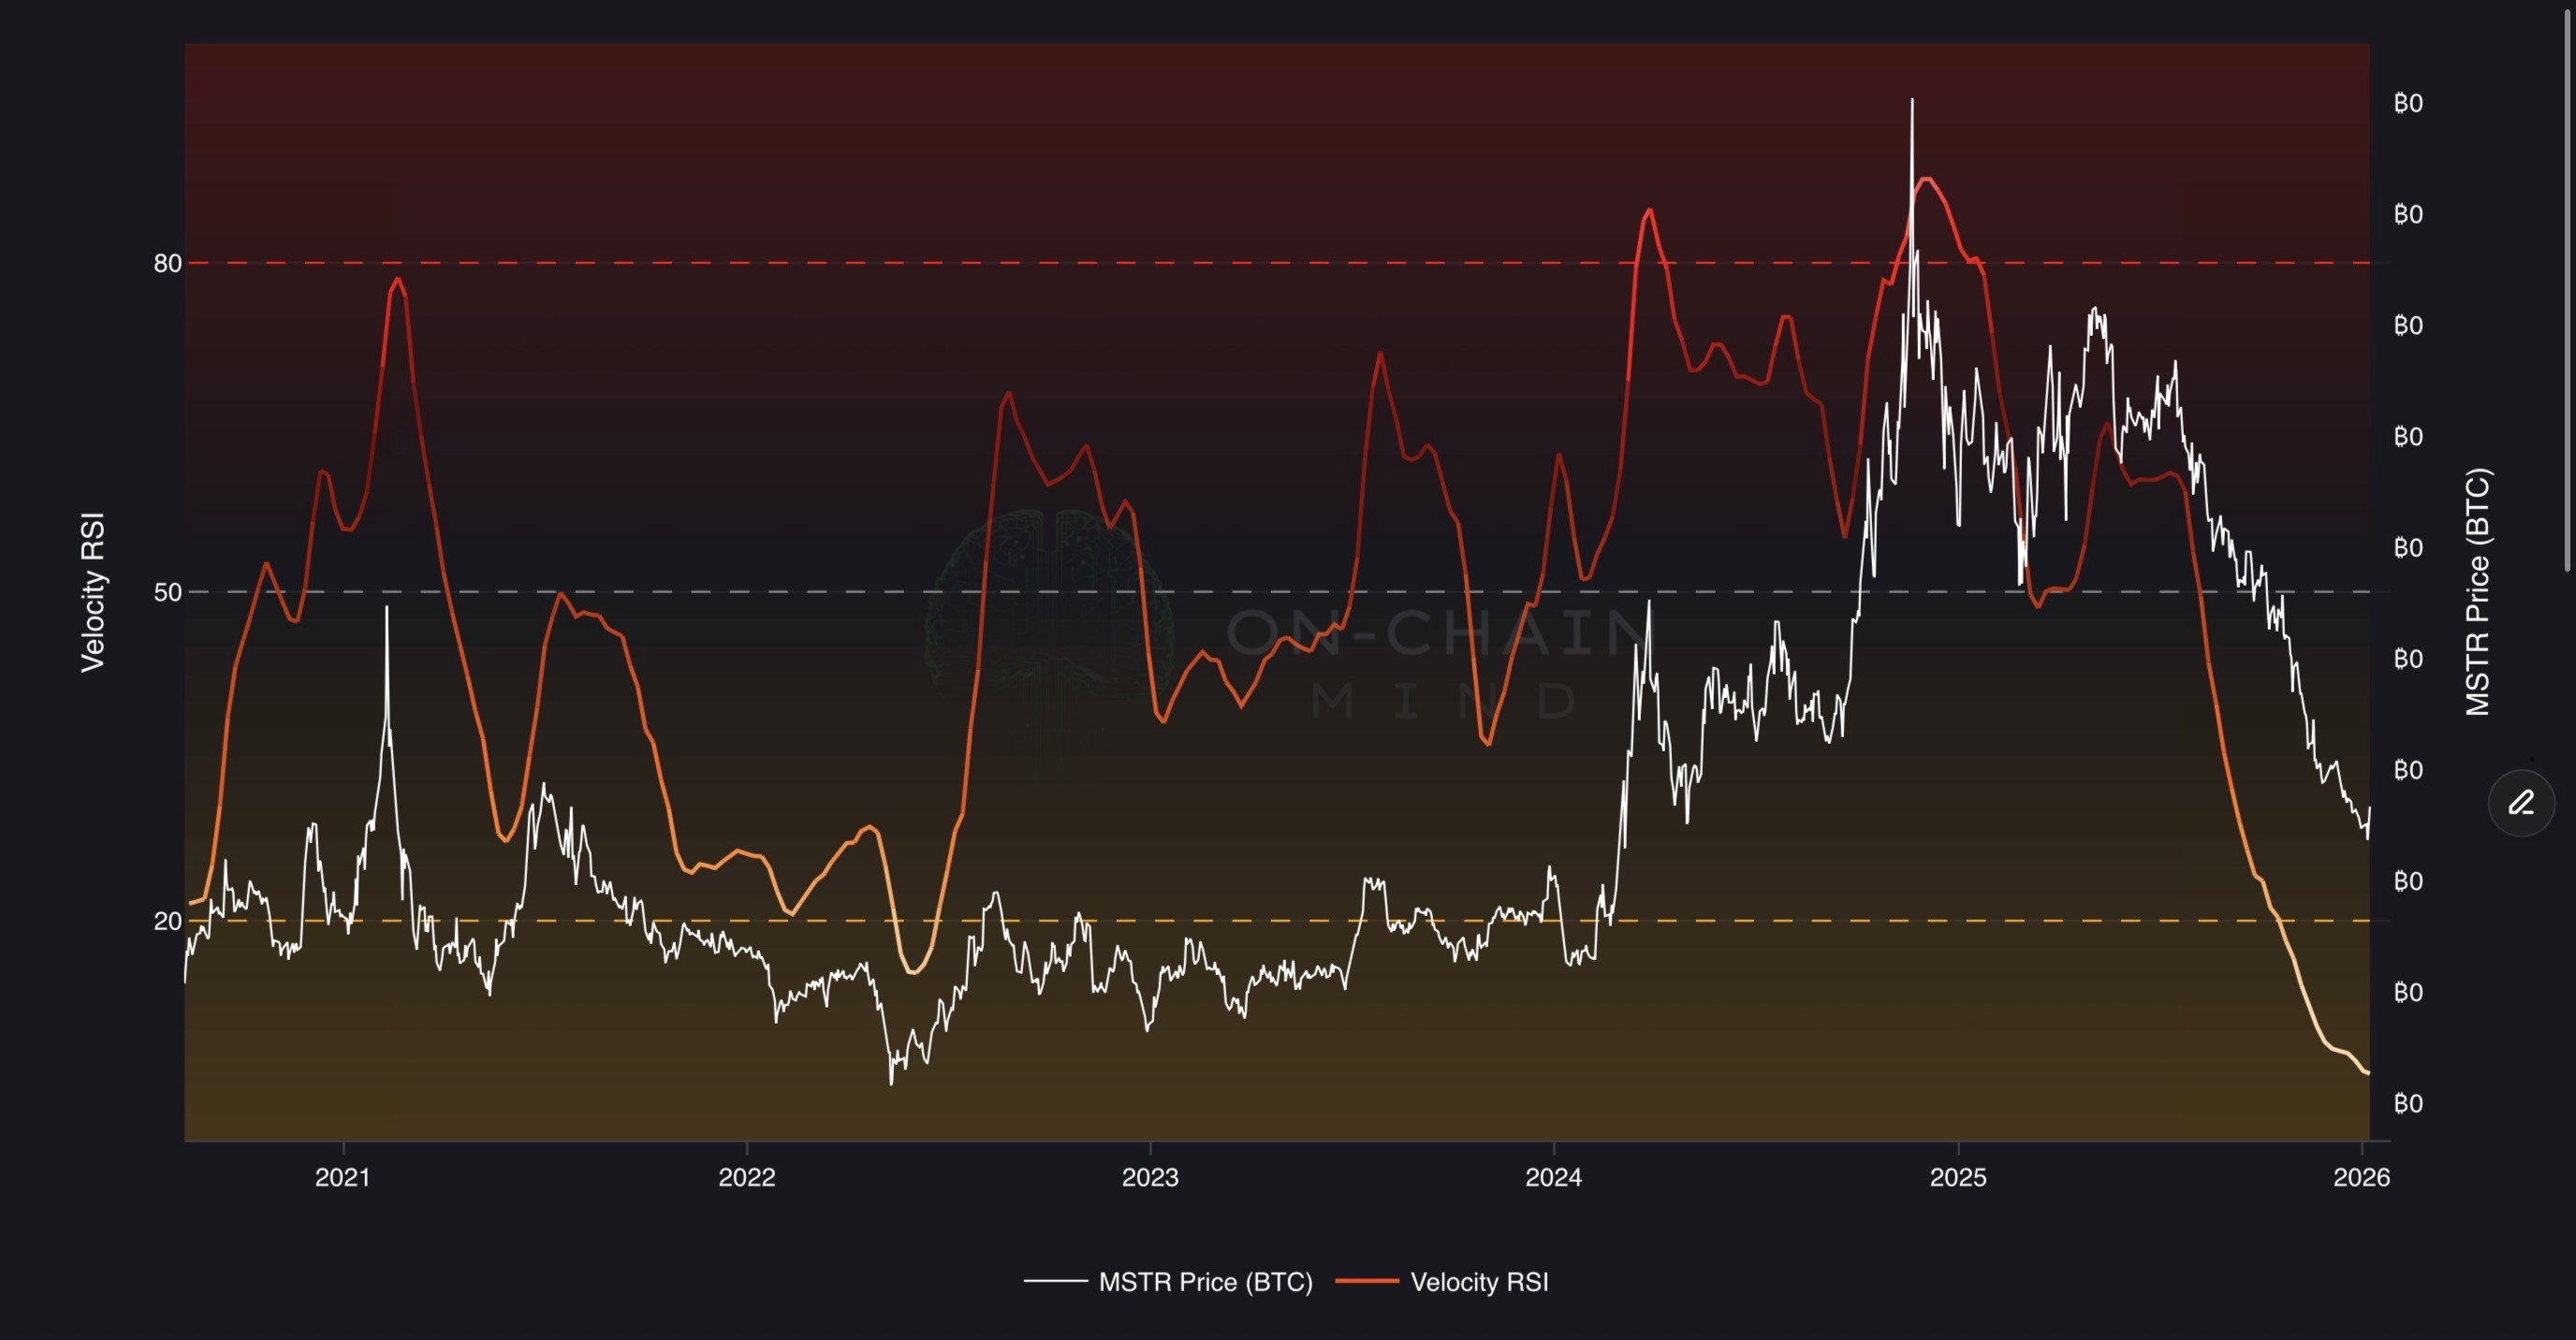
MSTR weekly Velocity RSI (BTC denominated)
Downside, Upside, and the Real Asymmetry
Let’s talk numbers. Can MSTR go lower from here? Yes. But the reason matters. At this point, it’s not going to be driven by mNAV compression. That risk has largely been exhausted. Any further downside is far more likely to come from Bitcoin itself falling in price.
In other words, the downside increasingly starts to resemble holding spot Bitcoin.
The upside, however, does not.
On the upside, you’re stacking effects. You get Bitcoin price appreciation, potential mNAV expansion layered on top of that, and reflexive capital flows returning to the equity. That combination is where the real asymmetry lives.
For price framing, the 155-Day VWAP Cost Bands remain my primary reference. This indicator calculates Strategy’s 155-day rolling VWAP and overlays deviation bands from ±1σ to ±4σ based on historical volatility.
Right now, price is sitting near the -3σ band, which is the second-to-last downside level. Historically, there has been one lower band that occasionally gets tagged in extreme conditions: the -4σ band, which currently sits around $114. That would represent a true maximum pain scenario.
Even in that case, I struggle to see sustained trading below $100 ever again. That level would signal extreme dislocation rather than anything resembling fair value.
On the upside, the roadmap becomes far more interesting. The first meaningful target is the $285 fair value baseline at 1x. From there, the upper cost band currently sits at $713. These targets are dynamic and can shift quickly, as we’ve seen repeatedly during momentum expansions.
So yes, my long-term view remains unchanged. A $1,000 per share MSTR is absolutely on the table at some point in the not too distant future. Not because it sounds exciting, but because the mathematical probability supports it under the right conditions of the mNAV returning to its historical mean during a bull cycle.
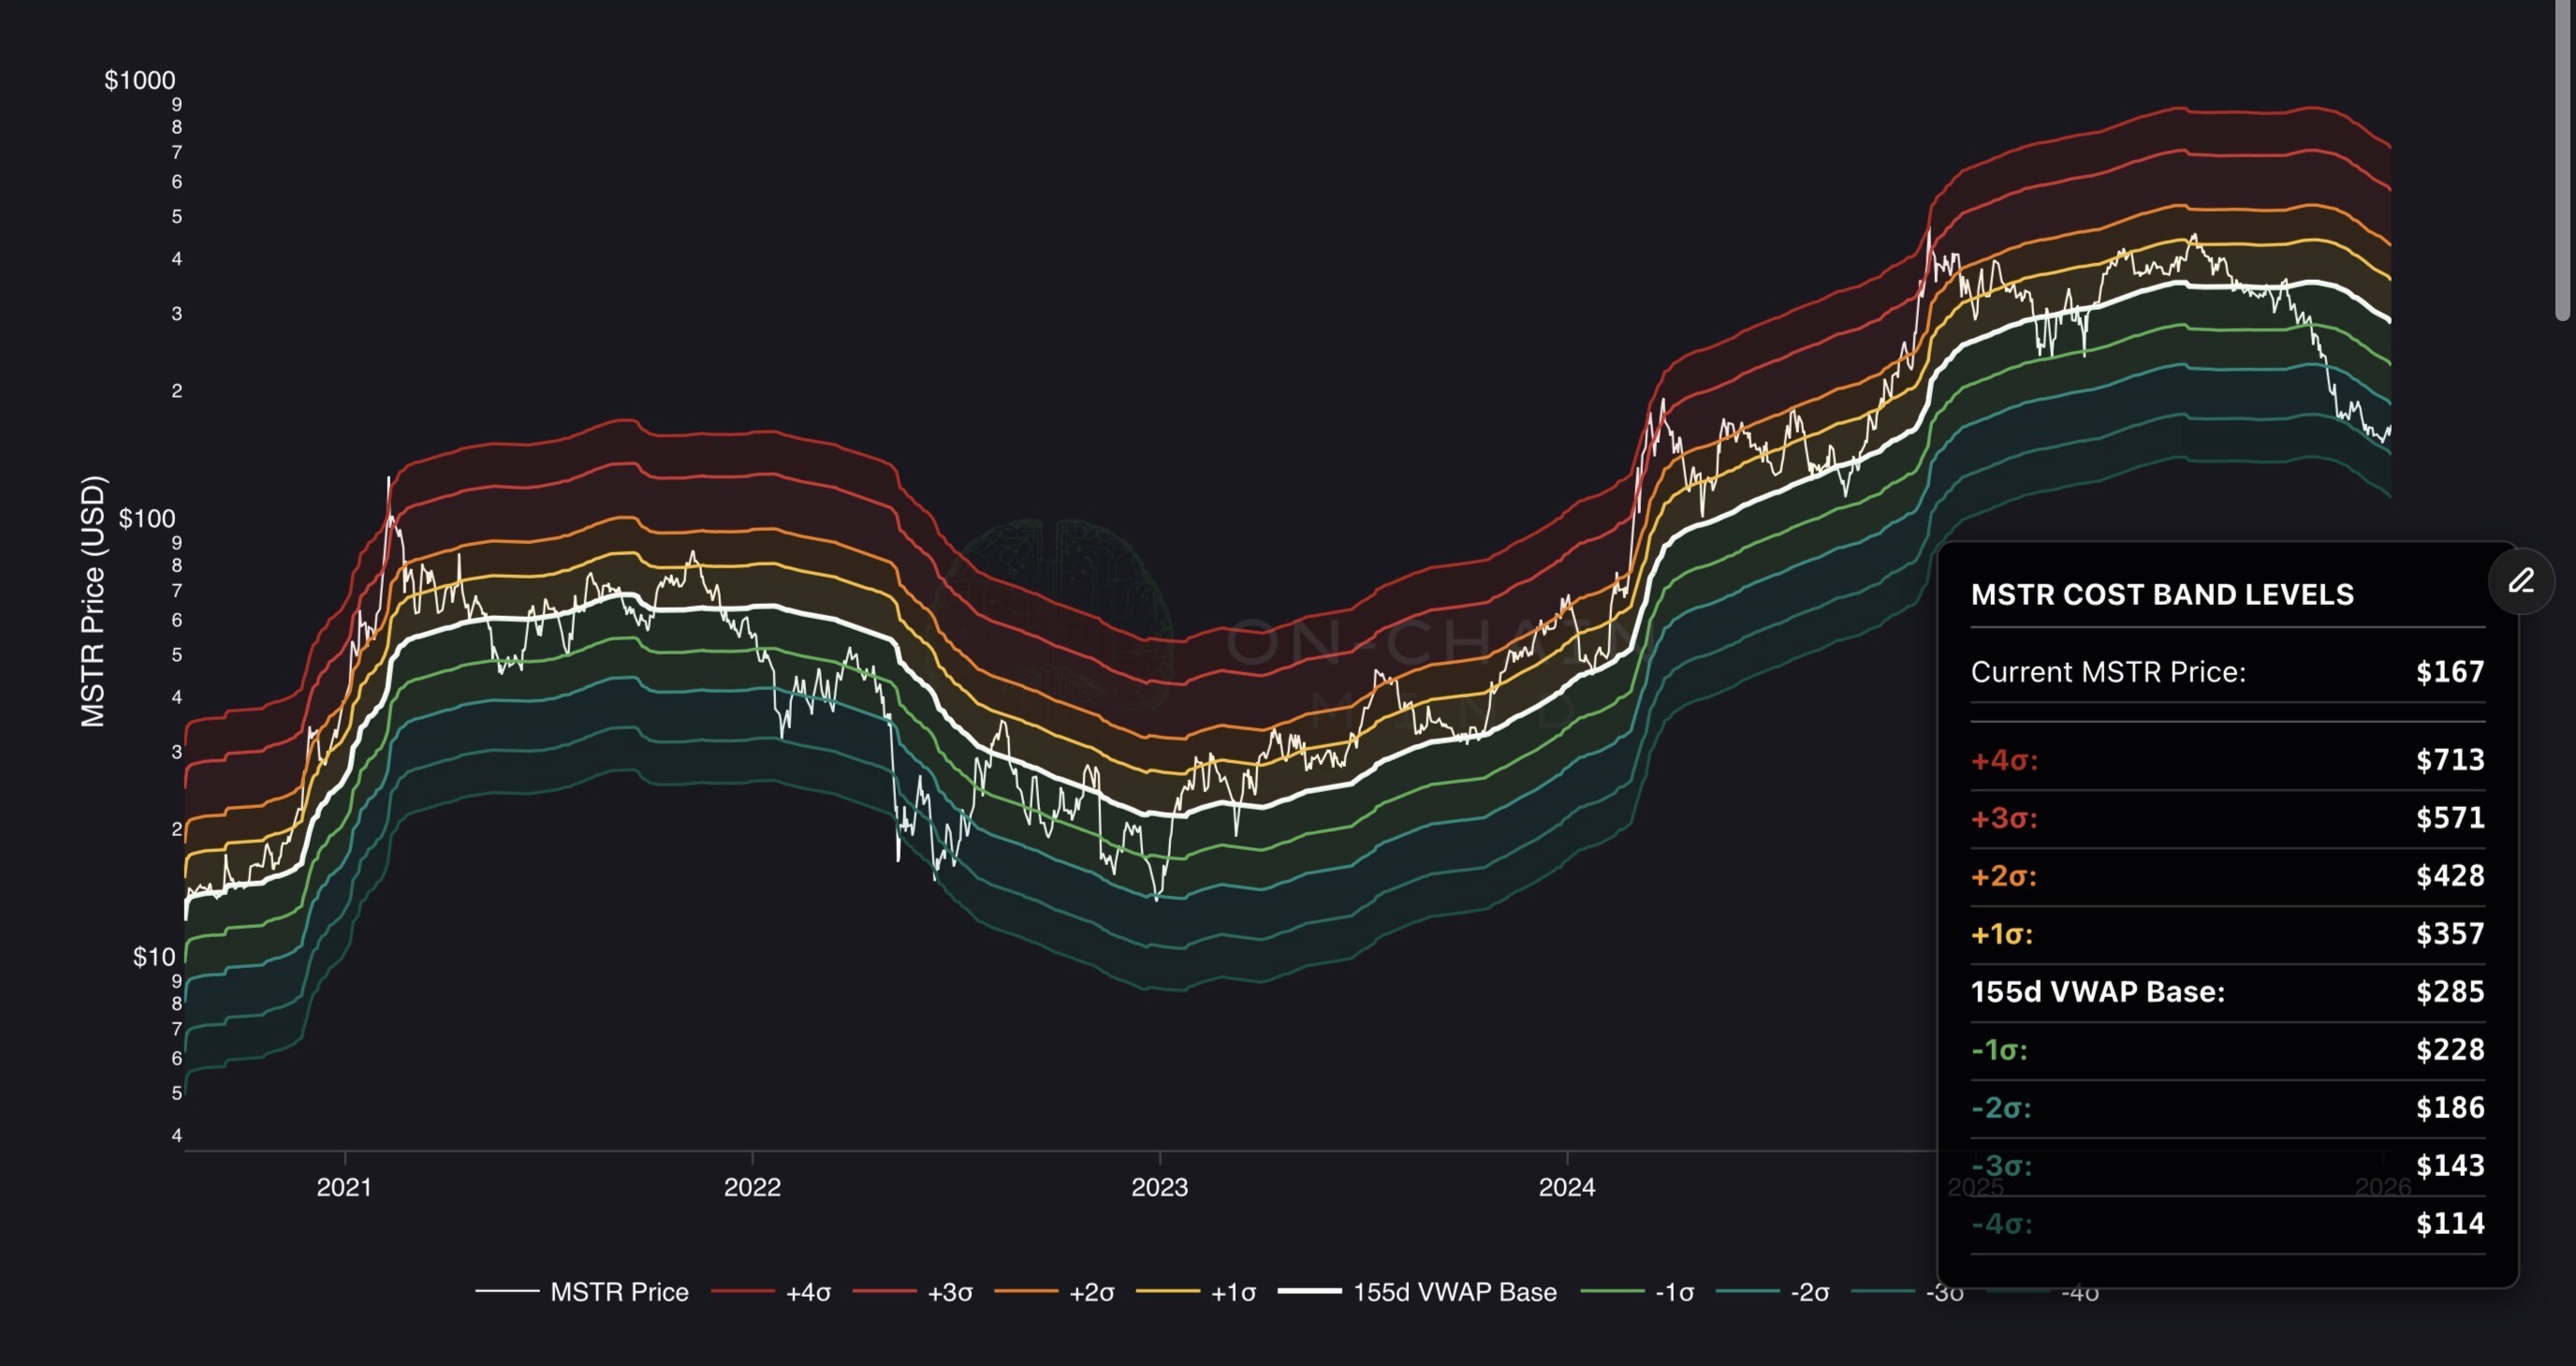
MSTR 155D VWAP Cost Bands
Why 2026 Is the Year the Market Relearns This Trade
Here’s the honest truth: most people are emotionally exhausted with MSTR. And that’s usually the point where opportunity starts to re-emerge.
The stock has already been through the phase where optimism was punished. Valuation has been compressed, momentum has been reset, and risk has been wrung out. Yet despite all of that, the underlying machine is stronger than ever.
This is no longer a crowded trade. It’s a misunderstood one.
If Bitcoin grinds higher slowly, MSTR will look boring, right up until it doesn’t. And if Bitcoin accelerates, MSTR won’t politely follow. It never has. It reprices violently. That’s simply the nature of embedded leverage combined with balance-sheet dominance.
I’m not interested in pretending this is risk-free. It isn’t. But relative to a year ago, the risk-reward profile has improved dramatically, while most people remain anchored to past pain. That disconnect is exactly what creates outperformance.
My personal view is that MSTR will continue to lag for the first three-quarters of 2026, much like it did in early 2024, only to essentially teleport higher during a year-end liquidity surge. If you are waiting for a lower entry, you are gambling against a company that has proven it can execute its strategy to perfection even when the market hates it.
2026 doesn’t require perfection. It just requires Bitcoin to survive, liquidity to return, and valuation to normalise even slightly.
And if that happens, MSTR doesn’t just keep up with Bitcoin. It reminds the market why this trade existed in the first place.
I’ll catch you in the next one.
Cheers,
