
Seeing the bigger picture through time
Most investors don’t get Bitcoin wrong; they get their time horizon wrong. When price chops around or breaks down in the short-term, our minds often get hijacked by emotion and the long-term structure gets completely thrown out the window.
This article is about is about correcting that mistake, zooming out from the noise, and understanding the frameworks behind Bitcoin’s extraordinary growth trajectory.
Let’s get into it.
Perspective Matters: Anchoring to recent price drops ignores Bitcoin’s exponential trajectory, leading to unnecessary panic.
A Critical System: Unlike assets governed by Normal Distributions, Bitcoin’s extreme rallies and violent drawdowns are expected features, not bugs, of the system.
Adoption Parallels: We’re at internet’s 1997 stage; non-linear growth means massive future value from continued user influx.
Long-Term Risk-Reward: Using drawdown models highlights asymmetric opportunities when Bitcoin trades below its structural fair value.
The Illusion of Short-Term Volatility
It’s natural to anchor to what we can see today: the latest price action, the recent volatility. And right now, Bitcoin has dropped sharply below trend and begun to consolidate again.
It’s below the 200-day moving average, a level that investors watch closely. This line acts as a psychological dividing point: when price is above it, optimism dominates; when below, fear spreads.
Expecting a clean, V-shaped recovery is unrealistic. Bitcoin rarely move in straight lines. After a sharp drop, prices usually chop around before establishing the next trend. Frustration is normal, but so is this behaviour.
But here’s the crucial part: if you only look at the short term, it’s easy to conclude the cycle is over, or even that “this time is different”. But when we zoom out and frame Bitcoin in a long-term context, today’s drawdown is barely noticeable. A mere blip on the trajectory of structural growth.
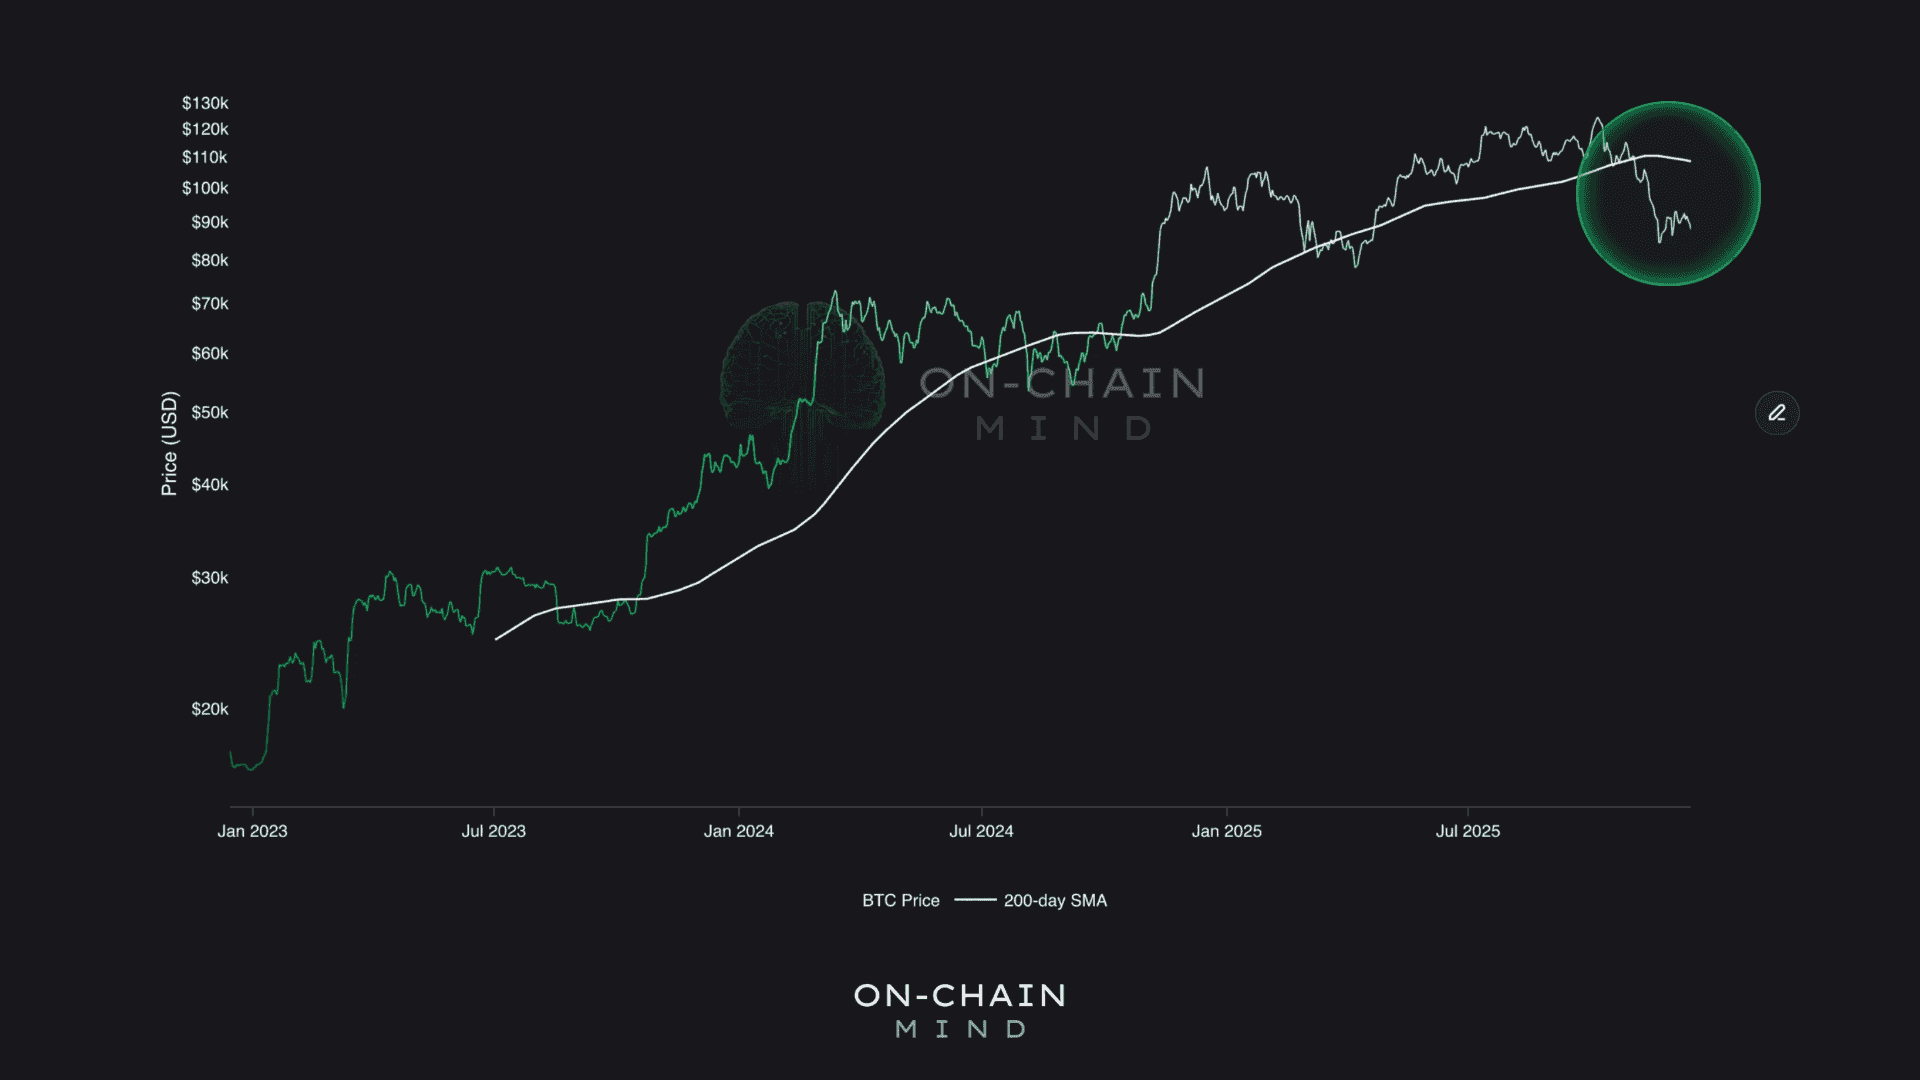
Bitcoin’s 200-day moving average
Understanding Exponential Change
Most investors are familiar with Bitcoin charts plotted on a logarithmic scale. Unlike linear charts, where early years look negligible and recent volatility looks extreme, logarithmic charts give each percentage move equal weight. This representation more accurately captures long-term growth.
To refine this further, we can apply logarithmic regression curves. These curves account for Bitcoin’s diminishing returns over time and provide a smooth growth trajectory. It’s a simple yet powerful tool: it strips away emotional noise and highlights structural adoption.
But you can visualise this same growth pattern but from a different perspective: logarithmic time scales. By compressing the time axis logarithmically, Bitcoin’s long-term growth transforms into something approximating a straight line, which is a representation of what’s called the “power law”.
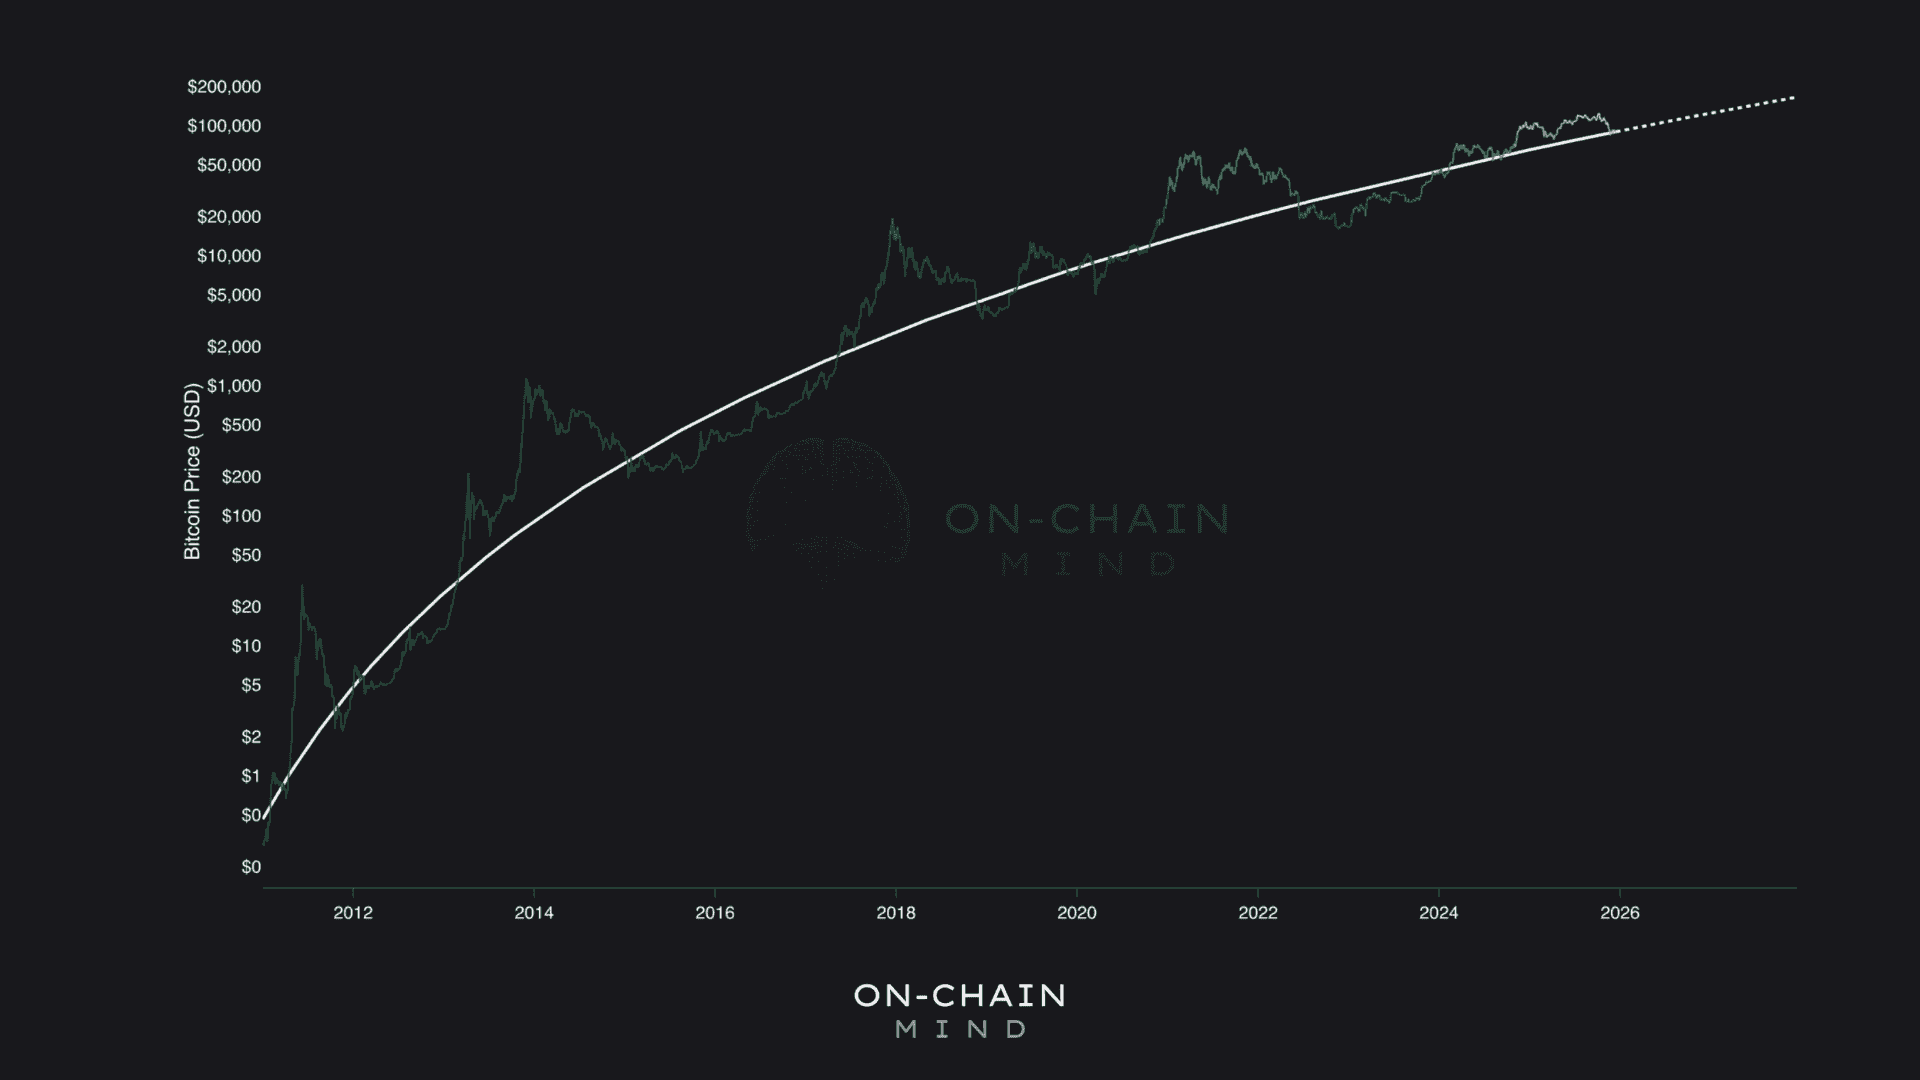
Bitcoin’s Logarithmic Growth Model
Normal Distributions vs. Power Laws
For those unfamiliar, the term might sound intimidating, but the concept itself is beautifully simple and pervasive in nature.
Most investors assume Bitcoin’s price action is purely random, speculative, or driven by hype. The Power Law demonstrates it is, in fact, structurally predictable over long time horizons.
To appreciate this concept, we must first recall its more common counterpart: the Normal Distribution, or the classic bell curve. Most phenomena in everyday life, like human height, IQ, or the probability of a car being in an accident, cluster around an average. Extreme outcomes are statistically rare and drop off quickly.
A Power Law is fundamentally different. It describes complex systems in a critical state, situated exactly on the boundary between order and chaos. These systems are highly adaptive, highly efficient, and, critically, they are capable of producing extreme outcomes far more often than a normal distribution would ever predict.
Examples of power law behaviour are found in the natural world:
Natural Systems: the magnitude of earthquakes, the spread of forest fires, the branching of river networks, and the distribution of stars in a galaxy.
Human-Created Systems: Venture capital returns, Pareto distributions in economics.
Bitcoin fits squarely into this heavy-tailed distribution category. Its price behaviour does not follow a neat bell curve. The violent drawdowns and explosive, non-linear rallies are not anomalies; they are inherent features of a system governed by this principle.
Even adoption metrics like the number of network users, the number of active wallet addresses, and the total computational hash rate securing the network all scale in this predictable, Power Law fashion.
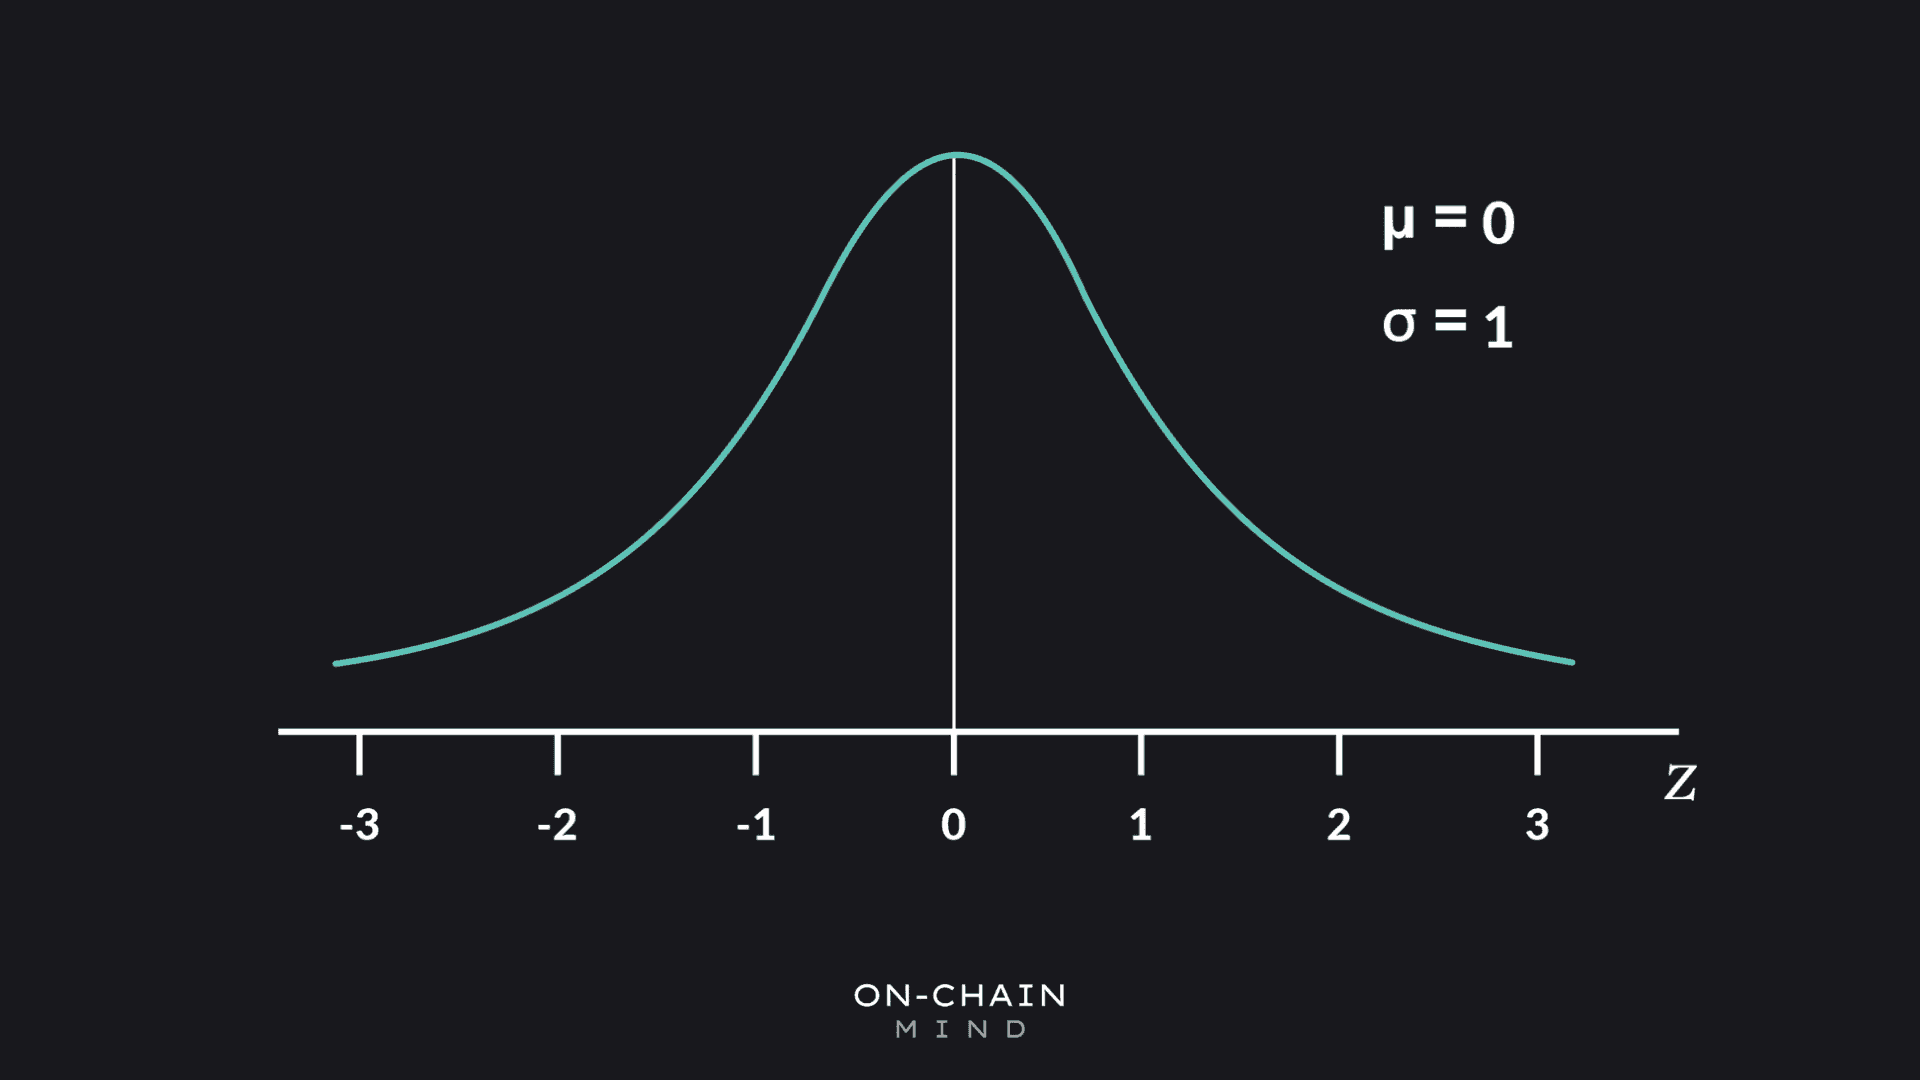
A classic Normal Distribution
Framing “Fair Value”
These models aren’t about predicting the next price tick, they’re about contextualising where Bitcoin stands structurally. Different assumptions yield different “fair value”lines: conservative models, aggressive models, and everything in between.
Base case fair value: ~$112,000, implying a 22% discount today.
Bear case fair value: ~$94,000, just 7% below current price.
Historically, Bitcoin often trades well above these long-term trajectories. Being near or below the Power Law line indicates asymmetric risk-reward: you’re paying less than the asset’s structural value relative to adoption.

The current base case Power Law fair value
Future Projections
When we project this structural trend forward, the implications are profound:
2030 projections: Base case ~$400,000, bear case ~$330,000.
2035 projections: Base case ~$1.4 million, bear case ~$1.2 million.
Numbers like these might seem outrageous to you. Yet, had this Power Law been shown to you in 2015 when Bitcoin was trading at a mere $400 and projected a 2025 value of $112,000, your reaction would have been identical.
These are not promises, but they are grounded mathematical extrapolations based on quantifiable, adoption-driven network growth.
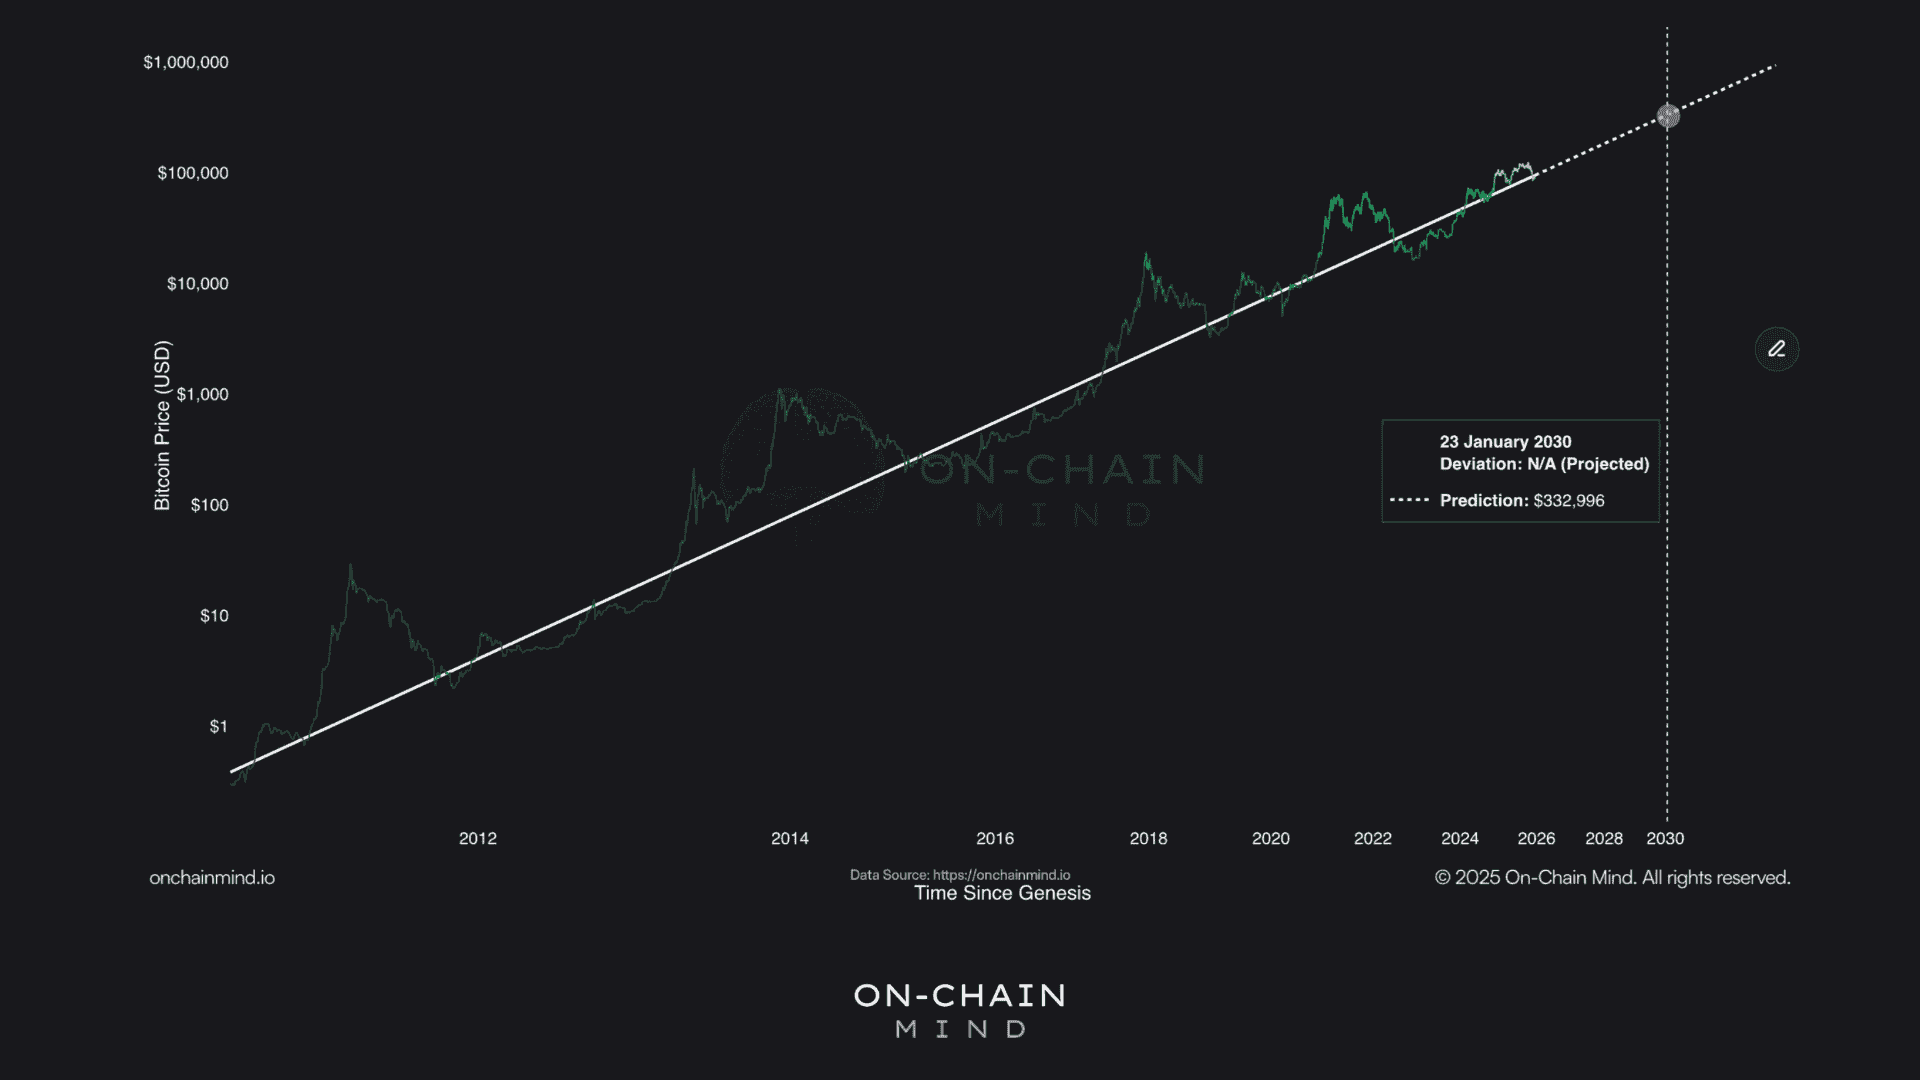
2030 “bear” case prediction: $332,000
Responding to Structure
For the long-term investor building a position, the Power Law Drawdown Chart is arguably the most practical tool. This indicator measures the percentage deviation of the current price below the Power Law fair value line, ignoring the absolute price entirely.
When the price is significantly below the trend line, the chart flashes deep red. These deep red zones represent periods where Bitcoin is trading at an asymmetric long-term opportunity and a massive discount relative to its adoption-driven growth trajectory.
This chart is not concerned with what happens next month or next quarter. Its singular purpose is to capture long-term mispricing relative to the structural trend. Historically, buying Bitcoin when this chart is in the deep red has coincided with the best long-term entry points ever recorded.
Currently, we find ourselves in the orange zone, corresponding to that 22% drawdown from the base-case fair value. While it’s certainly possible we could move deeper into the red during a prolonged bear market, the critical point remains: if that happens, the long-term risk-reward becomes exponentially asymmetric in your favour.
This framework is how you stop reacting to short-term fear and start responding to structural value.
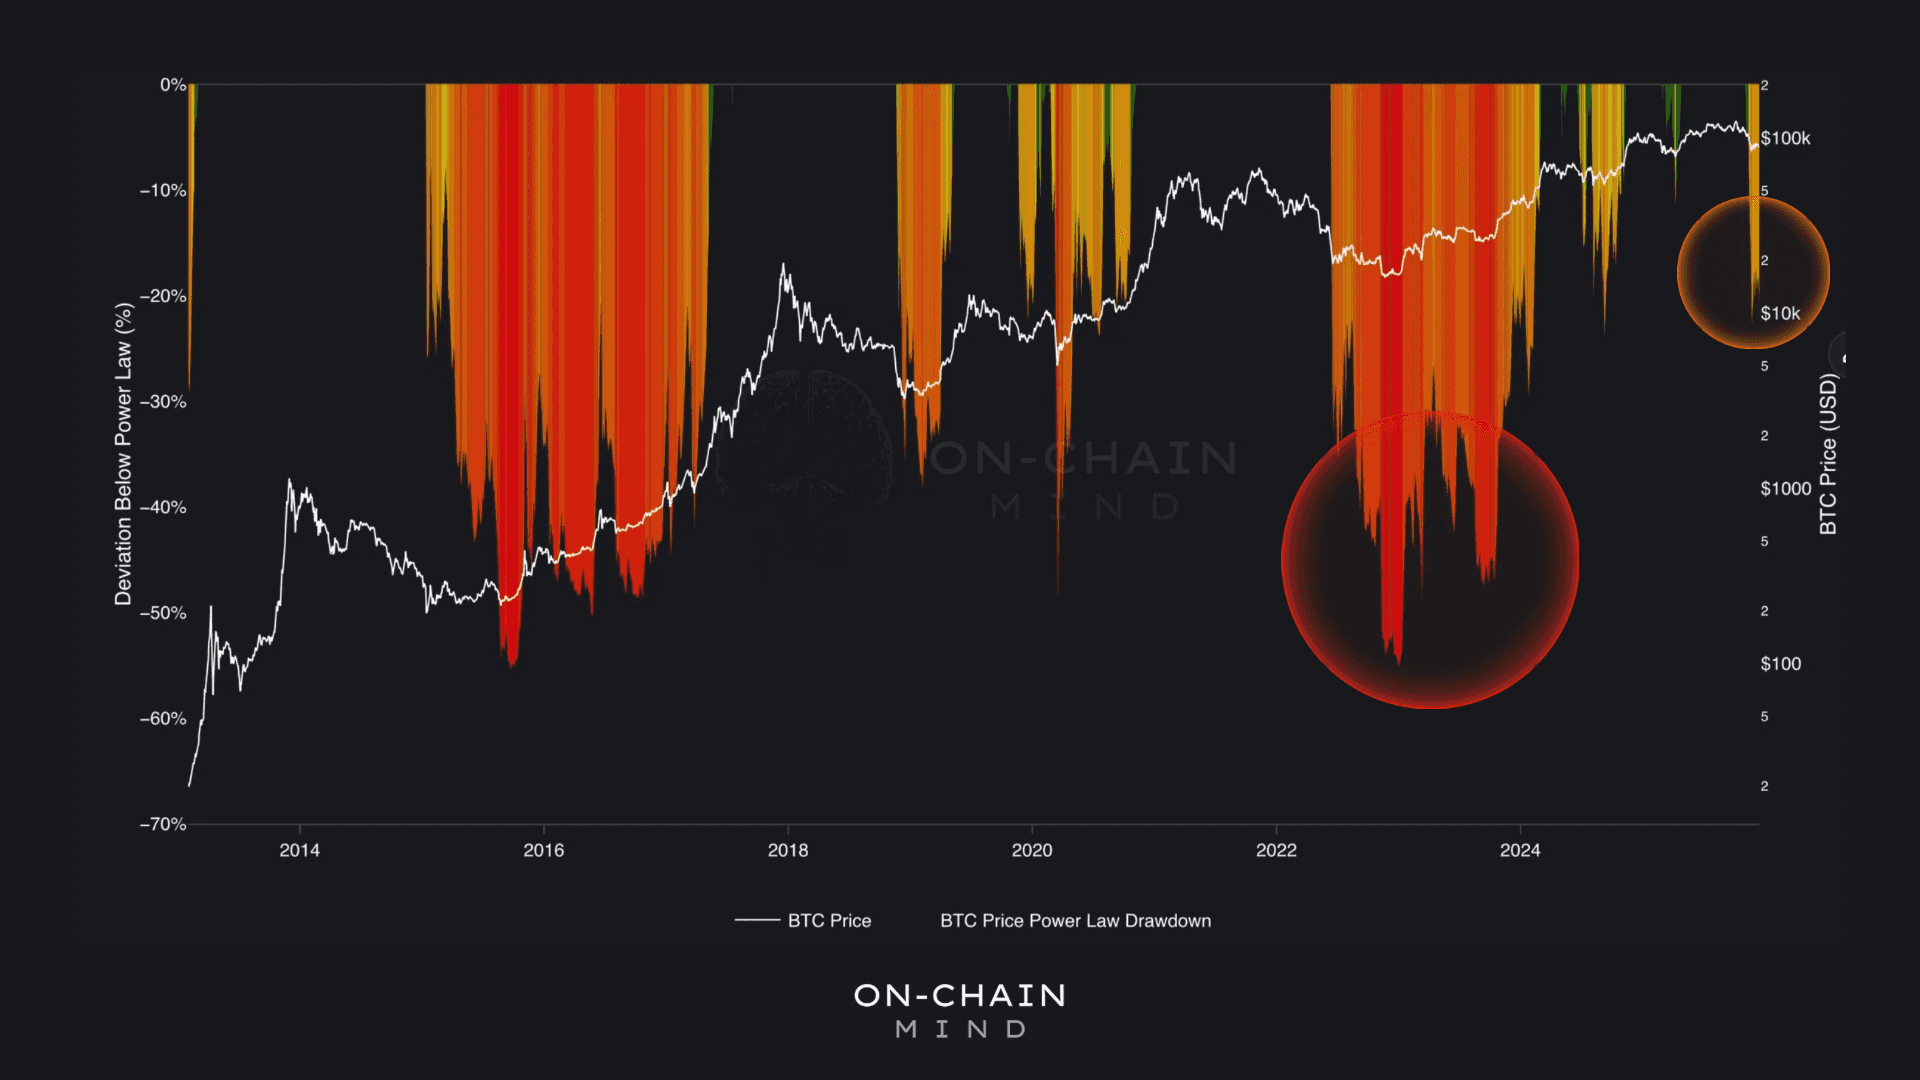
The Power Law Drawdown Chart
The Edge of Time and Perspective
This entire exercise is a lesson in two of the most undervalued assets in the financial world: Time and Perspective.
Every major drawdown in Bitcoin’s history felt catastrophic at the moment. December 2015 is a perfect example: Bitcoin hovered around $400, sentiment was so negative, yet structurally, it offered one of the best long-term opportunities imaginable.
Yet, with the passage of time, those moments fade into insignificance and are revealed as generational buying opportunities.
The people who succeeded weren’t necessarily smarter. They simply understood time. They thought in years, not weeks, in cycles, not candles, and in structure, not sentiment.
A favourite quote of mine captures this perfectly:
“Most investors massively overestimate what can happen in the next few months and massively underestimate what can happen over 5 or 10 years.”
If you possess a genuine conviction in Bitcoin’s long-term adoption curve, periods of discomfort and uncertainty are not something to fear; they are something to anticipate and exploit. The deepest value and the best risk-reward proposition always appear when market confidence is at its lowest.
For me, understanding these frameworks has changed the way I engage with Bitcoin. Every drawdown like this one becomes a learning opportunity, every dip a potential asymmetric reward.
We are experiencing a moment of profound structural value, and if there’s one piece of advice I’d give to anyone today, it’s: step back. Look at the big picture. Respect the volatility, but never let it blind you to the underlying trajectory.
Time is your biggest edge. Use it.
I’ll catch you in the next one.
Cheers,
