
ON-CHAIN METRIC
Sharpe Ratio
How much return has Bitcoin delivered above the chosen benchmark for each unit of total volatility?
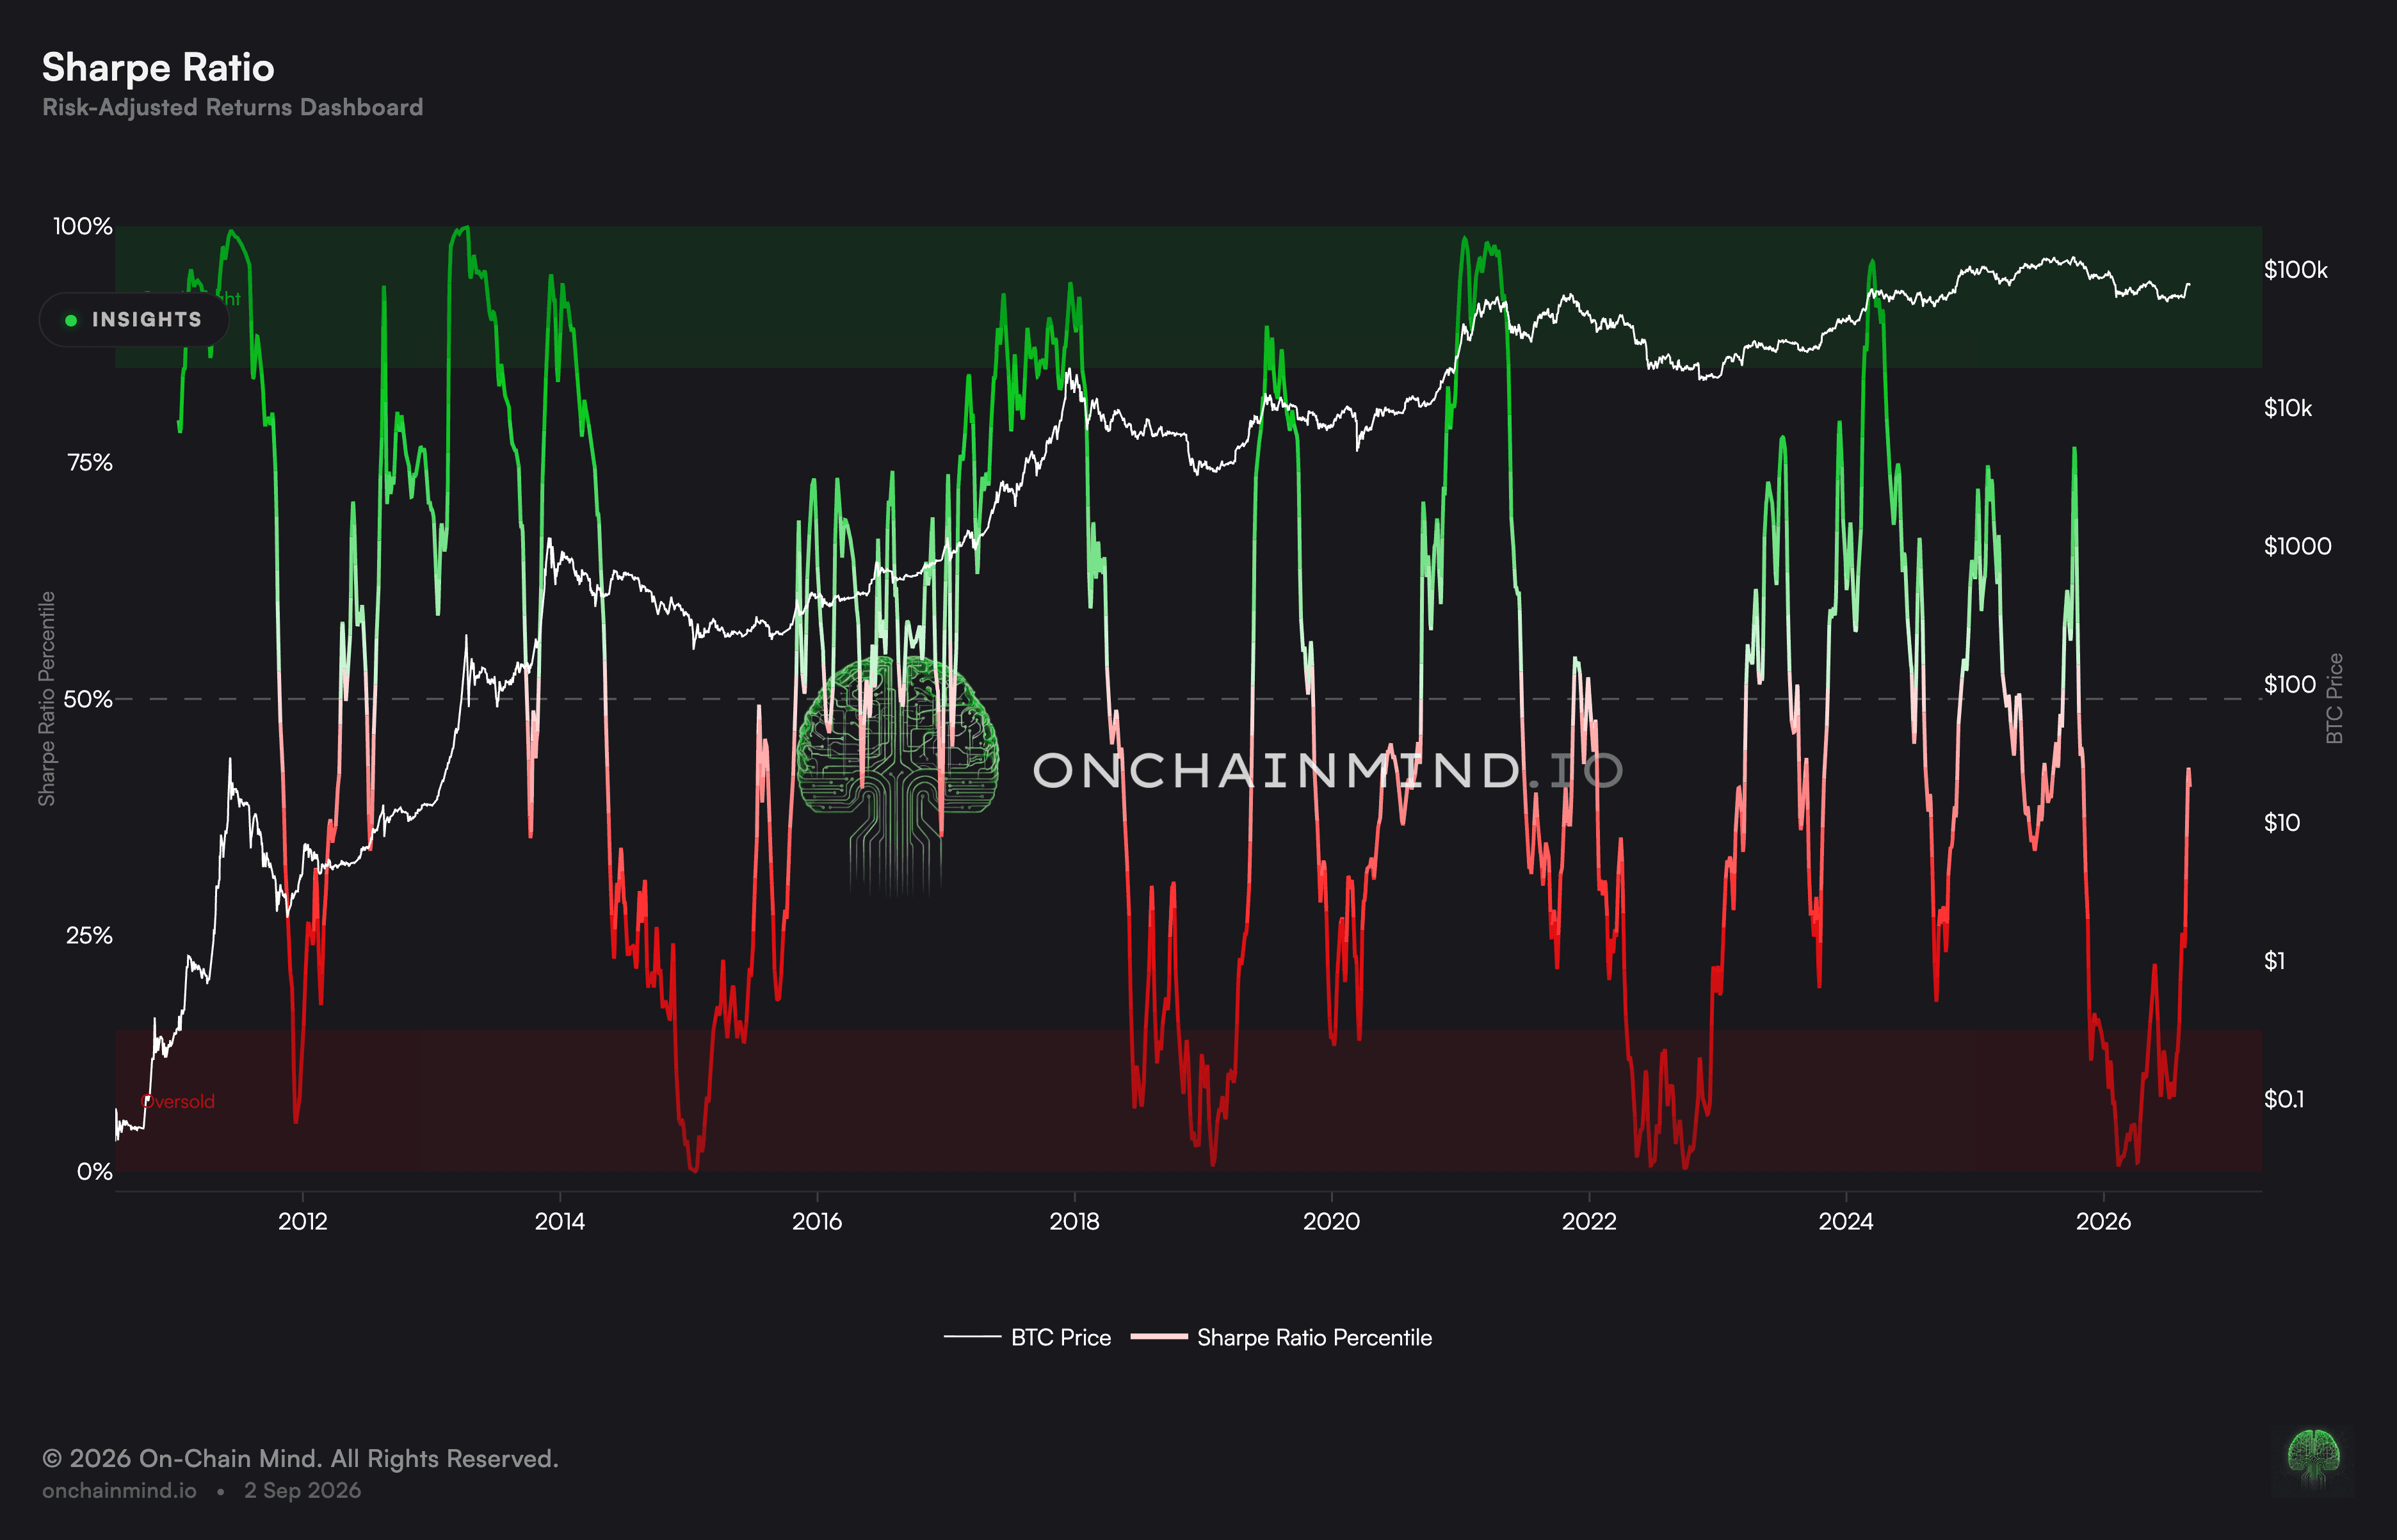
Open the Risk-Adjusted Returns dashboard
The Sharpe Ratio measures excess return per unit of total return volatility. For Bitcoin, it asks whether the return achieved over a chosen window was large enough to justify the variability experienced along the way.
It is a comparison tool, not a standalone verdict. The answer changes with the return frequency, lookback window, risk-free rate, annualisation method and price source used in the calculation.
How the Sharpe Ratio is calculated
Formula. (Average Bitcoin return − matched risk-free return) ÷ standard deviation of Bitcoin returns.
Every input must use the same time basis. A daily calculation needs a daily equivalent risk-free rate; an annualised result then scales return and volatility consistently. Some charts assume a zero risk-free rate, which should be stated rather than hidden.
What the ratio shows
A higher positive reading means Bitcoin delivered more excess return for each unit of total historical volatility inside that sample. A value near zero means the average return was close to the benchmark after scaling for volatility.
A negative reading means the average return fell below the selected risk-free rate or benchmark. It does not mean volatility disappeared; it means the numerator was negative.
What the Sharpe Ratio misses
Standard deviation treats upside and downside variation equally. A large positive move increases measured risk in the same way as a large negative move, even though an investor may not view them as equivalent.
The ratio is sensitive to lookback choice, non-normal returns, outliers and autocorrelation. It also says nothing directly about maximum drawdown, liquidity or the path an investor took to reach the final return.
How to read it
High and positive. Strong excess return relative to total volatility for the stated method and window.
Positive. Return exceeded the benchmark after accounting for measured variability.
Near zero. Little excess return per unit of volatility.
Negative. Average return was below the selected benchmark.
Comparison warning. Only compare ratios built with matching frequencies, windows, benchmarks and annualisation.
The Bitcoin Sharpe Ratio updates inside the Risk-Adjusted Returns dashboard, beside Sortino Ratio, realised volatility and drawdown measures.
Related metrics: Sortino Ratio, Calmar Ratio and Risk of Ruin.
Common questions
What is a good Sharpe Ratio for Bitcoin?
There is no permanent Bitcoin threshold. Compare like-for-like windows and methods, then use the ratio to rank periods or assets rather than declare one universal score good.
Why subtract a risk-free rate?
The numerator is meant to capture return earned for taking risk beyond a lower-risk alternative. A zero-rate assumption changes that question.
Does the ratio measure downside risk?
Not separately. Its denominator includes both positive and negative return variation. Sortino focuses only on returns below a chosen target.
Can a volatile rally have a low Sharpe Ratio?
Yes. If volatility rises faster than excess return, or if the window includes a weak earlier period, the ratio can remain modest.
Why do Sharpe charts disagree?
They may use different sampling frequencies, risk-free rates, windows, return definitions, annualisation factors or price histories.
ON-CHAIN METRIC
Sharpe Ratio
How much return has Bitcoin delivered above the chosen benchmark for each unit of total volatility?
Open the Risk-Adjusted Returns dashboard
The Sharpe Ratio measures excess return per unit of total return volatility. For Bitcoin, it asks whether the return achieved over a chosen window was large enough to justify the variability experienced along the way.
It is a comparison tool, not a standalone verdict. The answer changes with the return frequency, lookback window, risk-free rate, annualisation method and price source used in the calculation.
How the Sharpe Ratio is calculated
Formula. (Average Bitcoin return − matched risk-free return) ÷ standard deviation of Bitcoin returns.
Every input must use the same time basis. A daily calculation needs a daily equivalent risk-free rate; an annualised result then scales return and volatility consistently. Some charts assume a zero risk-free rate, which should be stated rather than hidden.
What the ratio shows
A higher positive reading means Bitcoin delivered more excess return for each unit of total historical volatility inside that sample. A value near zero means the average return was close to the benchmark after scaling for volatility.
A negative reading means the average return fell below the selected risk-free rate or benchmark. It does not mean volatility disappeared; it means the numerator was negative.
What the Sharpe Ratio misses
Standard deviation treats upside and downside variation equally. A large positive move increases measured risk in the same way as a large negative move, even though an investor may not view them as equivalent.
The ratio is sensitive to lookback choice, non-normal returns, outliers and autocorrelation. It also says nothing directly about maximum drawdown, liquidity or the path an investor took to reach the final return.
How to read it
High and positive. Strong excess return relative to total volatility for the stated method and window.
Positive. Return exceeded the benchmark after accounting for measured variability.
Near zero. Little excess return per unit of volatility.
Negative. Average return was below the selected benchmark.
Comparison warning. Only compare ratios built with matching frequencies, windows, benchmarks and annualisation.
The Bitcoin Sharpe Ratio updates inside the Risk-Adjusted Returns dashboard, beside Sortino Ratio, realised volatility and drawdown measures.
Related metrics: Sortino Ratio, Calmar Ratio and Risk of Ruin.
Common questions
What is a good Sharpe Ratio for Bitcoin?
There is no permanent Bitcoin threshold. Compare like-for-like windows and methods, then use the ratio to rank periods or assets rather than declare one universal score good.
Why subtract a risk-free rate?
The numerator is meant to capture return earned for taking risk beyond a lower-risk alternative. A zero-rate assumption changes that question.
Does the ratio measure downside risk?
Not separately. Its denominator includes both positive and negative return variation. Sortino focuses only on returns below a chosen target.
Can a volatile rally have a low Sharpe Ratio?
Yes. If volatility rises faster than excess return, or if the window includes a weak earlier period, the ratio can remain modest.
Why do Sharpe charts disagree?
They may use different sampling frequencies, risk-free rates, windows, return definitions, annualisation factors or price histories.