
ON-CHAIN METRIC
Sortino Ratio
How much return has Bitcoin delivered above a chosen target for each unit of downside deviation?
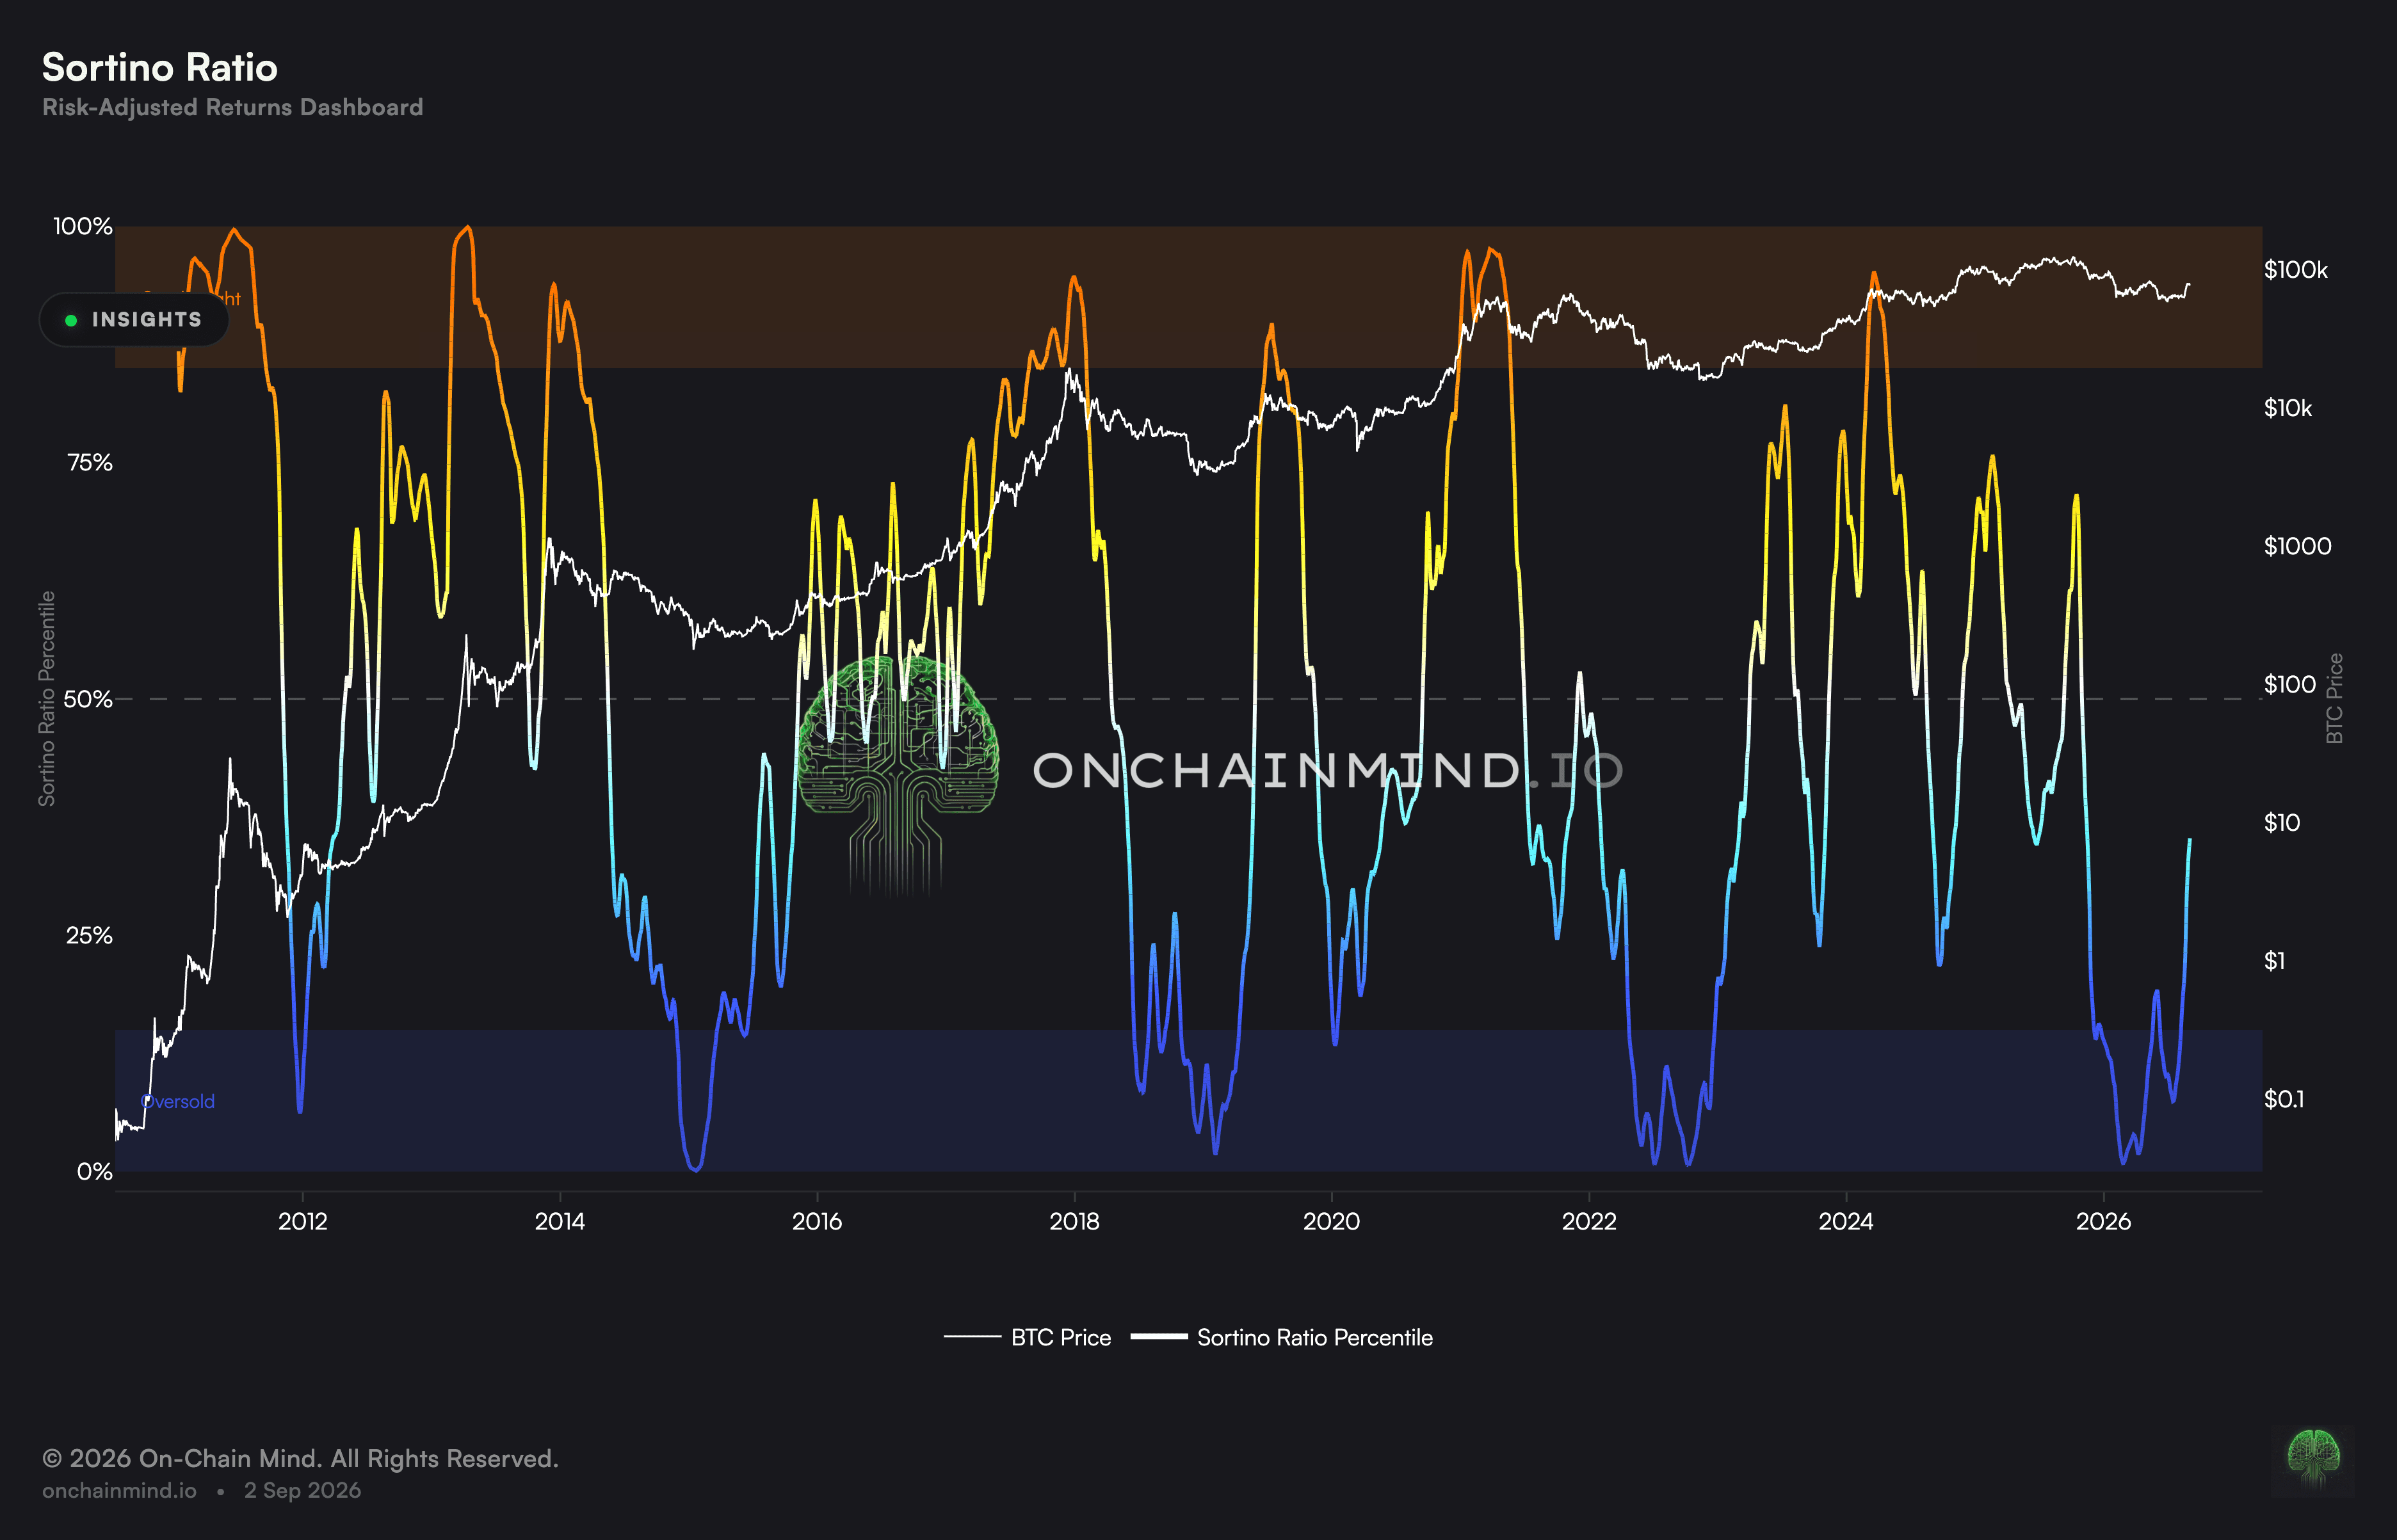
Open the Risk-Adjusted Returns dashboard
The Sortino Ratio measures return above a chosen target for each unit of downside deviation. Unlike Sharpe, it does not penalise returns merely for moving sharply upwards.
That makes it intuitive for an asset with asymmetric returns, but not automatically superior. The result depends heavily on the minimum acceptable return, lookback window, sampling frequency and exact downside-deviation convention.
How the Sortino Ratio is calculated
Formula. (Average Bitcoin return − minimum acceptable return) ÷ downside deviation relative to that target.
The target, often called MAR (minimum acceptable return), might be zero, a risk-free rate or an investor-defined hurdle. Returns and MAR must share the same period. Published methods also differ over whether downside deviation is estimated across all observations or only a subset, and charts differ in which convention they use.
How it differs from Sharpe
Sharpe divides excess return by the standard deviation of all returns. Sortino replaces that denominator with deviation below a selected target, leaving upside variation outside the risk measure.
A strategy can therefore have a stronger Sortino than Sharpe when much of its volatility came from positive moves. The comparison still needs matching dates, return frequency, benchmark and annualisation.
What the ratio does not capture
Downside deviation is not maximum drawdown. A series can show a favourable Sortino while still containing one severe loss, especially if the sample is short or negative observations are rare.
The ratio is historical and can become unstable when the denominator is very small. It also ignores liquidity, recovery time, tail shape and whether the chosen target is appropriate for the investor.
How to read it
High and positive. Strong return above the target relative to measured downside deviation.
Positive. Average return exceeded MAR for the selected period.
Near zero. Little return above the target per unit of downside deviation.
Negative. Average return fell below MAR.
Very large or undefined. Check whether the sample contains too little downside variation for a stable denominator.
The Bitcoin Sortino Ratio updates inside the Risk-Adjusted Returns dashboard, alongside Sharpe Ratio, downside volatility and drawdown measures.
Related metrics: Sharpe Ratio, Calmar Ratio and Risk of Ruin.
Common questions
What does MAR mean?
Minimum acceptable return: the threshold below which outcomes count towards downside deviation. It can be zero, risk-free or investor-defined.
Is Sortino always better than Sharpe?
No. It answers a different question. Sortino focuses on downside relative to MAR; Sharpe measures return against total volatility.
Does a high Sortino mean drawdowns are small?
Not necessarily. Downside deviation averages a pattern of shortfalls and does not report the deepest peak-to-trough loss.
Why can the ratio jump sharply?
A changing numerator, a small number of negative observations or a very low downside-deviation estimate can move the ratio quickly.
How should two Sortino Ratios be compared?
Use the same price history, frequency, lookback, MAR, downside-deviation formula and annualisation. Without that alignment, the ranking can be misleading.
ON-CHAIN METRIC
Sortino Ratio
How much return has Bitcoin delivered above a chosen target for each unit of downside deviation?
Open the Risk-Adjusted Returns dashboard
The Sortino Ratio measures return above a chosen target for each unit of downside deviation. Unlike Sharpe, it does not penalise returns merely for moving sharply upwards.
That makes it intuitive for an asset with asymmetric returns, but not automatically superior. The result depends heavily on the minimum acceptable return, lookback window, sampling frequency and exact downside-deviation convention.
How the Sortino Ratio is calculated
Formula. (Average Bitcoin return − minimum acceptable return) ÷ downside deviation relative to that target.
The target, often called MAR (minimum acceptable return), might be zero, a risk-free rate or an investor-defined hurdle. Returns and MAR must share the same period. Published methods also differ over whether downside deviation is estimated across all observations or only a subset, and charts differ in which convention they use.
How it differs from Sharpe
Sharpe divides excess return by the standard deviation of all returns. Sortino replaces that denominator with deviation below a selected target, leaving upside variation outside the risk measure.
A strategy can therefore have a stronger Sortino than Sharpe when much of its volatility came from positive moves. The comparison still needs matching dates, return frequency, benchmark and annualisation.
What the ratio does not capture
Downside deviation is not maximum drawdown. A series can show a favourable Sortino while still containing one severe loss, especially if the sample is short or negative observations are rare.
The ratio is historical and can become unstable when the denominator is very small. It also ignores liquidity, recovery time, tail shape and whether the chosen target is appropriate for the investor.
How to read it
High and positive. Strong return above the target relative to measured downside deviation.
Positive. Average return exceeded MAR for the selected period.
Near zero. Little return above the target per unit of downside deviation.
Negative. Average return fell below MAR.
Very large or undefined. Check whether the sample contains too little downside variation for a stable denominator.
The Bitcoin Sortino Ratio updates inside the Risk-Adjusted Returns dashboard, alongside Sharpe Ratio, downside volatility and drawdown measures.
Related metrics: Sharpe Ratio, Calmar Ratio and Risk of Ruin.
Common questions
What does MAR mean?
Minimum acceptable return: the threshold below which outcomes count towards downside deviation. It can be zero, risk-free or investor-defined.
Is Sortino always better than Sharpe?
No. It answers a different question. Sortino focuses on downside relative to MAR; Sharpe measures return against total volatility.
Does a high Sortino mean drawdowns are small?
Not necessarily. Downside deviation averages a pattern of shortfalls and does not report the deepest peak-to-trough loss.
Why can the ratio jump sharply?
A changing numerator, a small number of negative observations or a very low downside-deviation estimate can move the ratio quickly.
How should two Sortino Ratios be compared?
Use the same price history, frequency, lookback, MAR, downside-deviation formula and annualisation. Without that alignment, the ranking can be misleading.