

ON-CHAIN METRIC
STH MVRV
Where the twitchiest money in the market stands against a very recent purchase price.
Open the Profit & Loss dashboard
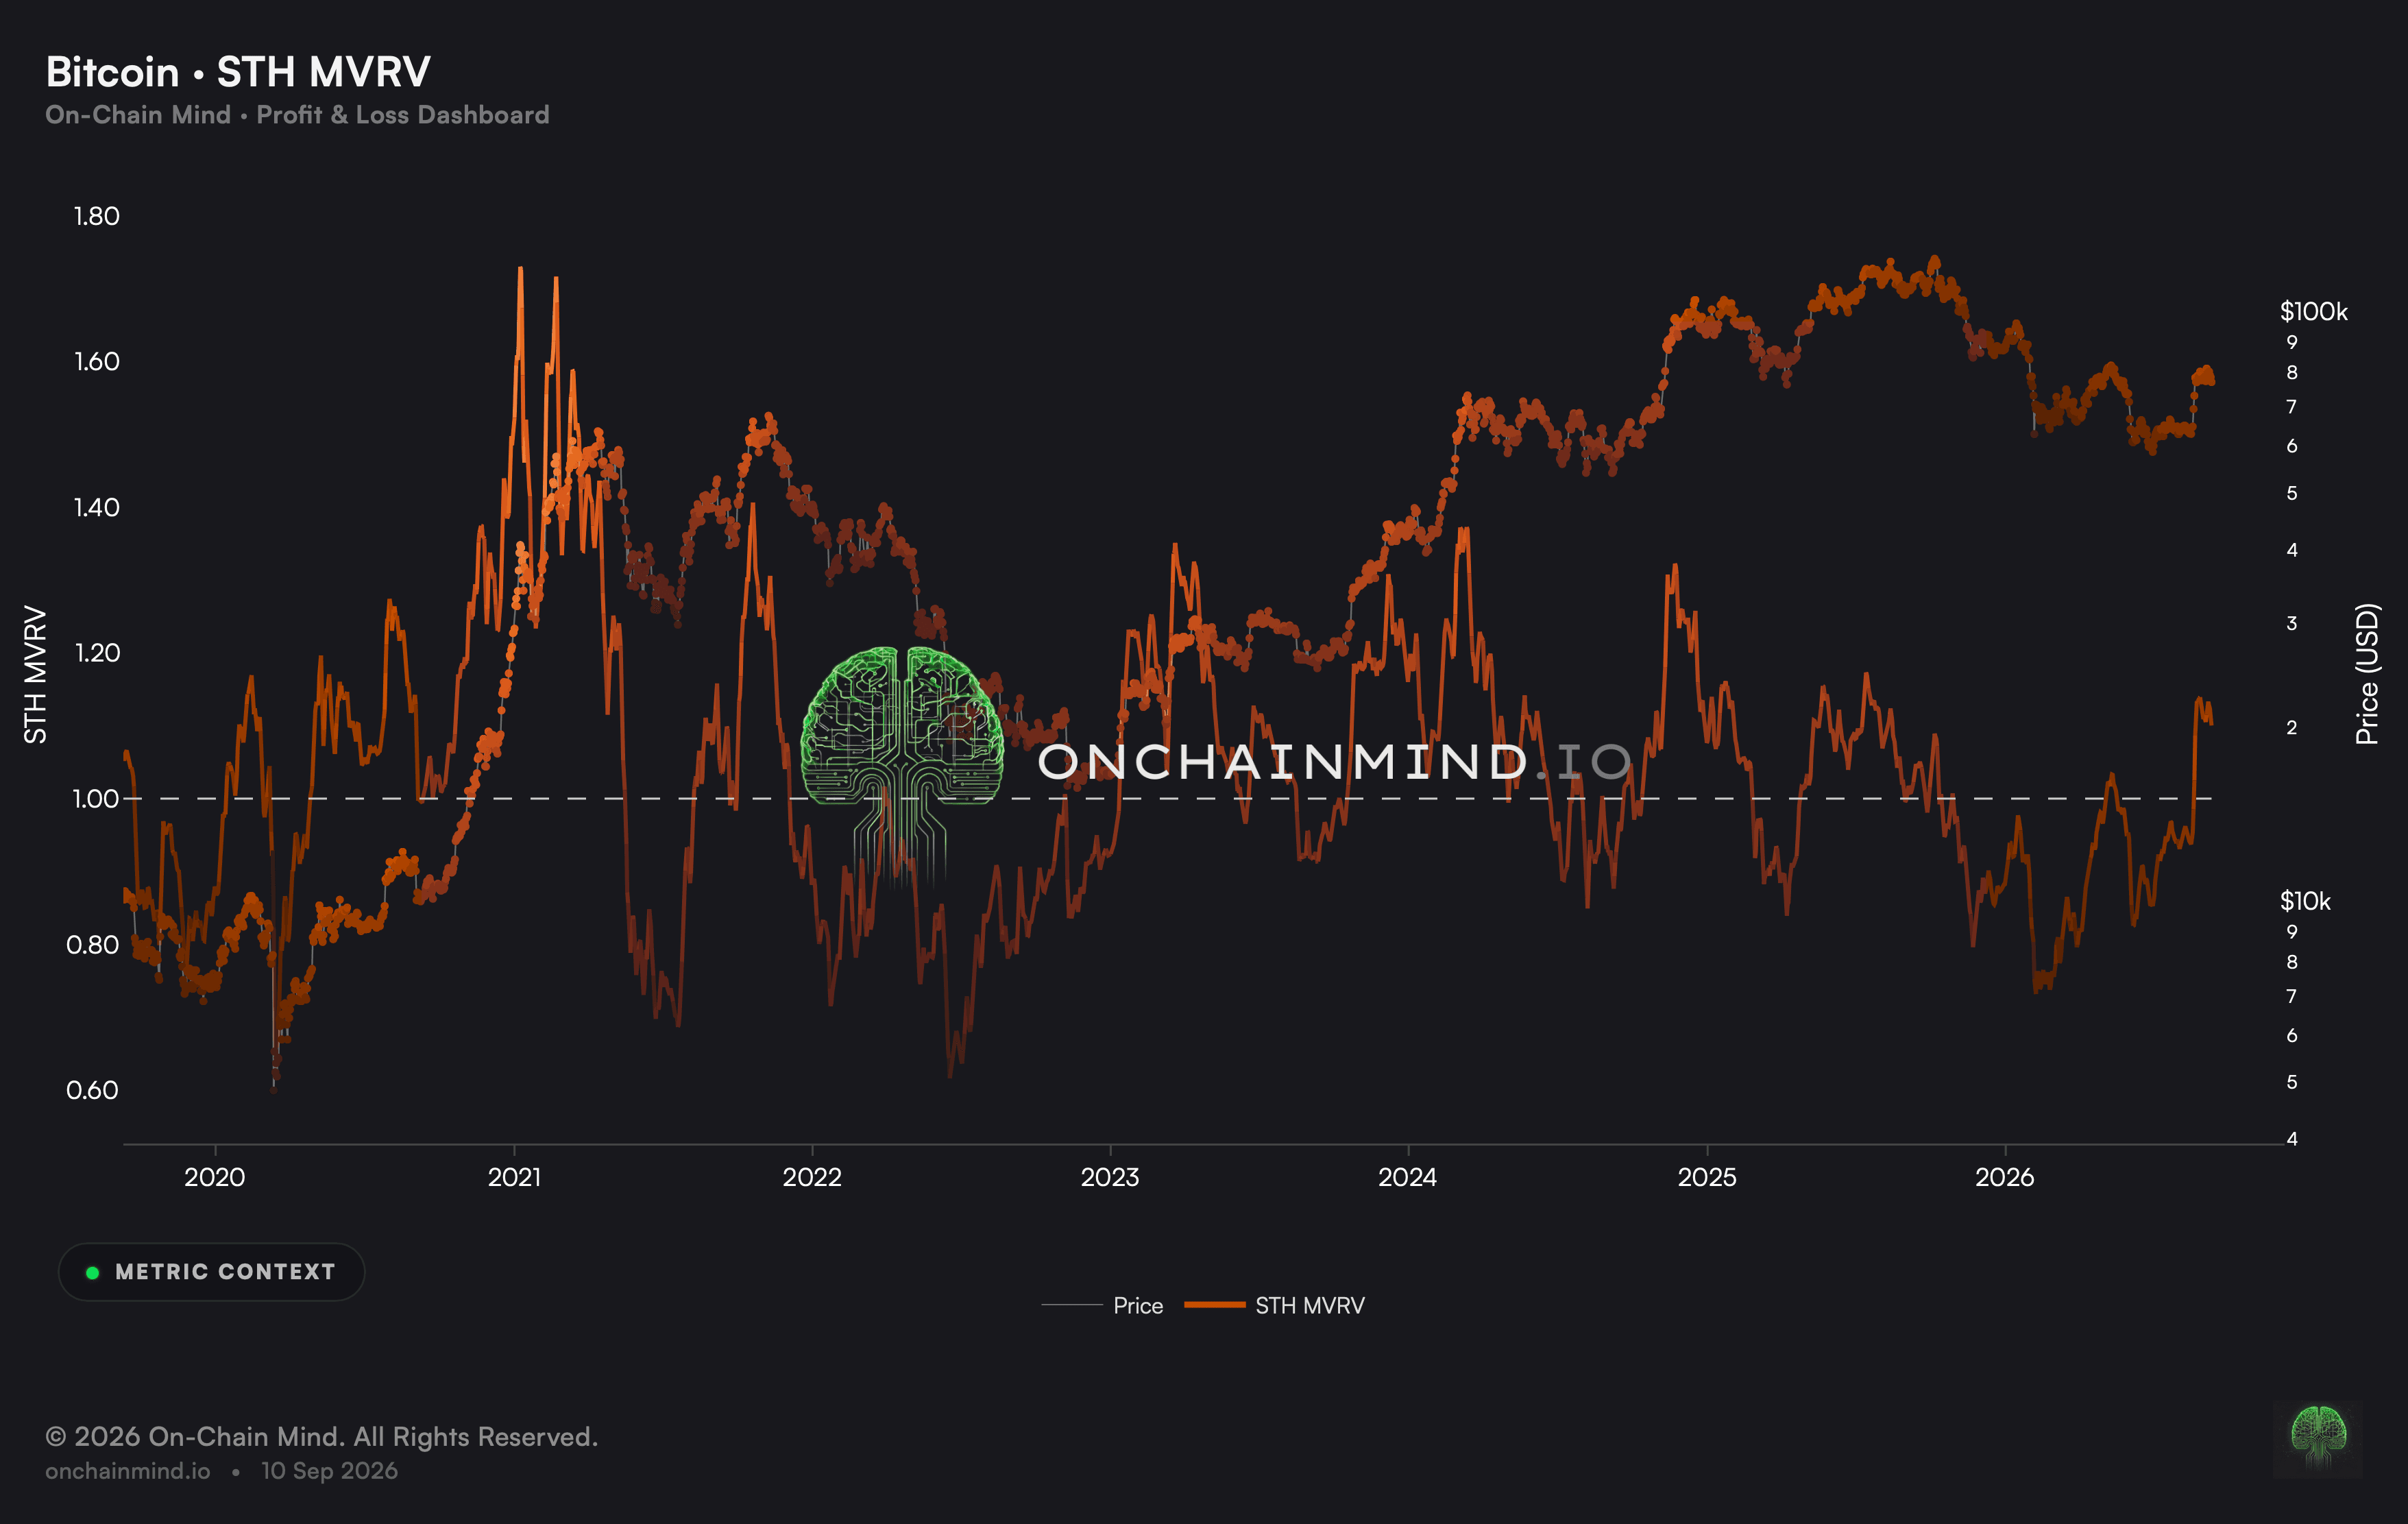
This narrows Market Value to Realised Value to coin bought recently, which reports how far the Short-Term Holder cohort sits from what it handed over. Their purchase price is close to the current one, so ordinary movement is enough to flip them between comfort and discomfort.
That sensitivity makes this the first of the family to turn. Long before any longer-dated measure registers anything, the newest money has already changed position.
What it actually measures
Break-even is the level worth watching. Recent buyers collectively sitting at what they paid marks a place advances have repeatedly defended and declines have repeatedly failed at, so crossings of it inform more than the distance on either side.
This group going behind while the market as a whole has not is the standard shape of a correction. Newcomers absorb the discomfort, the seasoned base stays untroubled, and the market wobbles without anything giving way.
The speed cuts both ways. Recovering as fast as it fell means this figure can be back at comfort within weeks of a scare, which is useful for reading the present and poor for reading a cycle.
The most reactive money is the most informative money
There is a temptation to dismiss recent buyers as the least serious participants, and in terms of conviction that is fair. In terms of what happens next it has the argument exactly backwards.
Supply arrives from whoever is likeliest to act, and that is invariably the group with least attached to their position. A cohort that has held for a fortnight parts with coin far sooner than one that has held for five years, which makes their comfort the thing worth monitoring rather than the seasoned cohort’s.
STH MVRV Z-Score: leading the other cohorts is not leading the market
It earns its place at the bottom edge. Newcomers underwater by a margin they rarely reach have turned up at ordinary washouts and not merely at the floor of a cycle, which makes such figures a good deal commoner than the seasoned cohort’s equivalents.
It is tempting to treat the fastest indicator in a family as the early warning for everything else, on the assumption that what reaches one group first will reach the rest shortly.
Frequently it does not. The newest buyers routinely reach uncomfortable positions that go no further, because the discomfort resolves before it can spread. What this reports is that the most reactive money has moved, which is a genuine fact and a much smaller claim than a forecast.
What it does not tell you
Speed brings noise with it. This figure crosses its important level frequently, and most of those crossings resolve back within days without leading anywhere.
Where the cohort begins and ends is a convention. Coin ages across the boundary continuously, so the group is being replaced even during stretches when nothing at all is traded.
Being behind makes selling likelier without making it happen. Plenty of recent buyers have sat through positions considerably worse than this figure suggests they would tolerate.
How to read it
Euphoria. Recent buyers are further ahead than this fast-moving cohort has ever managed to be.
Elevated. Newcomers are comfortably ahead of what they paid a few weeks ago.
Fair. Recent buyers sit at roughly what they handed over, the level advances defend and declines fail at.
Discount. Newcomers have gone behind, which is the usual shape of a correction inside an advance.
Deep value. Recent buyers are behind by an unusual margin, which has accompanied local capitulations.
The Profit & Loss dashboard puts STH MVRV next to Unrealised Loss, Loss Ribbons and Profit-Pain Frontier.
Common questions
Why does this one move before the others?
Because recent buyers hold a purchase price close to the current one, so ordinary movement flips them between comfort and discomfort. It turns long before any longer-dated measure does.
What makes break-even the level to watch?
Because it is where this group collectively sits at what it paid, and it is a place advances have repeatedly defended and declines have repeatedly failed at. Crossings matter more than distance.
Can this be behind while the market is not?
Routinely, and it is easily the commonest arrangement in a correction. Newcomers absorb the discomfort while the seasoned base stays untroubled, which is a wobble rather than a break.
How much noise is in this line?
Considerably. The important level gets crossed often and most of those crossings resolve back within days, so a single one settles nothing on its own.
Why watch the least committed group?
Because supply arrives from whoever is likeliest to act, and that is invariably the group with least attached to their position. A holder of a fortnight parts with coin far sooner than one of five years.
Why not simply read the underlying figure?
Because this cohort sits close to break-even nearly the whole time, so the difference between an unremarkable week and a punishing one is small in absolute terms and easily overlooked.
Are frequent extremes less meaningful?
Individually, yes. Because this group reaches unusual positions often, any single occurrence carries less weight than the same reading would in a slower measure.
ON-CHAIN METRIC
STH MVRV
Where the twitchiest money in the market stands against a very recent purchase price.
Open the Profit & Loss dashboard
This narrows Market Value to Realised Value to coin bought recently, which reports how far the Short-Term Holder cohort sits from what it handed over. Their purchase price is close to the current one, so ordinary movement is enough to flip them between comfort and discomfort.
That sensitivity makes this the first of the family to turn. Long before any longer-dated measure registers anything, the newest money has already changed position.
What it actually measures
Break-even is the level worth watching. Recent buyers collectively sitting at what they paid marks a place advances have repeatedly defended and declines have repeatedly failed at, so crossings of it inform more than the distance on either side.
This group going behind while the market as a whole has not is the standard shape of a correction. Newcomers absorb the discomfort, the seasoned base stays untroubled, and the market wobbles without anything giving way.
The speed cuts both ways. Recovering as fast as it fell means this figure can be back at comfort within weeks of a scare, which is useful for reading the present and poor for reading a cycle.
The most reactive money is the most informative money
There is a temptation to dismiss recent buyers as the least serious participants, and in terms of conviction that is fair. In terms of what happens next it has the argument exactly backwards.
Supply arrives from whoever is likeliest to act, and that is invariably the group with least attached to their position. A cohort that has held for a fortnight parts with coin far sooner than one that has held for five years, which makes their comfort the thing worth monitoring rather than the seasoned cohort’s.
STH MVRV Z-Score: leading the other cohorts is not leading the market
It earns its place at the bottom edge. Newcomers underwater by a margin they rarely reach have turned up at ordinary washouts and not merely at the floor of a cycle, which makes such figures a good deal commoner than the seasoned cohort’s equivalents.
It is tempting to treat the fastest indicator in a family as the early warning for everything else, on the assumption that what reaches one group first will reach the rest shortly.
Frequently it does not. The newest buyers routinely reach uncomfortable positions that go no further, because the discomfort resolves before it can spread. What this reports is that the most reactive money has moved, which is a genuine fact and a much smaller claim than a forecast.
What it does not tell you
Speed brings noise with it. This figure crosses its important level frequently, and most of those crossings resolve back within days without leading anywhere.
Where the cohort begins and ends is a convention. Coin ages across the boundary continuously, so the group is being replaced even during stretches when nothing at all is traded.
Being behind makes selling likelier without making it happen. Plenty of recent buyers have sat through positions considerably worse than this figure suggests they would tolerate.
How to read it
Euphoria. Recent buyers are further ahead than this fast-moving cohort has ever managed to be.
Elevated. Newcomers are comfortably ahead of what they paid a few weeks ago.
Fair. Recent buyers sit at roughly what they handed over, the level advances defend and declines fail at.
Discount. Newcomers have gone behind, which is the usual shape of a correction inside an advance.
Deep value. Recent buyers are behind by an unusual margin, which has accompanied local capitulations.
The Profit & Loss dashboard puts STH MVRV next to Unrealised Loss, Loss Ribbons and Profit-Pain Frontier.
Common questions
Why does this one move before the others?
Because recent buyers hold a purchase price close to the current one, so ordinary movement flips them between comfort and discomfort. It turns long before any longer-dated measure does.
What makes break-even the level to watch?
Because it is where this group collectively sits at what it paid, and it is a place advances have repeatedly defended and declines have repeatedly failed at. Crossings matter more than distance.
Can this be behind while the market is not?
Routinely, and it is easily the commonest arrangement in a correction. Newcomers absorb the discomfort while the seasoned base stays untroubled, which is a wobble rather than a break.
How much noise is in this line?
Considerably. The important level gets crossed often and most of those crossings resolve back within days, so a single one settles nothing on its own.
Why watch the least committed group?
Because supply arrives from whoever is likeliest to act, and that is invariably the group with least attached to their position. A holder of a fortnight parts with coin far sooner than one of five years.
Why not simply read the underlying figure?
Because this cohort sits close to break-even nearly the whole time, so the difference between an unremarkable week and a punishing one is small in absolute terms and easily overlooked.
Are frequent extremes less meaningful?
Individually, yes. Because this group reaches unusual positions often, any single occurrence carries less weight than the same reading would in a slower measure.