

The most famous metric in on-chain analysis has been breaking for a while now, and the version that still works is the one people ignore.
MVRV gets wheeled out at every cycle top and again at every capitulation low, usually by the same accounts, usually with the same screenshot. It is the single most quoted on-chain number in Bitcoin. It is also, in my view, one of the most misunderstood.
Part of that is because the metric genuinely has changed beneath our feet. Part of it is because a myth about the Z-Score has been repeated so many times that almost nobody checks the maths anymore.
So let me take you through what MVRV actually measures, why the raw number has stopped telling us what it used to, and the one cohort version that I do not expect to break in my lifetime as an analyst.
Let's get into it.
Key insights
Diminishing Peaks Are Structural: Every cycle prints a lower MVRV top, which quietly destroys absolute threshold analysis.
The Z-Score Myth: It is not a Z-Score of MVRV. It standardises a dollar gap by market cap volatility.
Percentiles Over Absolutes: Measuring profitability relative to Bitcoin's own history rather than an arbitrary number holds up as volatility continues to dampen.
Short-Term Holder MVRV Endures: The cohort refreshes every 155 days , keeping the break-even line brutally reliable.
The Number Behind The Number
MVRV stands for Market Value to Realised Value, and the calculation is very simple. Take Bitcoin's market cap and divide it by its Realised Cap. Every derivative of this metric, and there are many, is built on that one division.
The market cap half is the bit you already know. Price multiplied by circulating supply, currently valuing every single coin at roughly $77K regardless of whether it last moved this morning or in 2011.
Which is exactly the problem, because the overwhelming majority of coins did not change hands anywhere near $77K.
The Realised Cap is the clever half. It walks through every UTXO on the chain, values each one at the price it last moved on-chain, and sums the lot. A coin that last transacted at $300 counts as $300. A coin moved today counts at spot.
What you end up with is an aggregate cost basis for the entire network. I prefer to think of it as the total capital genuinely committed to Bitcoin, and right now that figure sits just above $1 trillion. Market cap is a vanity number. The Realised Cap is what the market has actually paid.
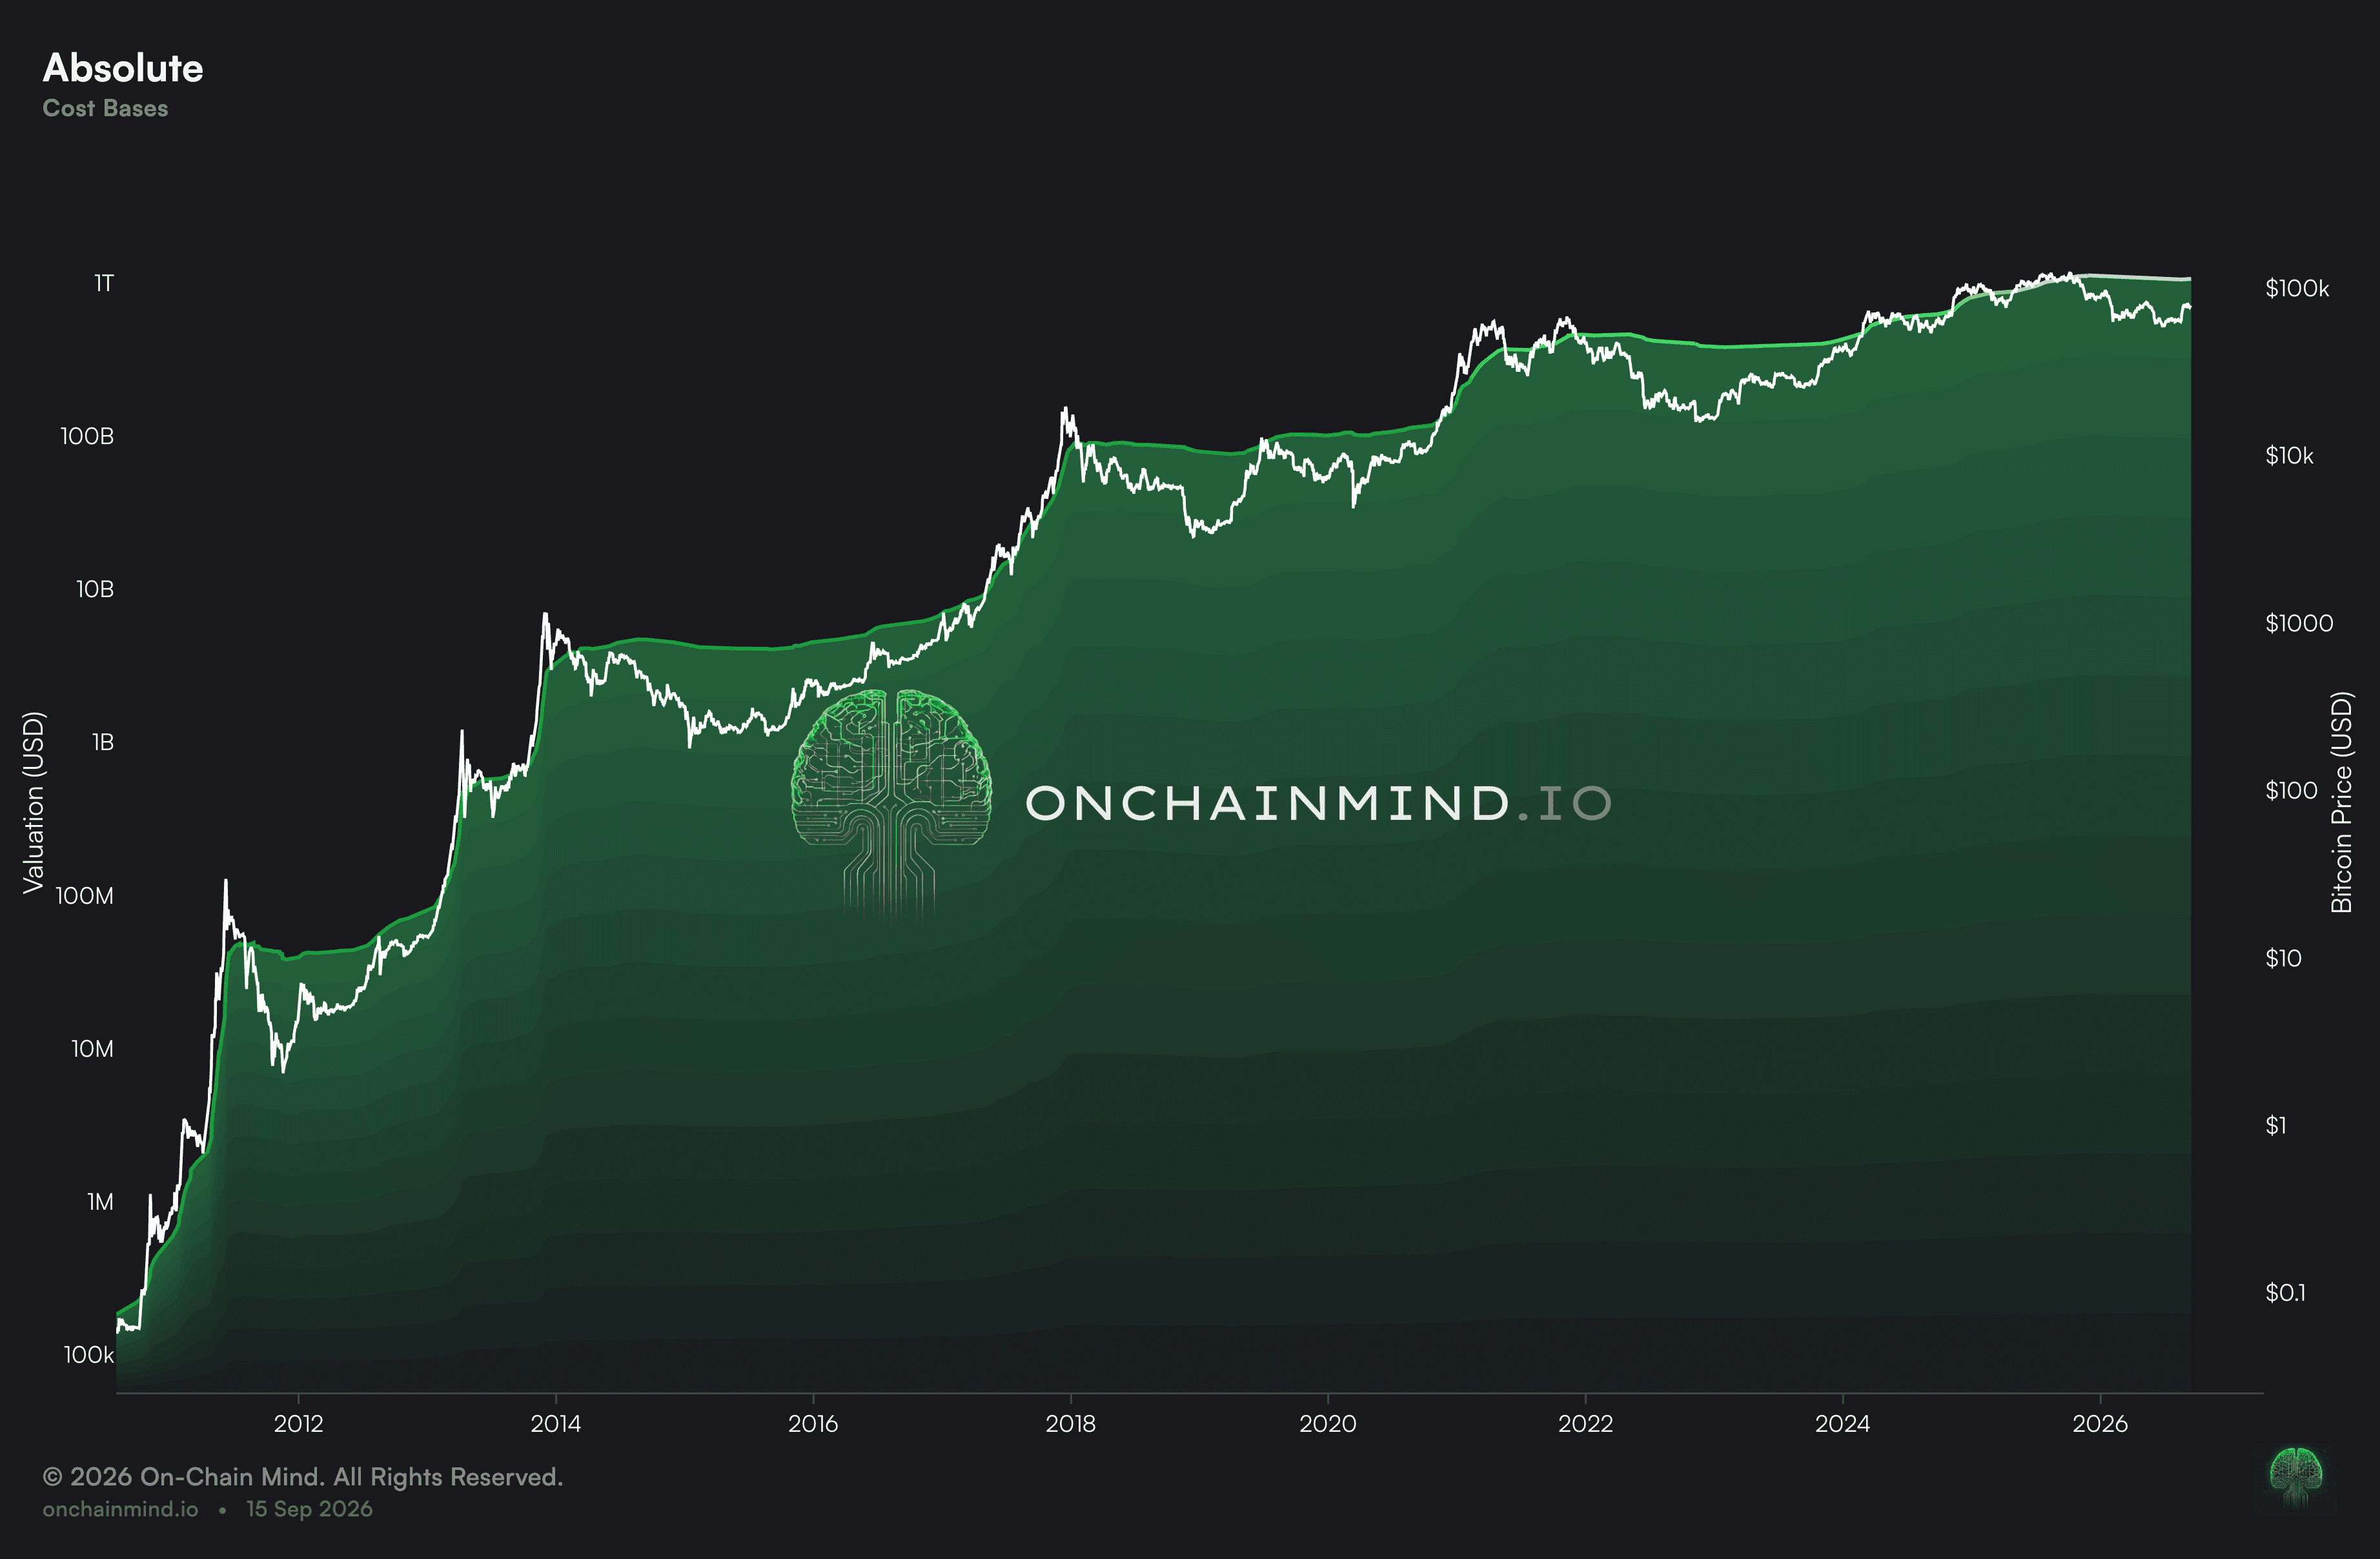
View live in OCM Studio: Realised Cap
So when MVRV reads 1, the average holder is exactly break-even. At 3, the average coin is worth triple what it last moved for. Below 1, the average holder is underwater.
The intuition to keep is this: MVRV is not a price metric at all, it is a measure of aggregate unrealised profit and loss, and unrealised profit is the fuel for nearly every selling wave this asset has ever produced.
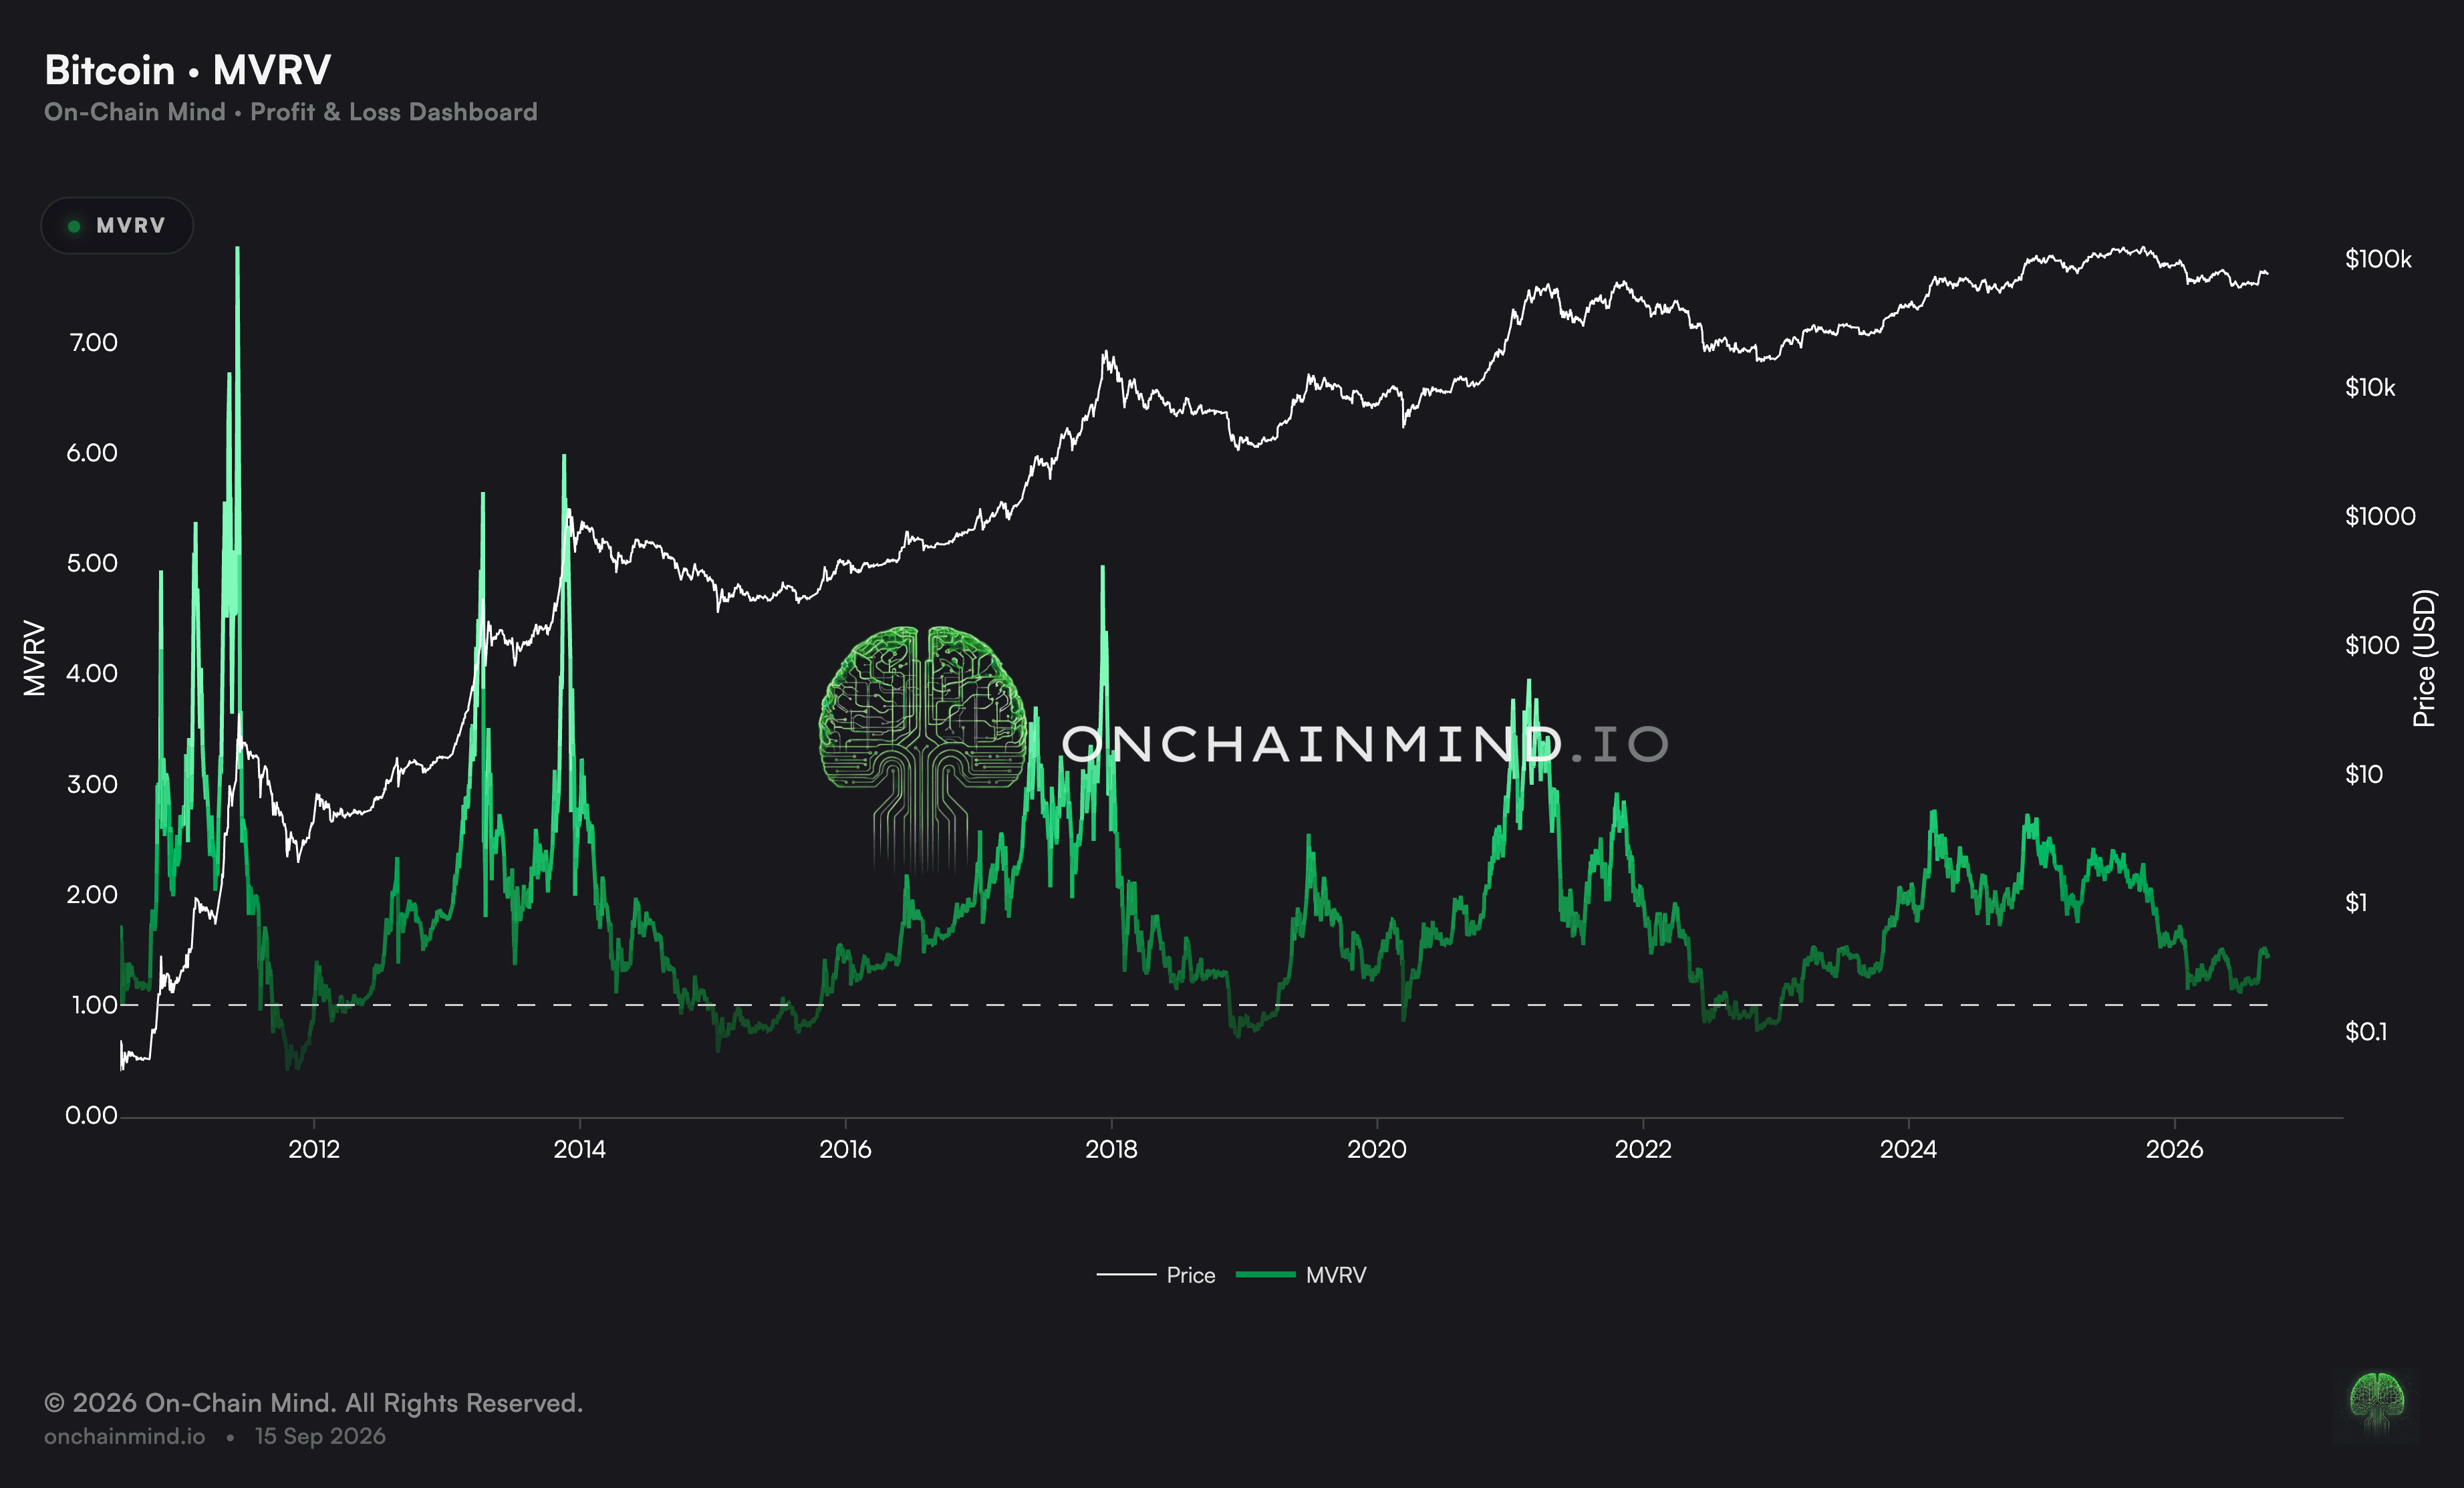
View live in OCM Studio: Raw MVRV
Why The Absolute Number Has Stopped Working
Here is where the classic reading falls down. Bitcoin's raw MVRV peaks have been shrinking, cycle after cycle, without exception.
The 2011 readings were absurd, running clean off the top of the chart. 2013 and 2014 were enormous. 2017 came in lower but still parabolic. 2021 was euphoric and lower again. This cycle barely nudged over 2.5.
It is a larger, deeper, more institutionally held asset simply refusing to stretch as far above its own cost basis as it once did.
And the downside behaved just as differently. We never dipped below 1 during the most recent bear market, the first time in Bitcoin's history that has happened. Even at the worst of the drawdown, price never fell beneath what the average holder paid. I expect that to keep holding true going forward.
A Quick Myth
The most popular variant of MVRV is no doubt the MVRV Z-Score.
Now most people assume the MVRV Z-Score is a standard Z-Score applied to the MVRV ratio, taking the average reading and how much it typically swings, then standardising. That does make sense, but it is actually not how it works.
What it actually does is subtract Realised Cap from market cap, leaving a raw dollar gap, then divide that gap by the standard deviation of the market cap itself. A dollar gap adjusted for how much market cap normally moves, not a ratio adjusted for how much the ratio moves.
It was designed that way to tame the distortions of Bitcoin's early years, and it does that job well. But it inherits the same disease. The swings have compressed exactly as the raw version has, which means the most quoted chart in the space has quietly stopped being the most useful one.
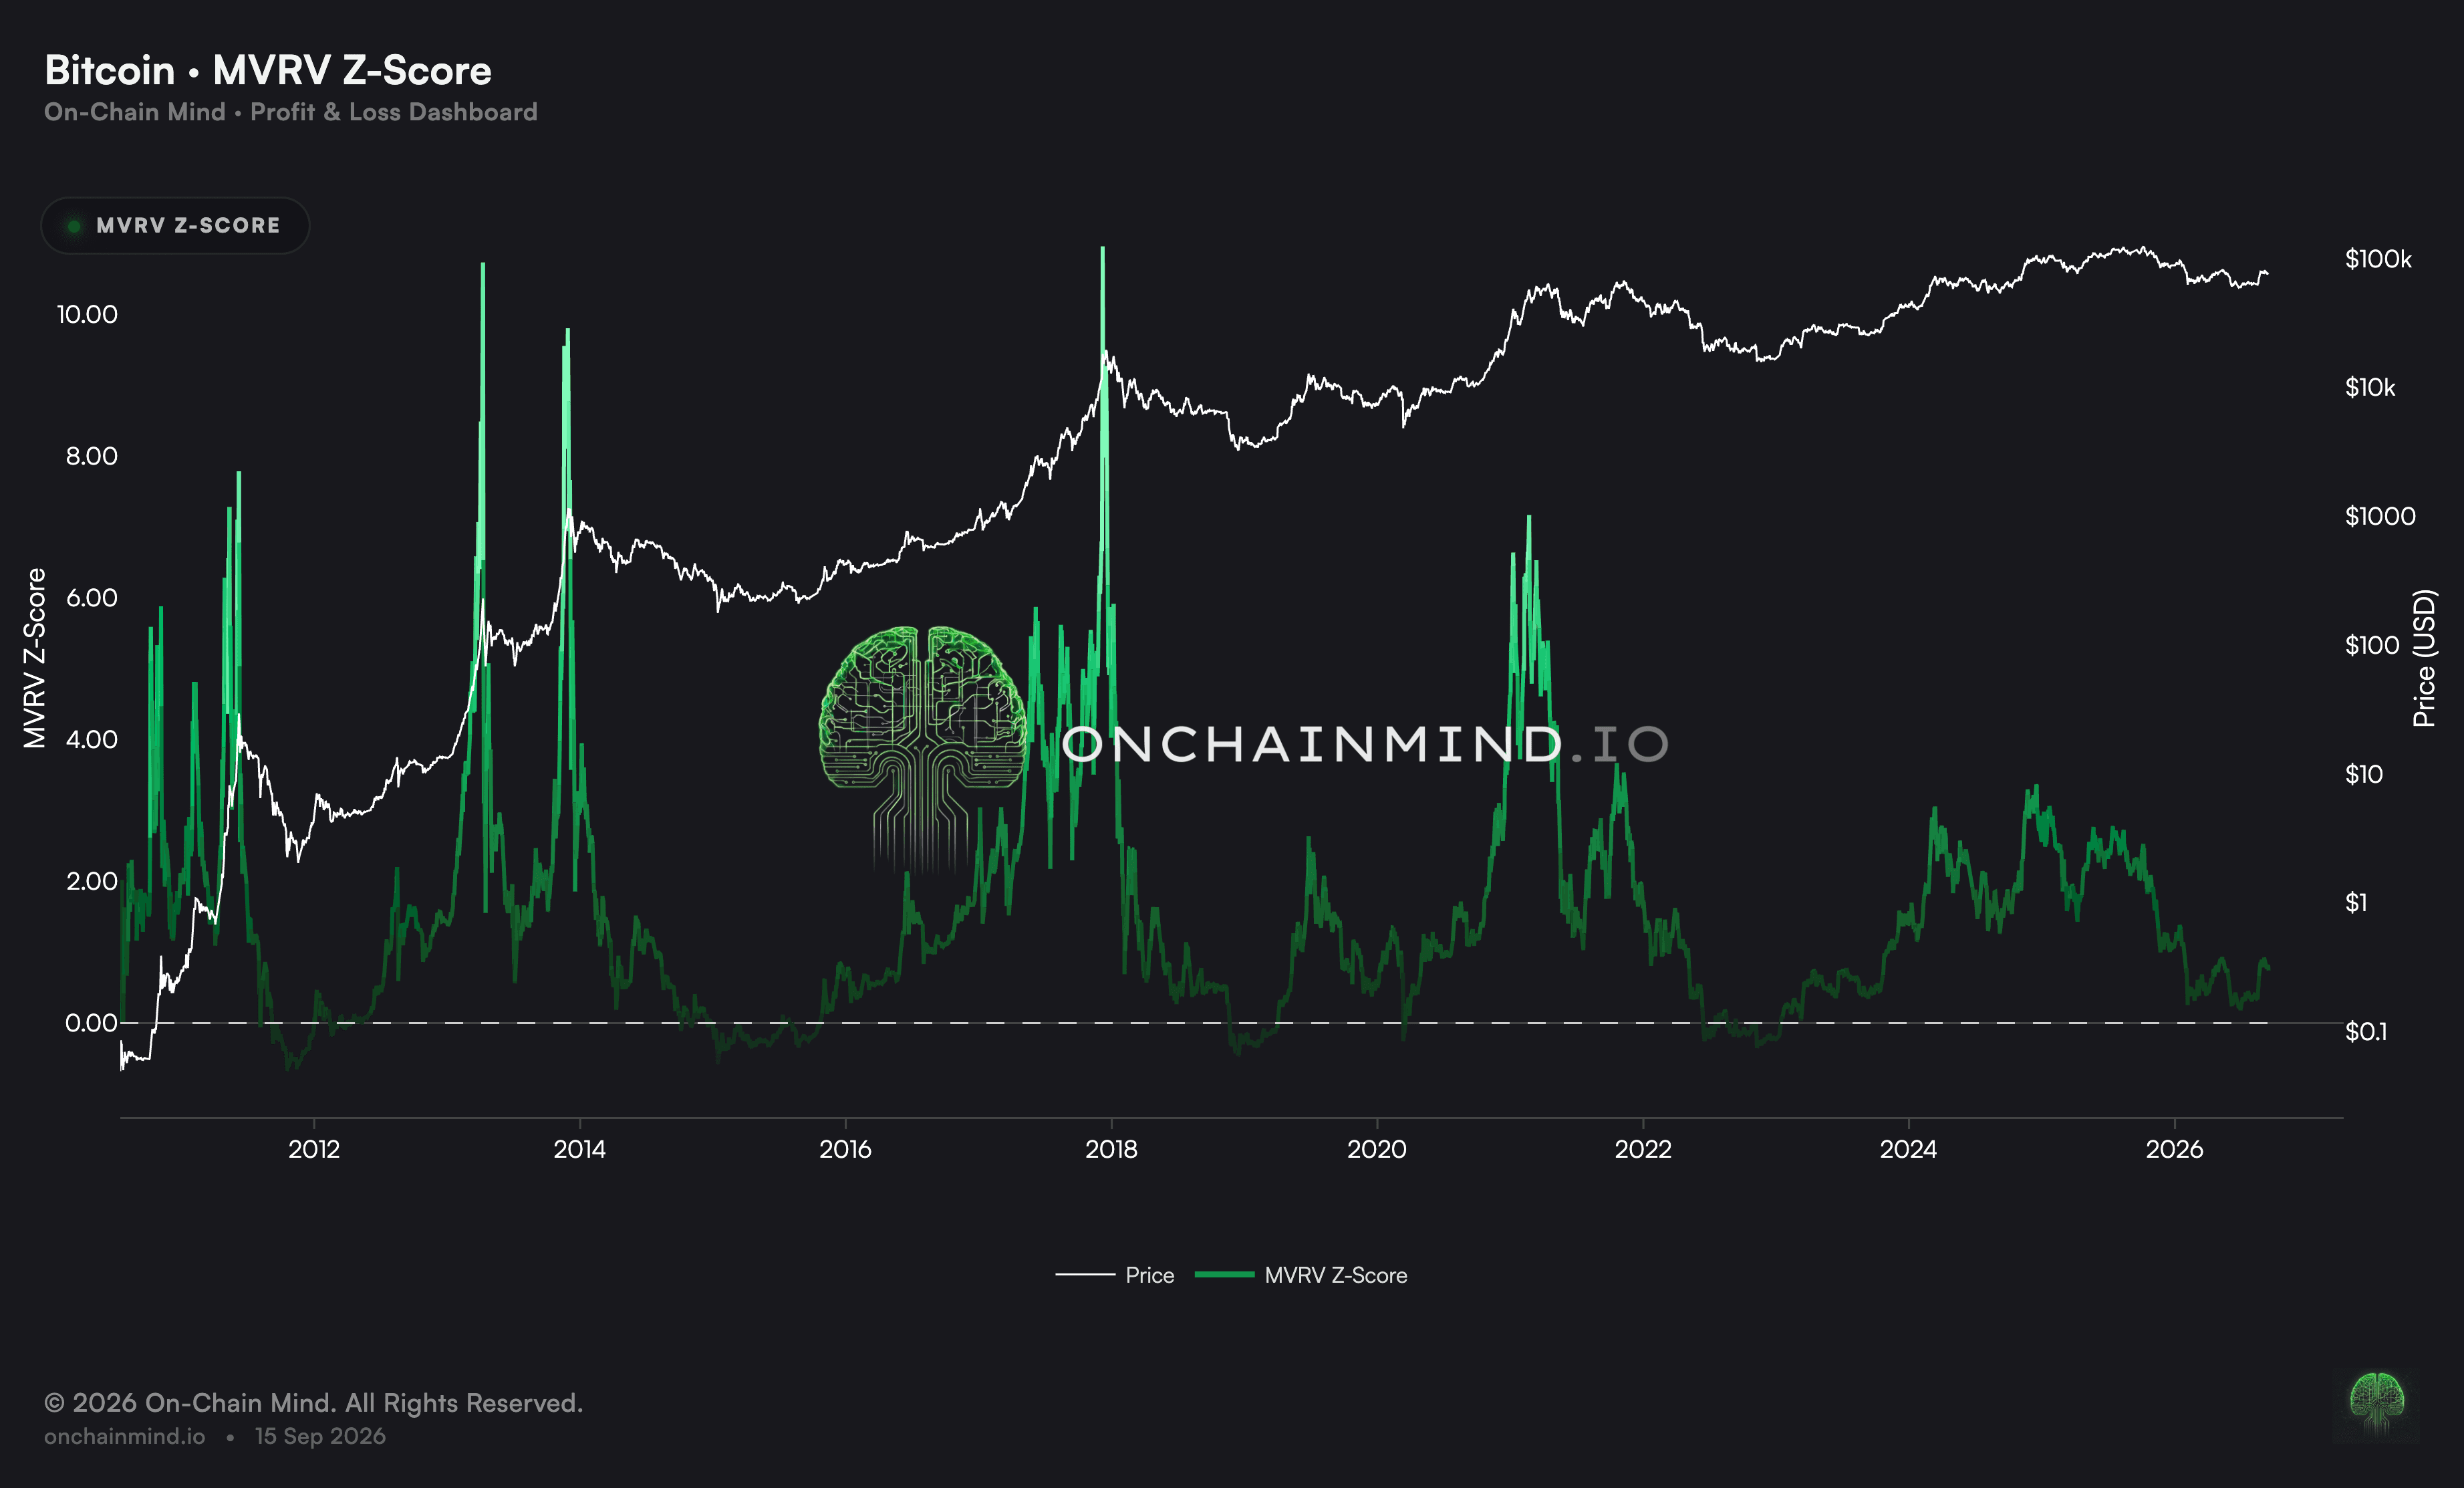
View live in OCM Studio: MVRV Z-Score
Three Ways To Rescue The Metric
If absolute thresholds are decaying, then the fix is to stop asking what the number is and start asking where it ranks.
That is the percentile view, and I really don't know of too many other places that this chart exists. It is the most underused MVRV variant, but it is quietly becoming my favourite.
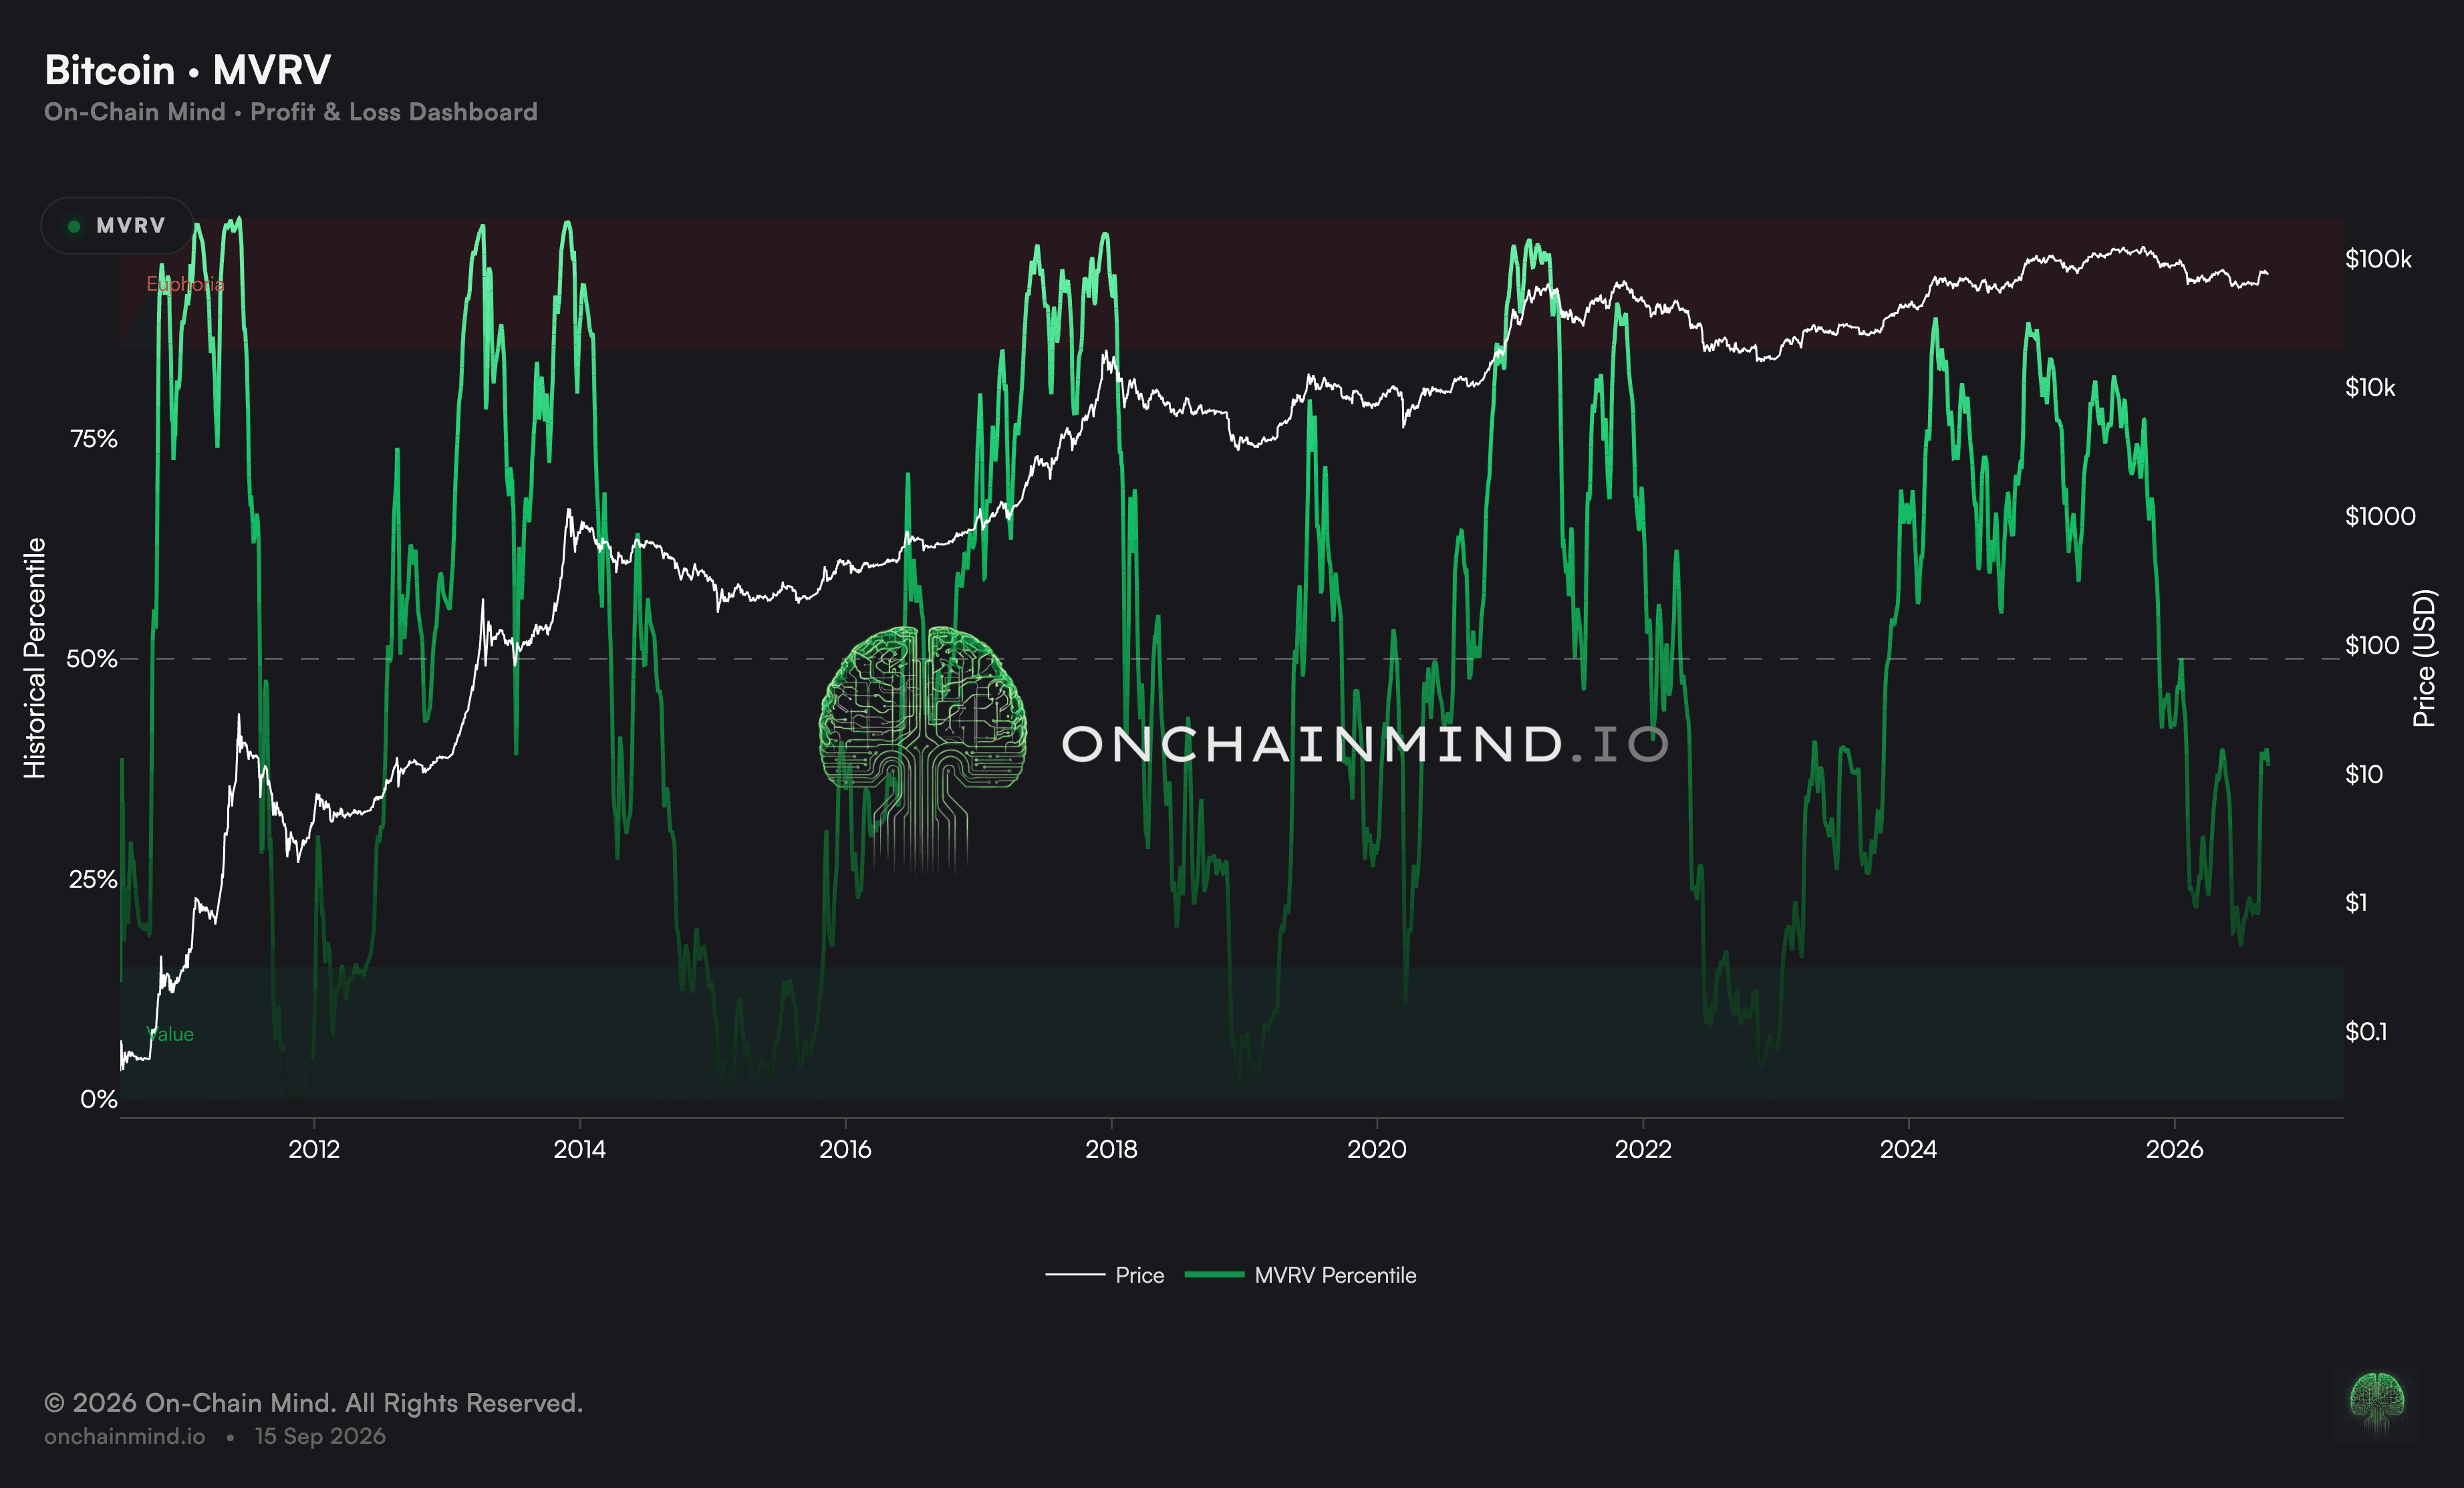
View live in OCM Studio: MVRV Percentile
Instead of measuring in absolute levels, like the raw MVRV and Z-Score, it asks what percentage of Bitcoin's entire history has seen a lower MVRV than today. A 95th percentile reading means the metric has only been hotter 5% of the time, ever.
Do you see why that matters so much more than the raw print? Because a percentile is dimensionless. It does not care that tops keep coming in lower, it rescales itself to the asset's own evolving history automatically.
A 90th percentile in 2013 and a 90th percentile now mean roughly the same thing, which is that the market's unrealised profitability is about as stretched as it ever gets relative to itself. The raw number cannot give you that comparison, but the percentile can.
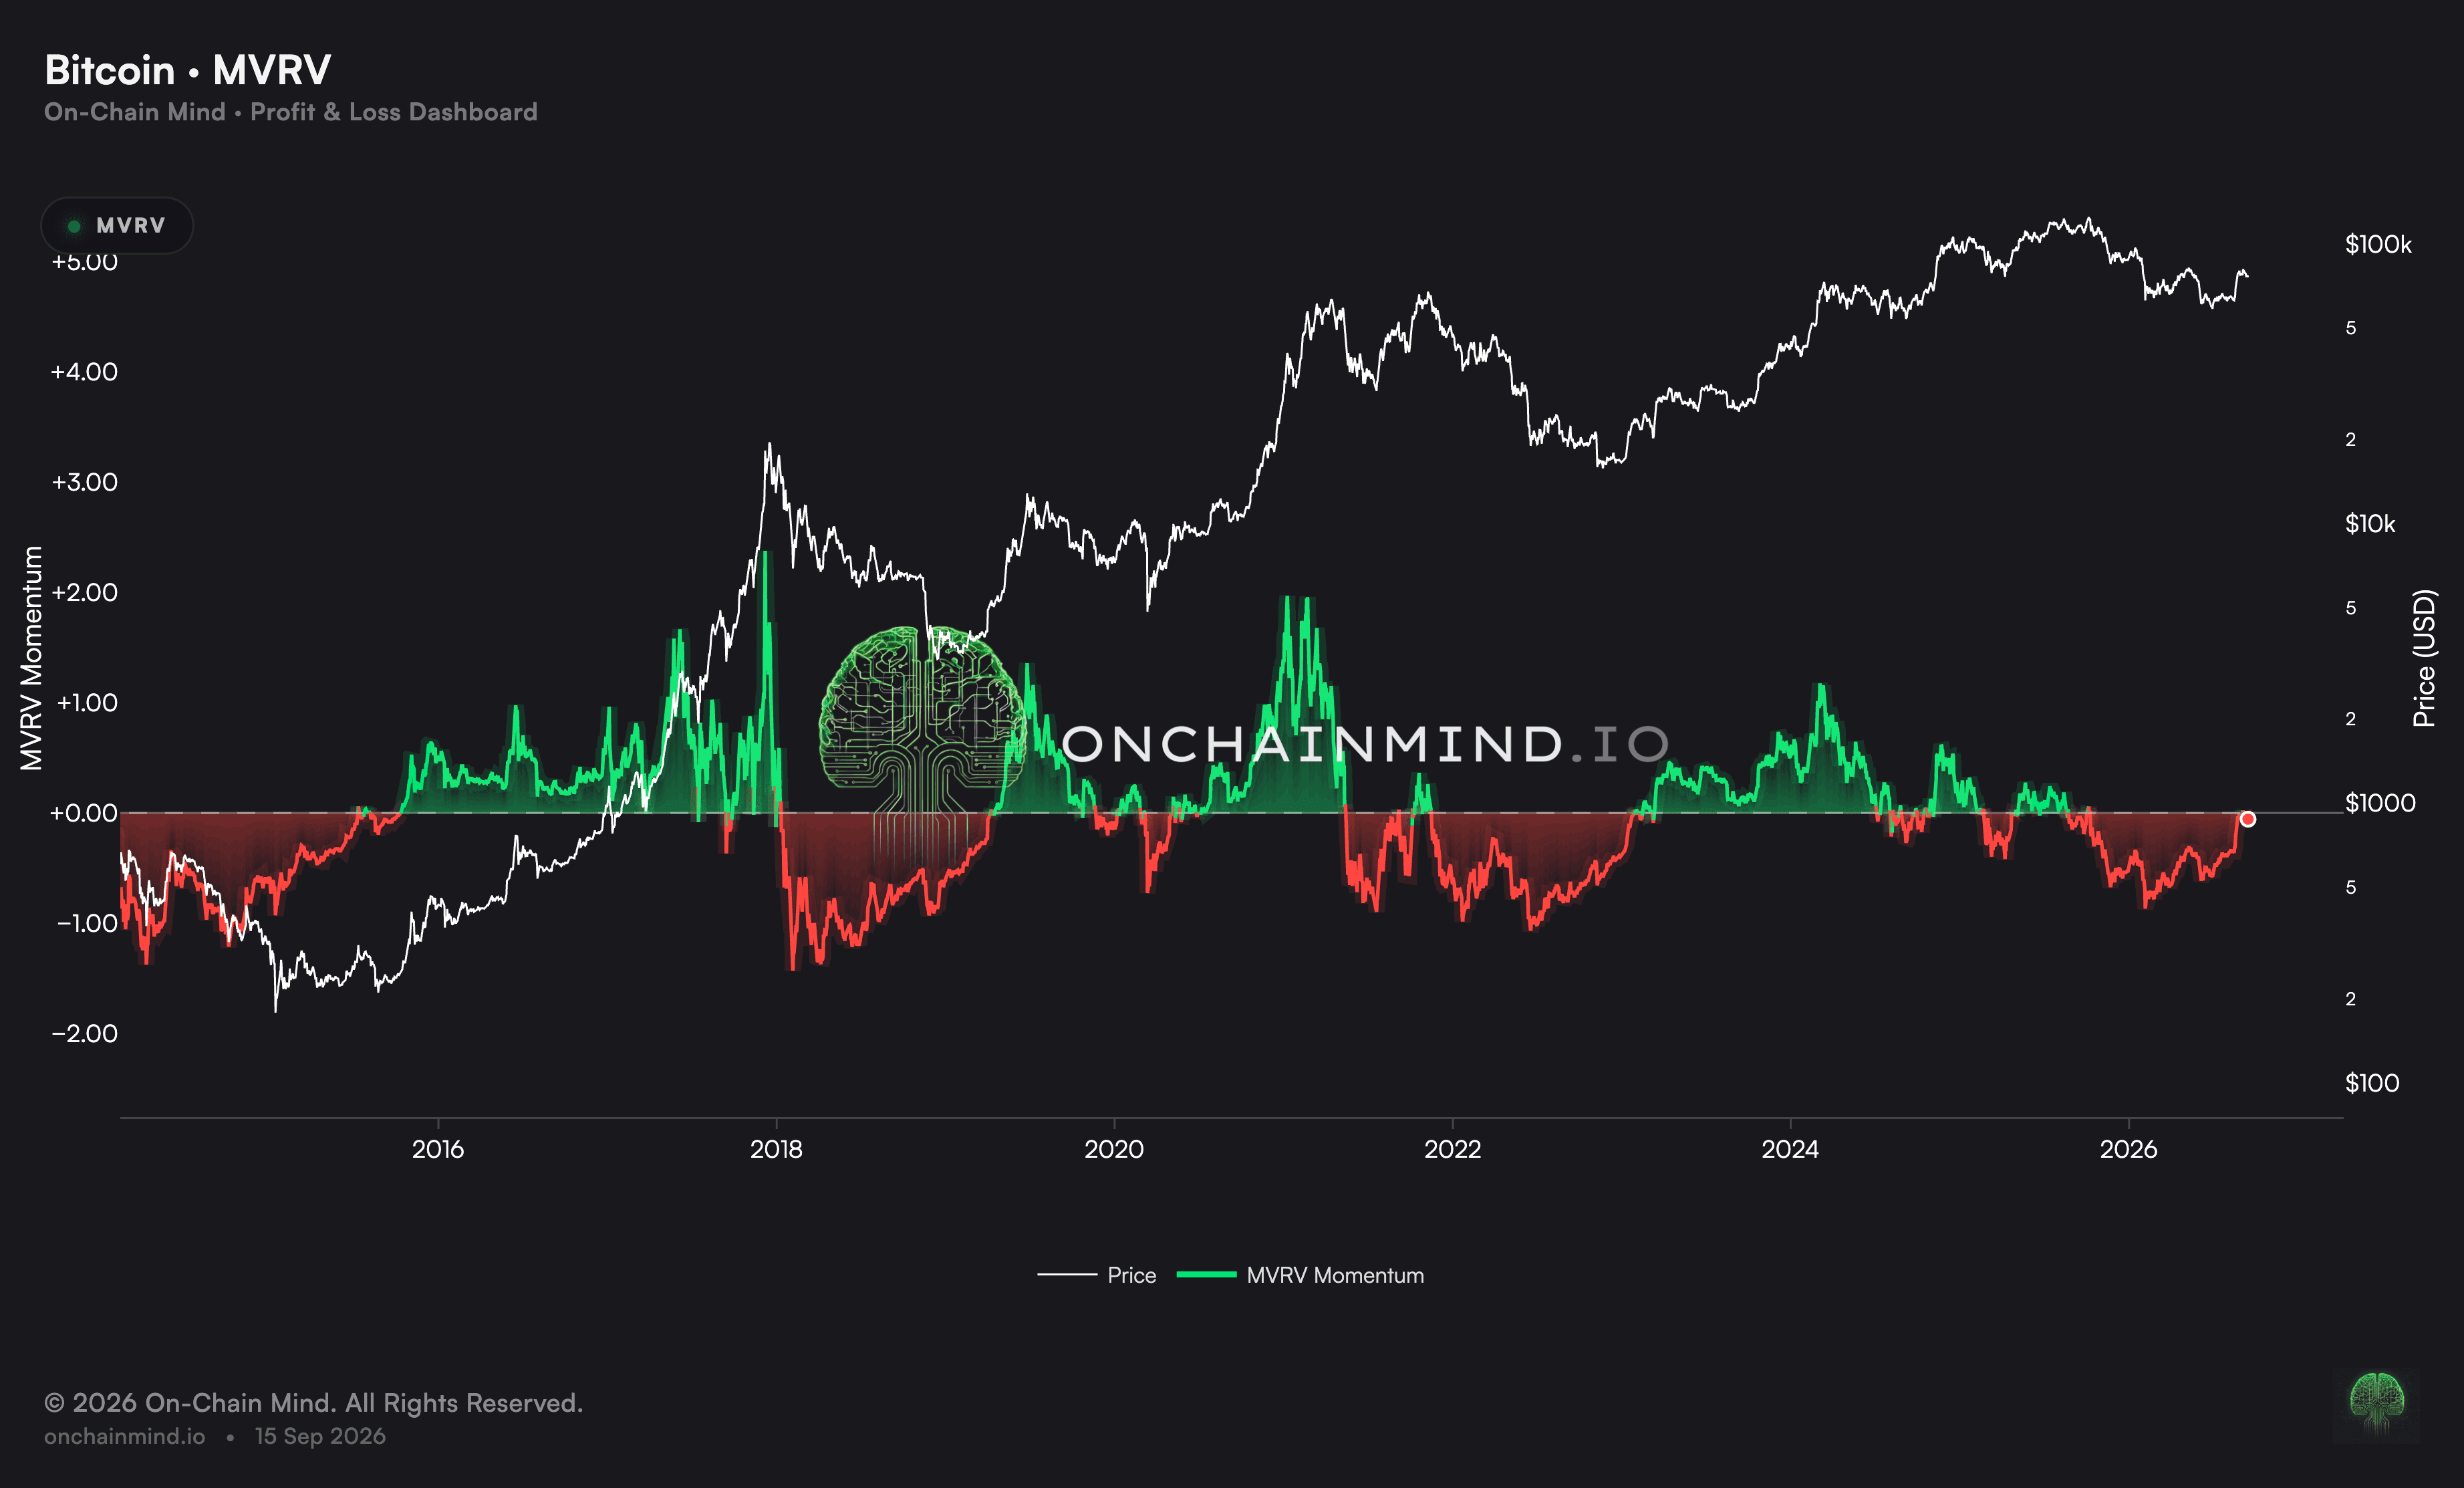
Then there is momentum, which answers the critical question that levels never can: direction and speed.
We take the rate of change of MVRV, compare short-term movement against a longer baseline, and read whether network profitability is expanding or contracting.
MVRV can sit at what appears to be a comfortable level, while momentum has already rolled over, and that is a market deteriorating beneath a headline that looks fine. Right now we are on the very edge of flipping green for the first time in over a year.
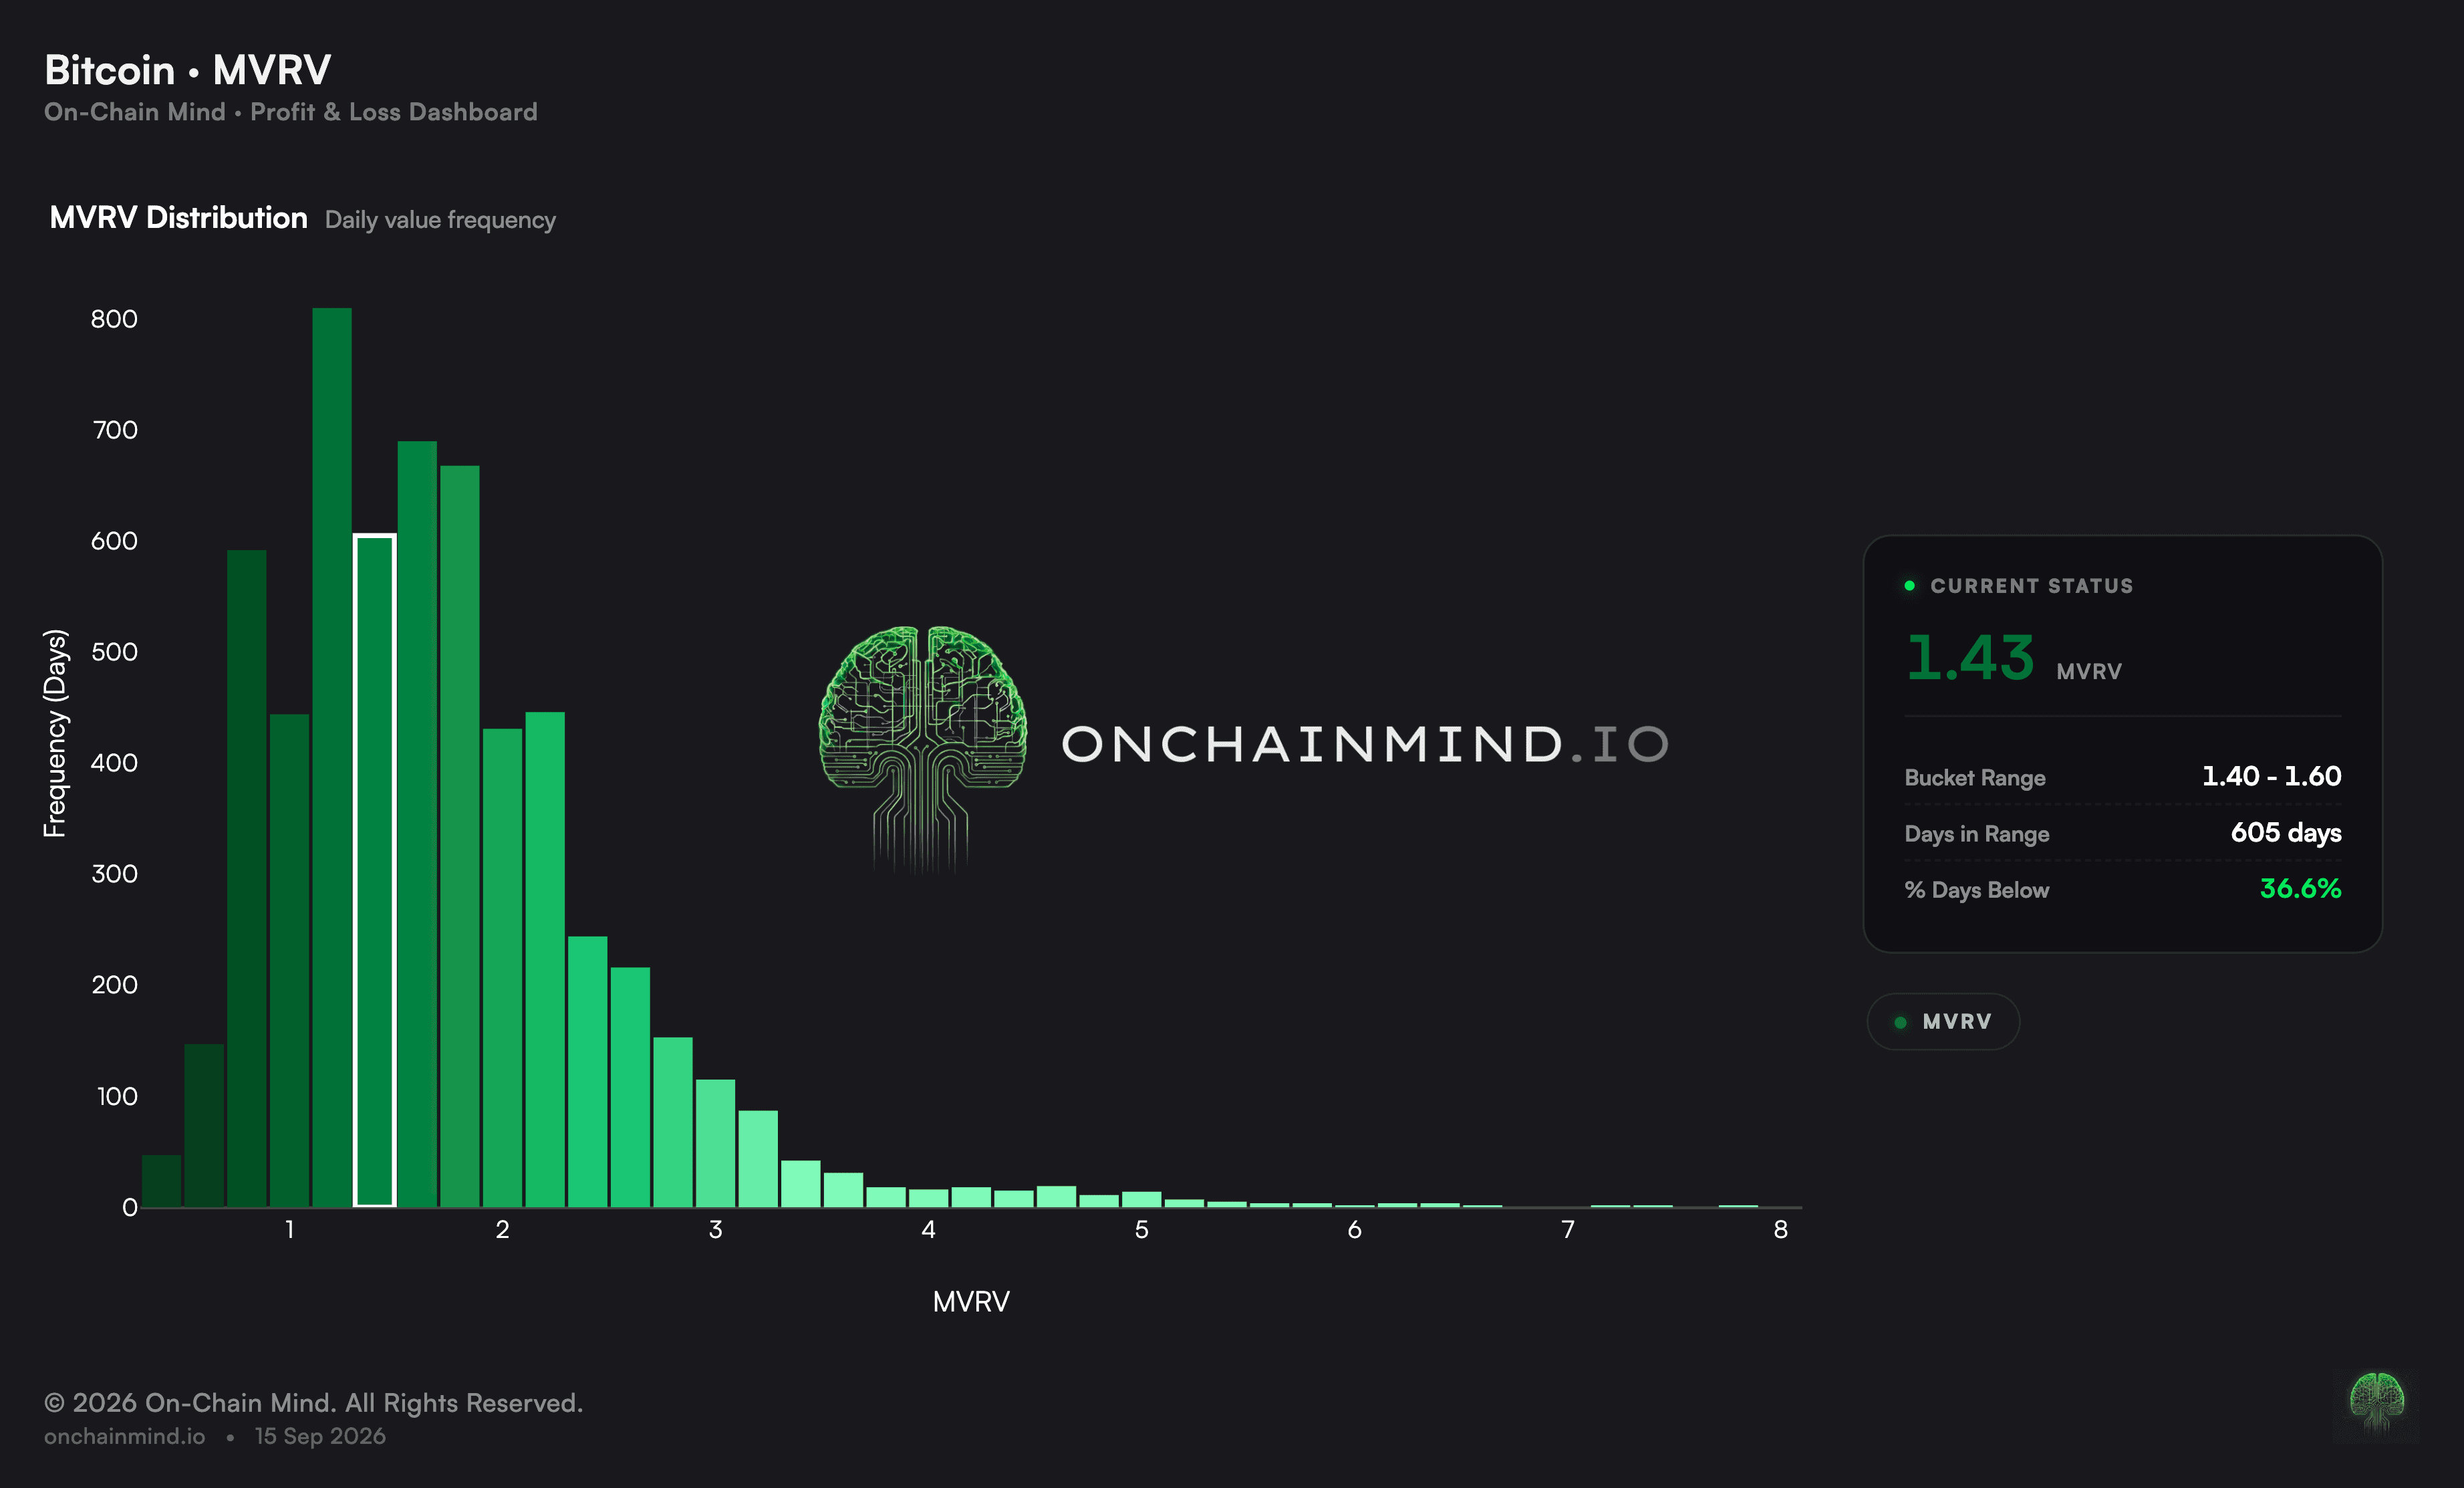
The third and final view I'm going to be sharing with you is the distribution, and it's one of my favourite views on the platform, because it's the closest thing MVRV gives you to an early warning system.
Instead of just plotting the MVRV over time, this view flips the question around. It asks: across all of Bitcoin's history, how much time has MVRV actually spent at each level?
Some readings are common, price sits there for many months at a stretch. Others are rare, brief spikes that show up for a matter of days before the market pulls back or rips higher.
Most of the time, today's value sits somewhere in the thick, well trodden middle of that distribution, and there's nothing to say. But every so often price pushes out into the thin right or left tails, into territory where barely any of Bitcoin's history actually lives.
And that thinness is the signal. Especially out on the far right tails, it's telling you that historically, whenever the market has found itself out here, holders have found it near impossible not to sell. Not because of some external trigger, but because the unrealised profit sitting on their coins becomes too heavy to sit still with.
And what's even more useful is that this warning tends to arrive before price rolls over, not after. By the time everyone's talking about the top, this view has usually already flagged it.
View live in OCM Studio: MVRV Distribution
The One View That Refuses To Break
Everything so far has treated the network as a single blob. But split it by cohort, and the metric gets far sharper.
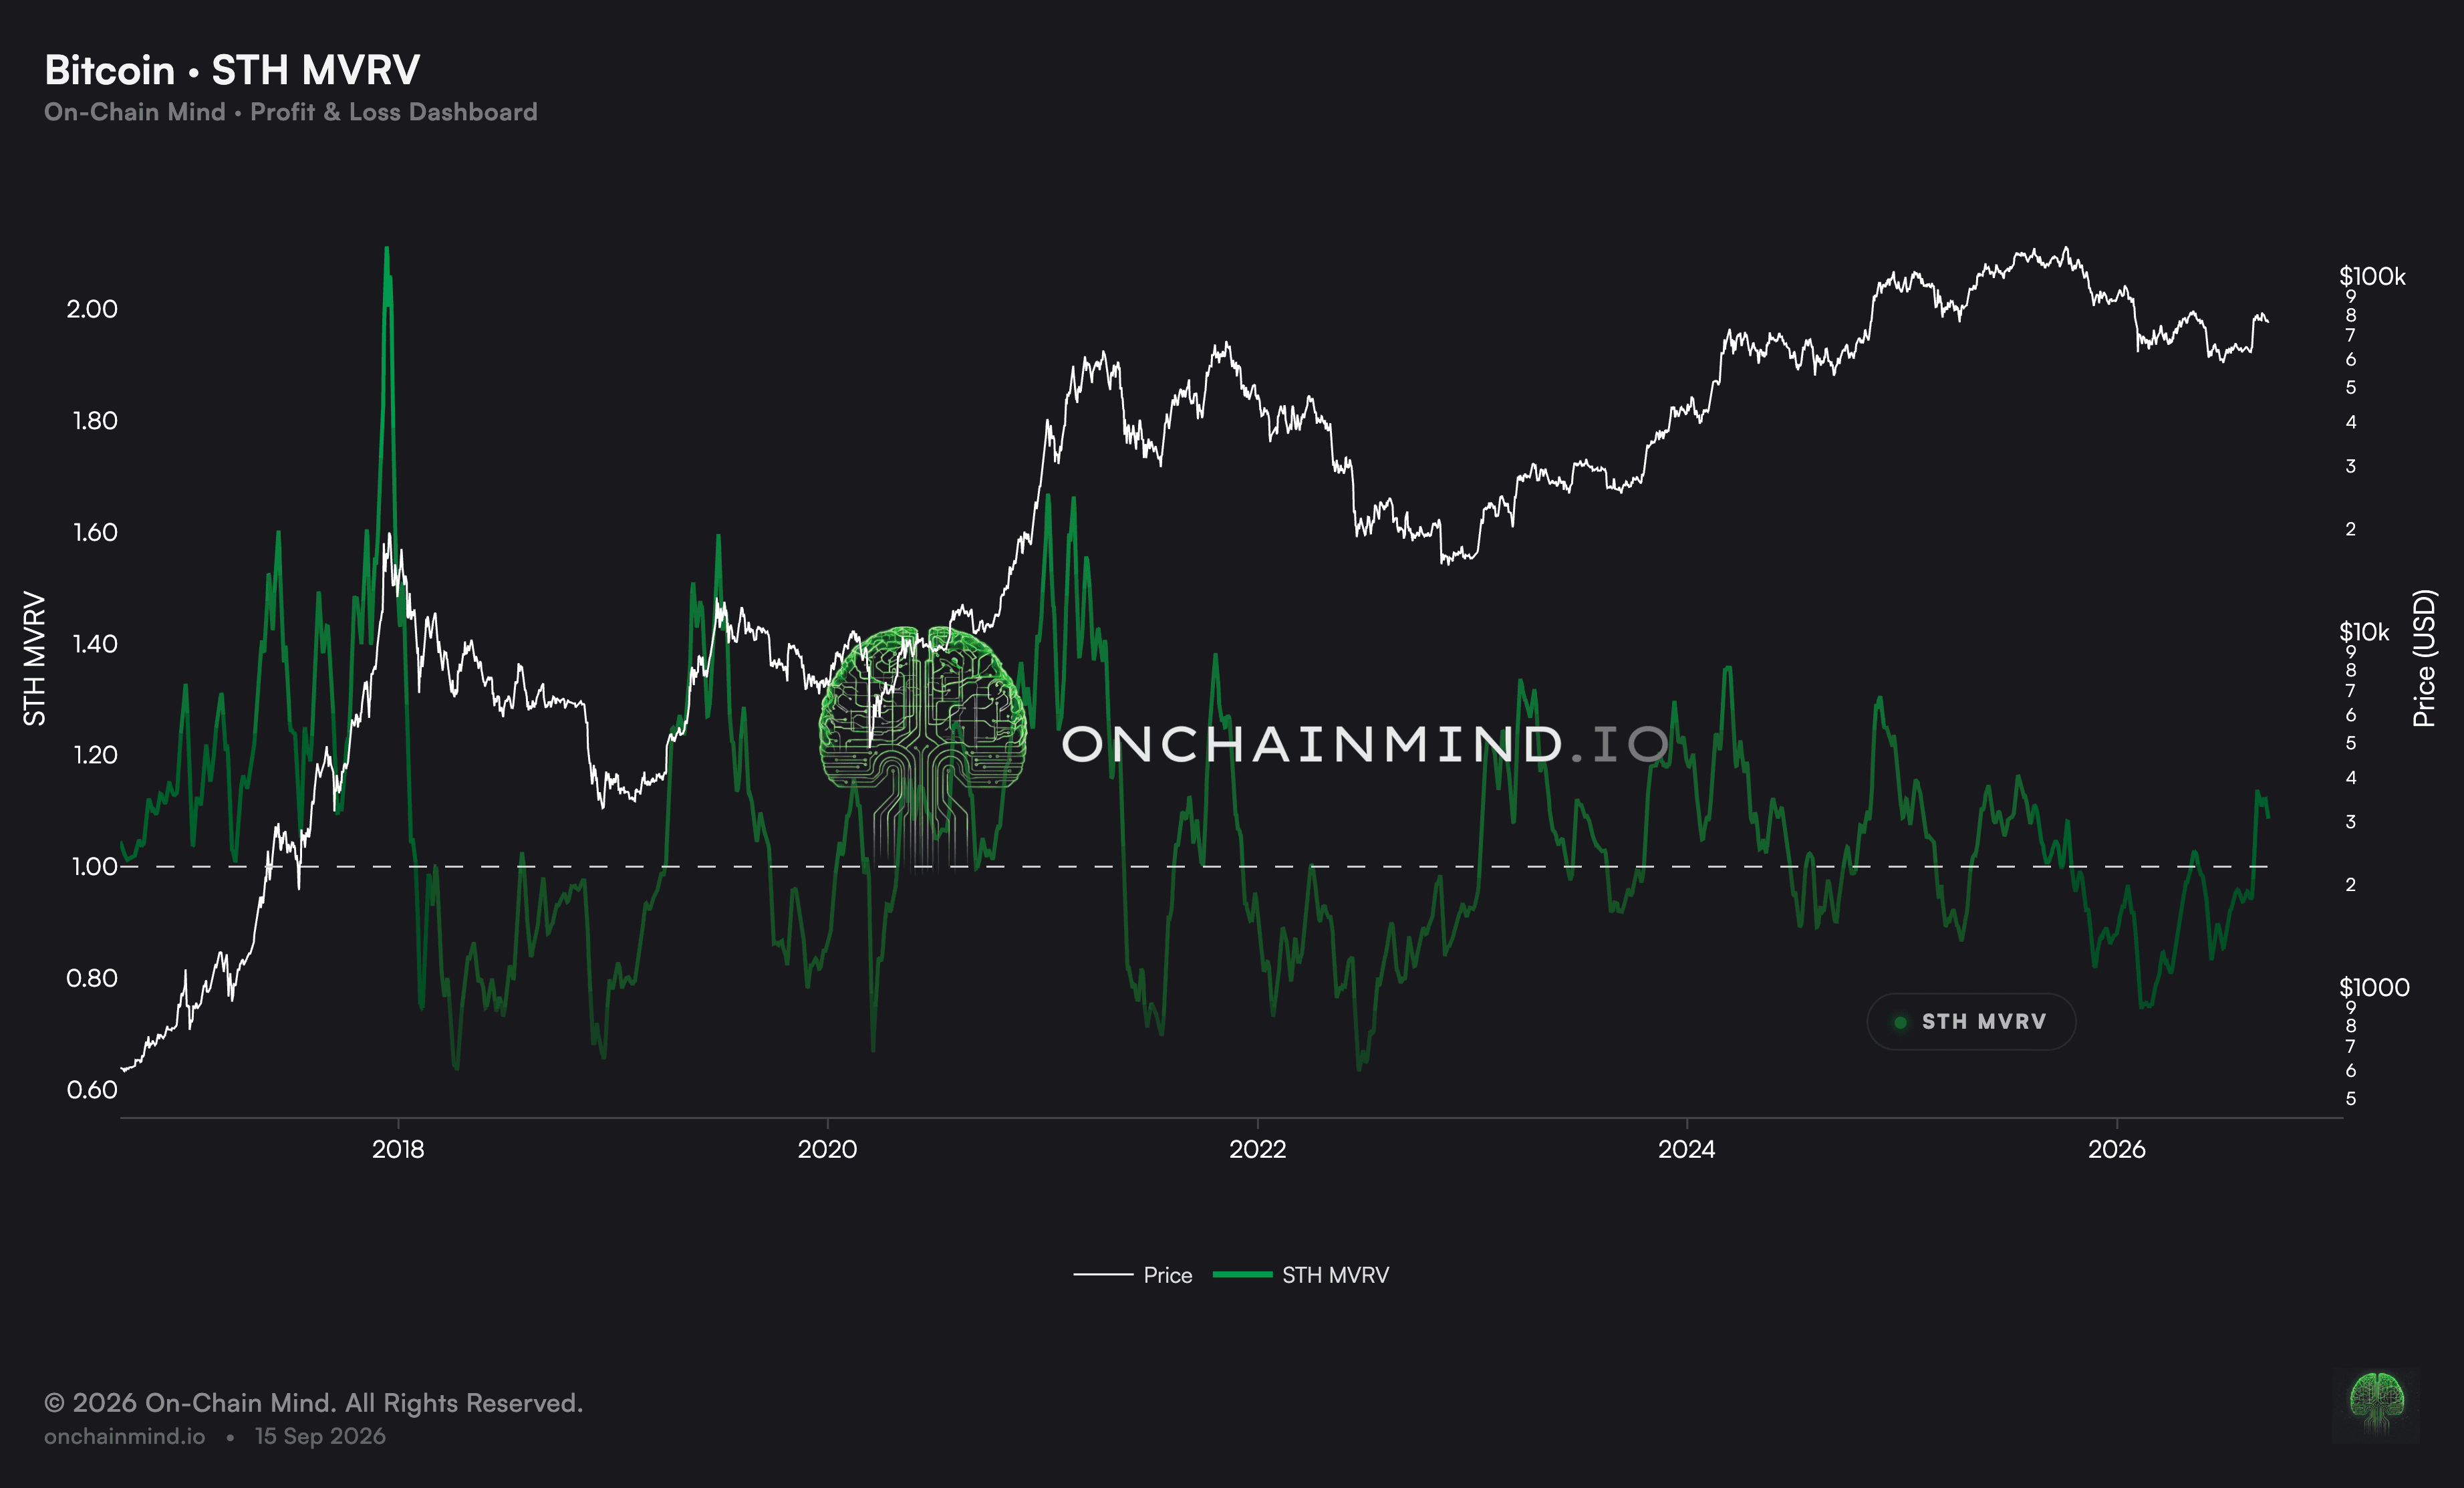
Short-Term Holder MVRV is where the real tactical value sits, and remarkably, the raw version still works exactly as it always has. Recent buyers are reactive money. Their cost basis hugs spot, so their MVRV oscillates fast and violently around 1.
View live in OCM Studio: STH MVRV (raw)
Everything so far has treated the network as a single blob. But split it by cohort, and the metric sharpens considerably, because different holders behave very differently once they're under pressure.
Short-Term Holder MVRV is where the real tactical value sits, and what's remarkable is the raw version still works exactly as it always has. Recent buyers are the reactive money, they bought within the last few months, so their cost basis sits close to spot. That closeness is what makes the read so sensitive: their MVRV oscillates fast and violently around 1, swinging between profit and loss within days/weeks rather than months/years.
In a bull market, a fall back to 1 has repeatedly marked the floor of a correction, because of what that level actually represents. Price lands exactly on the recent buyer's cost basis, they step back in at break-even, and the uptrend resumes. The 2017 run did this over and over, dip after dip absorbed right at 1, right up until euphoria stretched MVRV so far above 1 that there was no cohort left beneath to defend it.
In a bear market, the same level flips polarity entirely. A rally back to 1 doesn't invite buying, it hands underwater buyers an escape at break-even, and they take it. 2018 was defined by that rejection, every recovery attempt met by sellers at the same level. 2022 was almost a carbon copy.
And 2026 has run the identical script. Since the October top, every attempt to reclaim 1 was sold straight into, month after month of failing at the same ceiling, the exact pattern that defined the last two bear markets.
We have now convincingly broken back above it. In every historical case, that reclaim marked the start of the next bull.
My Take On MVRV
Is MVRV the best timing tool we have? On its own, no.
It can sit in the overextended zone for months while price keeps climbing regardless, and it can grind at depressed levels for an uncomfortably long stretch before anything actually changes. What it gives you is a read on risk and reward across a full cycle. What it has nothing useful to say about is next week.
What has definitely changed for me recently is how much I lean on the raw ratio and the Z-Score. I've drifted away from both. The diminishing peaks you see cycle after cycle are a feature of a maturing asset rather than a fault in the metric itself, but they make judging exactly where we sit in a cycle harder with every year that passes.
Anchoring to a number that printed back in 2014 isn't analysis anymore, it's nostalgia.
That's why the percentile view has become my default. It doesn't care what the raw figure actually is, only where today ranks against every other day this asset has ever lived through, which is a far more robust question to be asking of a 14 year old market than it was of a 4 year old one.
But there's one raw view I can't see breaking, and that's Short-Term Holder MVRV, and the reason is structural and psychological. That cohort completely refreshes itself every 155 days. There's always a fresh wave of recent buyers, carrying a fresh cost basis, carrying a fresh set of entirely predictable, entirely irrational behaviours for the rest of us to read and exploit.
As the raw MVRV has proven, Bitcoin has matured as an asset. But as we've seen time and time again, human psychology at break-even has not.