

A 39% rally has arrived at the exact point in a bear market where rallies are supposed to be at their weakest.
That is either the strongest tell we have had in a year, or the most expensive trap of the cycle. And the level that decides which is the 365-day moving average at $81,500, the one line on my charts where every lasting shift between bull and bear in this asset's history has been settled.
So the question is no longer whether this rally has been impressive. It is whether the past month was the opening act of a new bull market, or the most convincing bounce of a bear that is not finished with us yet.
Let's get into it.
Key insights
The Regime Divider: One slow-moving level has separated bull from bear for over a decade, and we are sitting on it.
Three Years From Here: Every historical analogue to today's setup resolved higher, with a median outcome most would not guess.
A Rally Out of Sequence: The bear market rally pattern has just broken in a way I have never seen in the data.
Thin Capital, Big Move: The money behind this re-rating is far smaller than the price action implies, and one buyer explains much of it.
The Ultimate Line in the Sand
The yearly moving average is not glamorous. That is exactly why it works.
Because it averages a full year of closes, a single impulsive week barely moves it. To cross it and hold, the market has to change the average price it has been transacting at for months on end, which is a structural event rather than a sentiment event.
That slowness is the feature. It filters out the noise that makes the 200-day so easy to fake out.
Run your eye back through the cycles and the pattern is consistent.
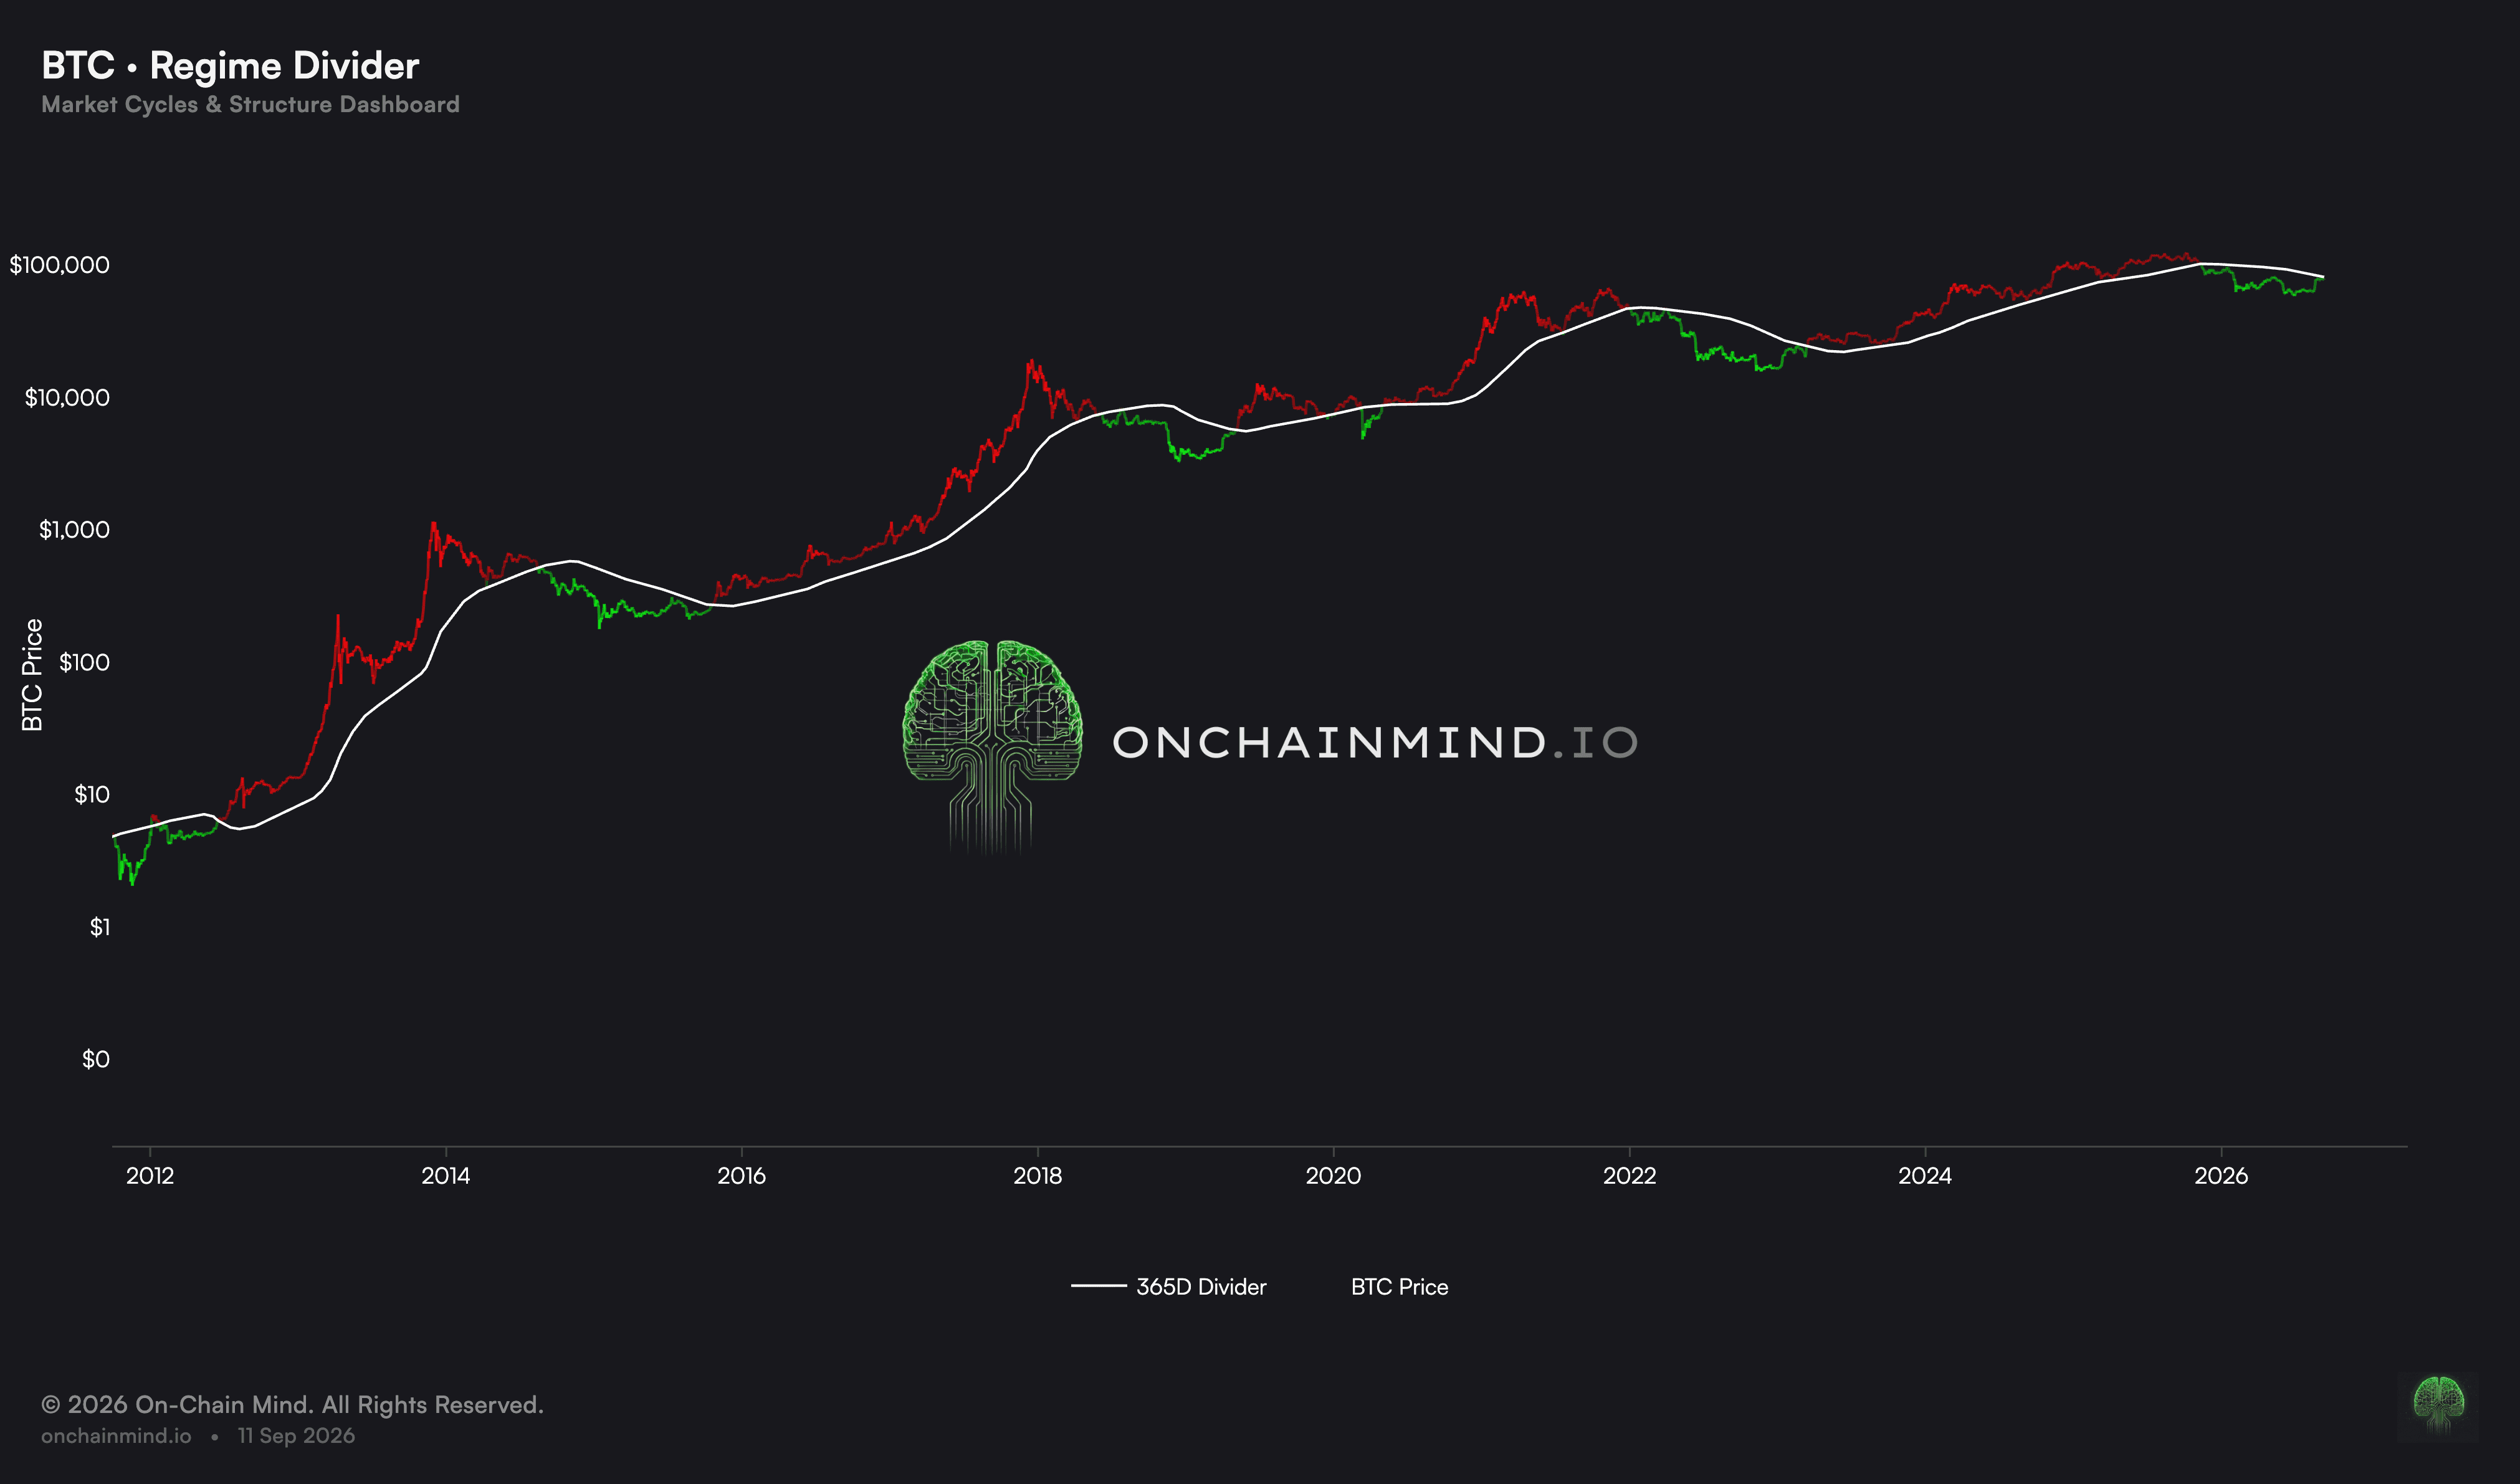
View live in OCM Studio: Regime Divider (365D MA)
Price accepts above the yearly average and the following years belong to the bulls. Price loses it and you get the long, grinding drawdowns of a bear. The crossings are relatively rare, and the periods that follow them are long.
Right now we are approaching that critical level, and it is currently stood at $81,500.
That is why I keep calling it the regime divider rather than just another level. It is the cleanest binary I have for framing where we sit in the cycle, and it is currently unresolved. How price treats this line over the coming weeks matters more to my medium-term positioning than most other things on my screen.
And until we reclaim it, we have not earned the right to call the bull market fully back yet.
But the yearly average only tells us where the fight is happening. It does not tell us how fights like this have ended.
So I tested today’s setup against every comparable point in Bitcoin’s history, and the result was far more one-sided than I expected. It becomes even harder to dismiss when you see what this rally has done to the usual bear-market sequence, how little capital appears to have driven it, and which group supplied an outsized share of that money.
There is also one of my most trusted short-term signals that is now flashing in the opposite direction. Put those pieces together and the outlook becomes uncomfortable, but much clearer.
So let’s start with the historical paths.
What Happened Every Other Time It Looked Like This
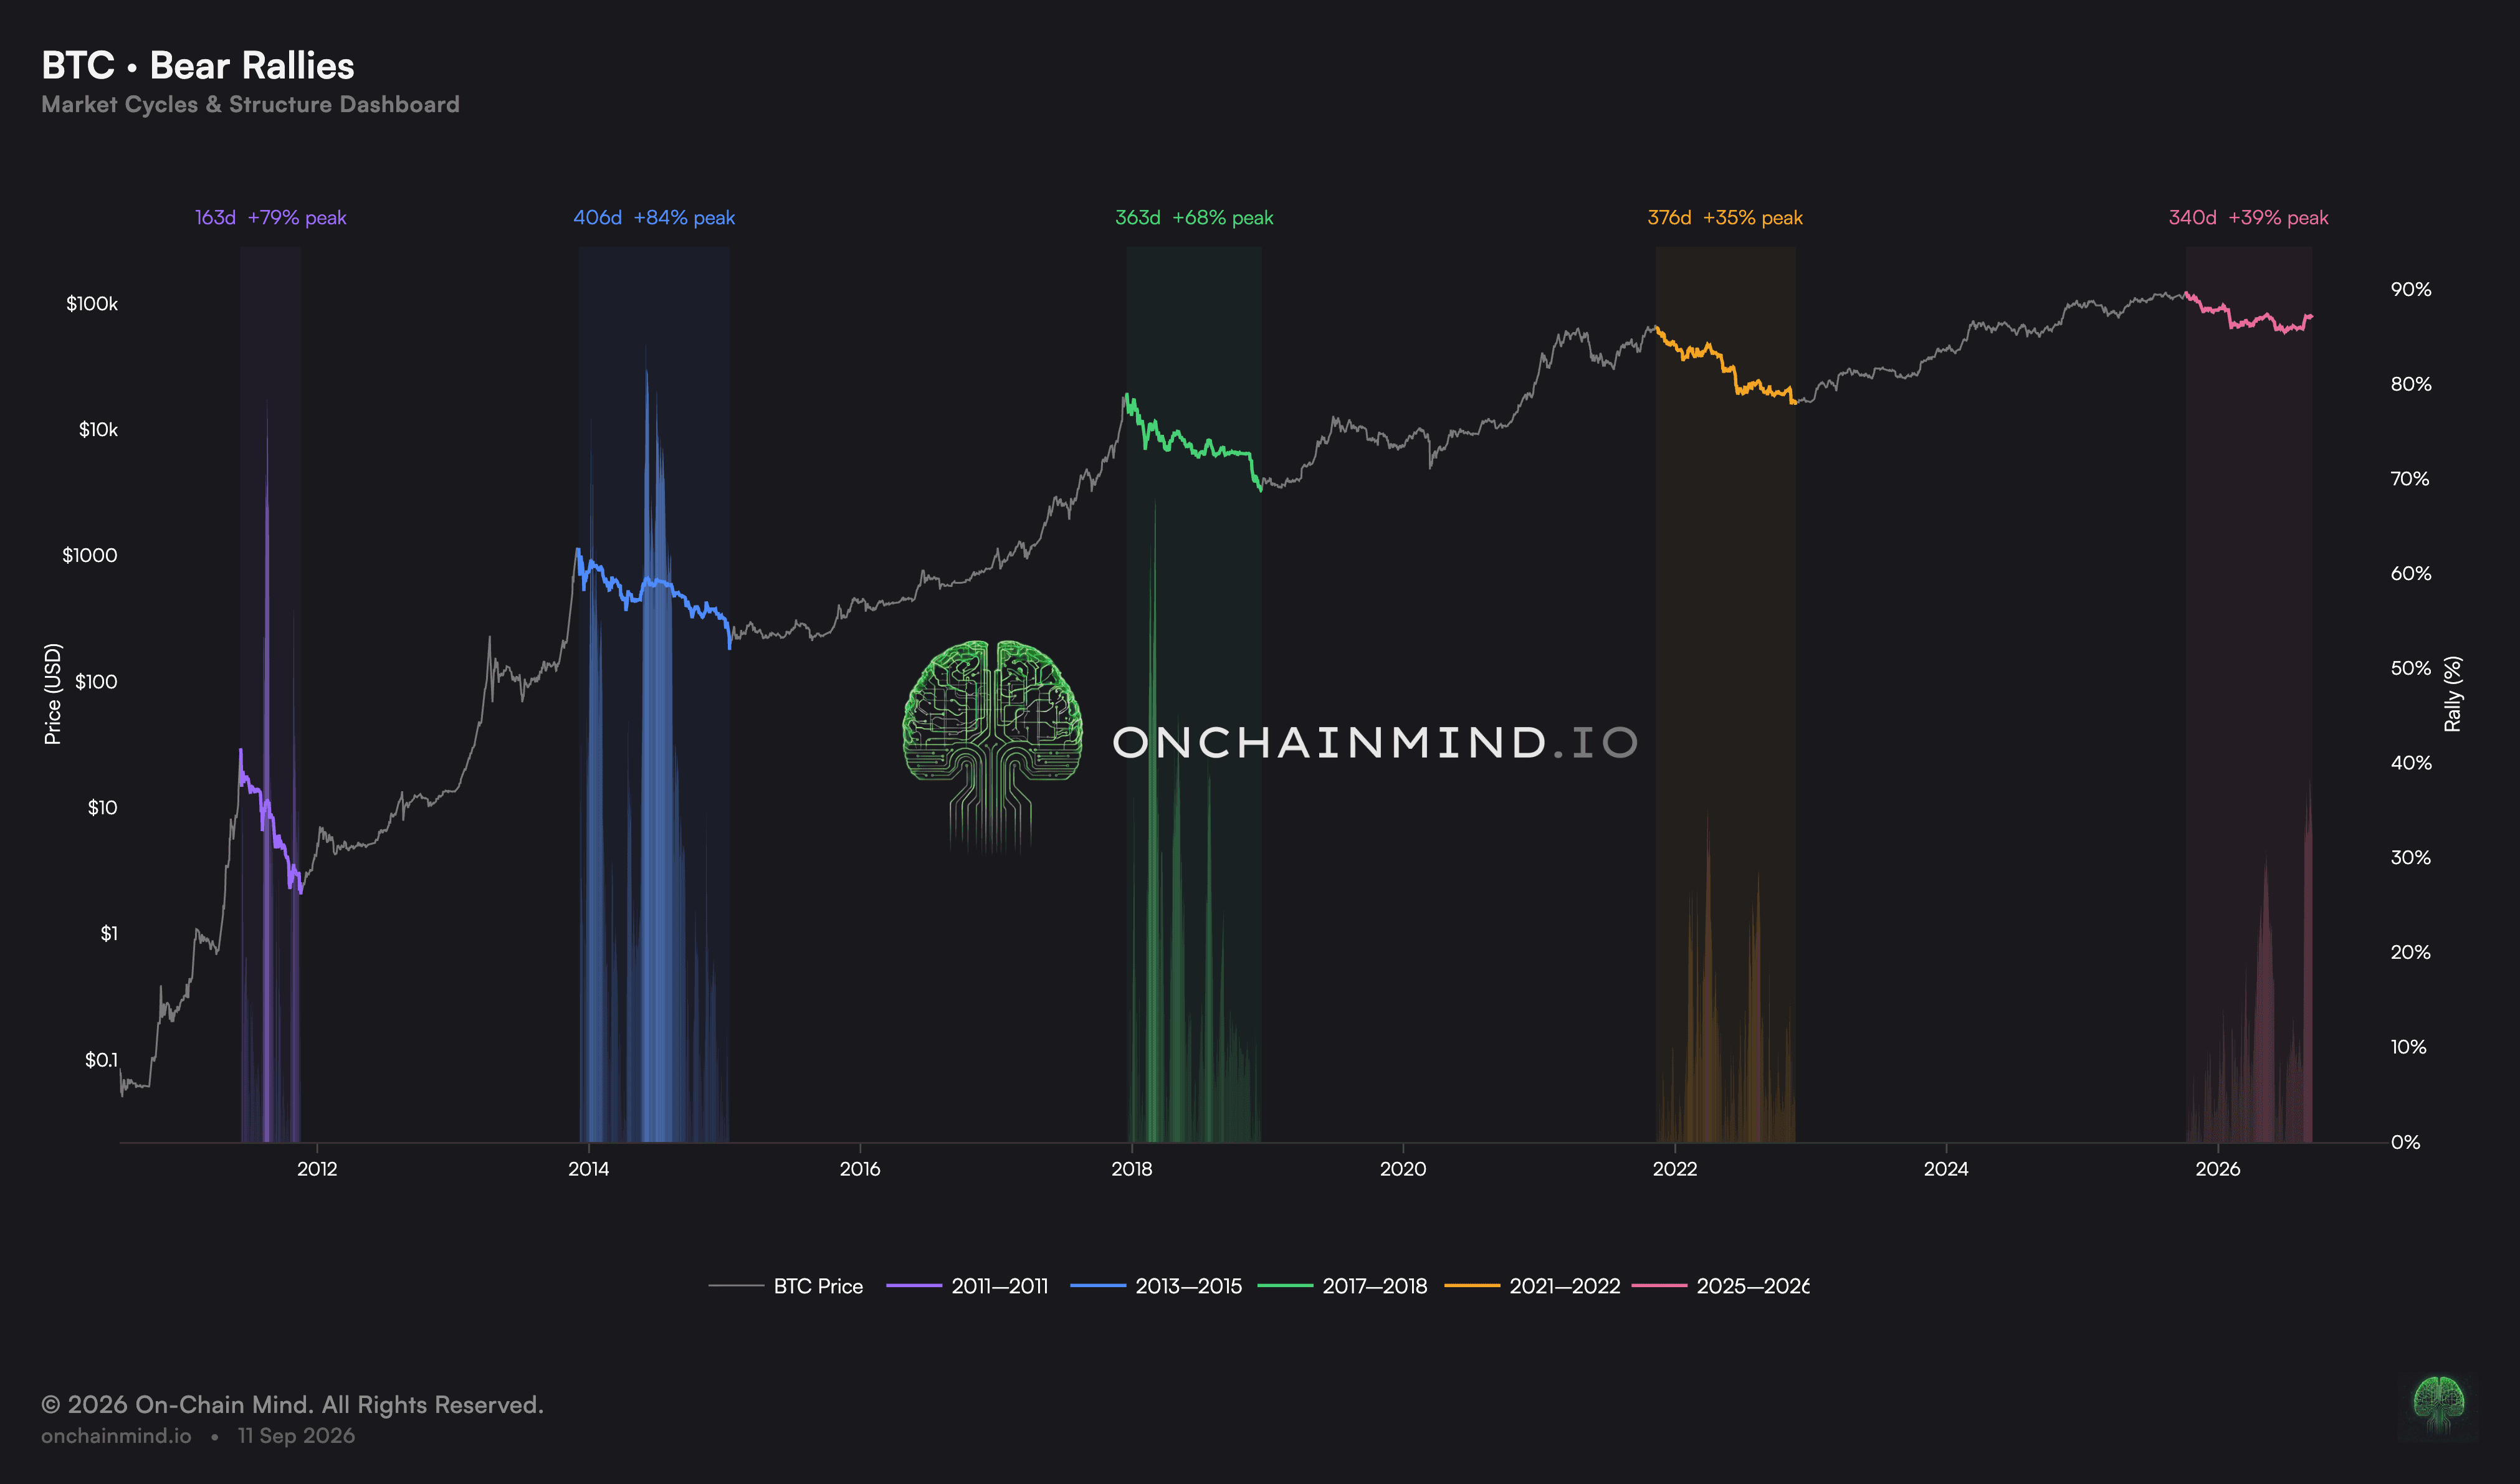
View live in OCM Studio: Bear Rallies
Continue reading with OCM Premium
You have been reading the free preview of this article. The full analysis continues with 18 more sections, charts and takeaways. Read the full article or see OCM Premium plans.