
There are 2 ways to lose money in this market right now, and they are complete opposites.
You can fight a downtrend that has run for 87 days and taken 18% out of anyone who tried. Or you can look at that same downtrend, call Bitcoin broken, and walk away from a momentum reading that has only ever appeared at generational lows.
One mistake costs you a quarter. The other costs you a cycle.
So in this article, I’ll show you where price sits inside my trend models, what the next 3 weeks look like, and the single level that flips all of it.
Let’s get into it.
Key insights
Confluence Over Conviction: No metric survives alone. Agreement between independent methods is the only thing that counts as a “signal” .
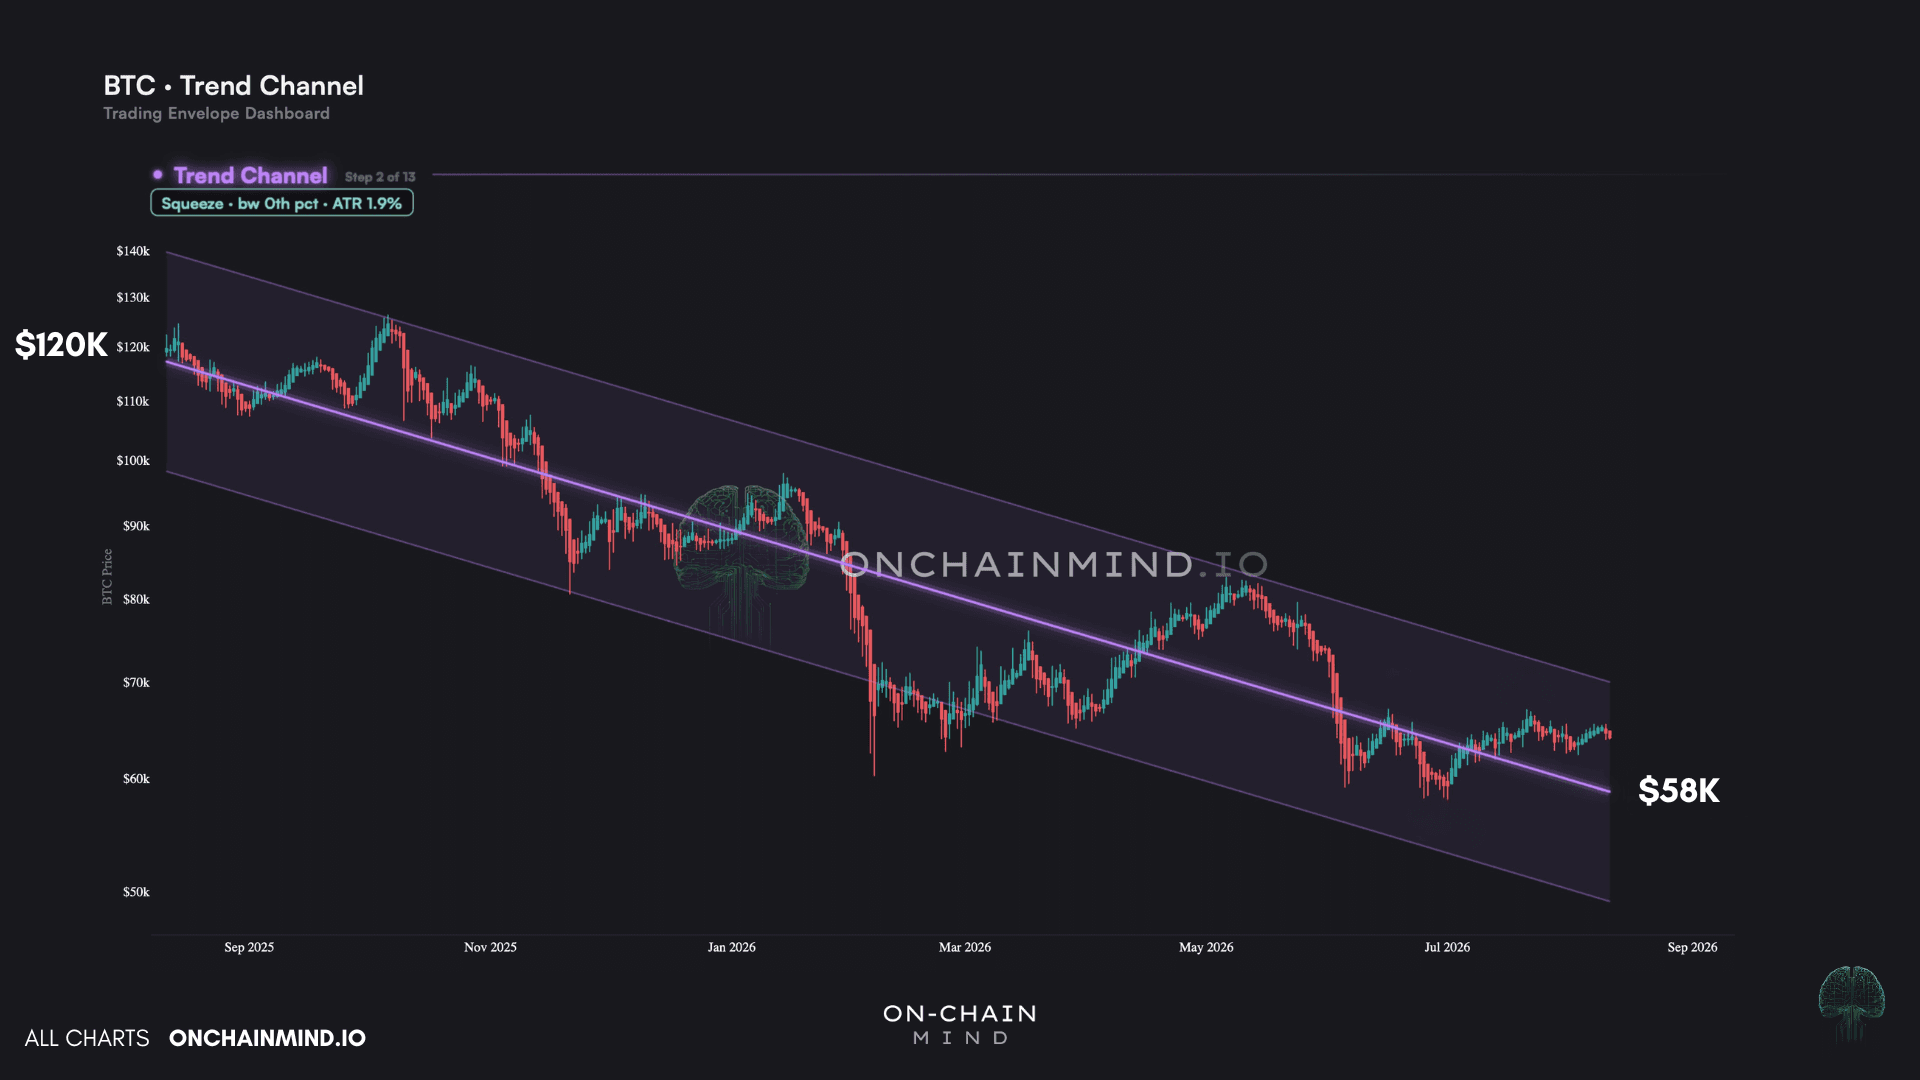
The Structure Is Bearish: The trend channel has fallen from $120,000 to $58,000, and price sits below both of my key moving averages.
$67,000 Flips Everything: The Adaptive Trend flip level scales with volatility, so our quiet market is dragging it towards us.
Long-Term Metrics Say Accumulate: The weekly Velocity RSI sits just above 14%, and we’re sitting on top of the 200-week MA. Both have marked every generational low.
The Trend Is Your Friend, And It Is Not Facing You
As you guys know, I mostly live on-chain, but technical analysis still earns its place.
So let’s start with the trend, because everything else is a footnote to it. Our regression channel’s centre has fallen from $120,000 down to $58,000 over the past year. And it carries an R² of 0.84, which means roughly 84% of the variation in price is captured by that trend line.
View live in OCM Studio: Trend Channel
Inside it sits a textbook run of lower highs and lower lows: buyers stepping in lower each time, sellers pushing further each time.
Recently, though, we made a higher low, which is the first genuinely positive structural development in months. Sellers pressed for a new low and could not get it.
Be careful with that however, because a higher low confirms nothing on its own. For a reversal you need a higher high to follow it. But it is the very first thing that has to happen before any trend change, and until you see one you have nothing at all.
It is the first crack of light, not the sunrise.
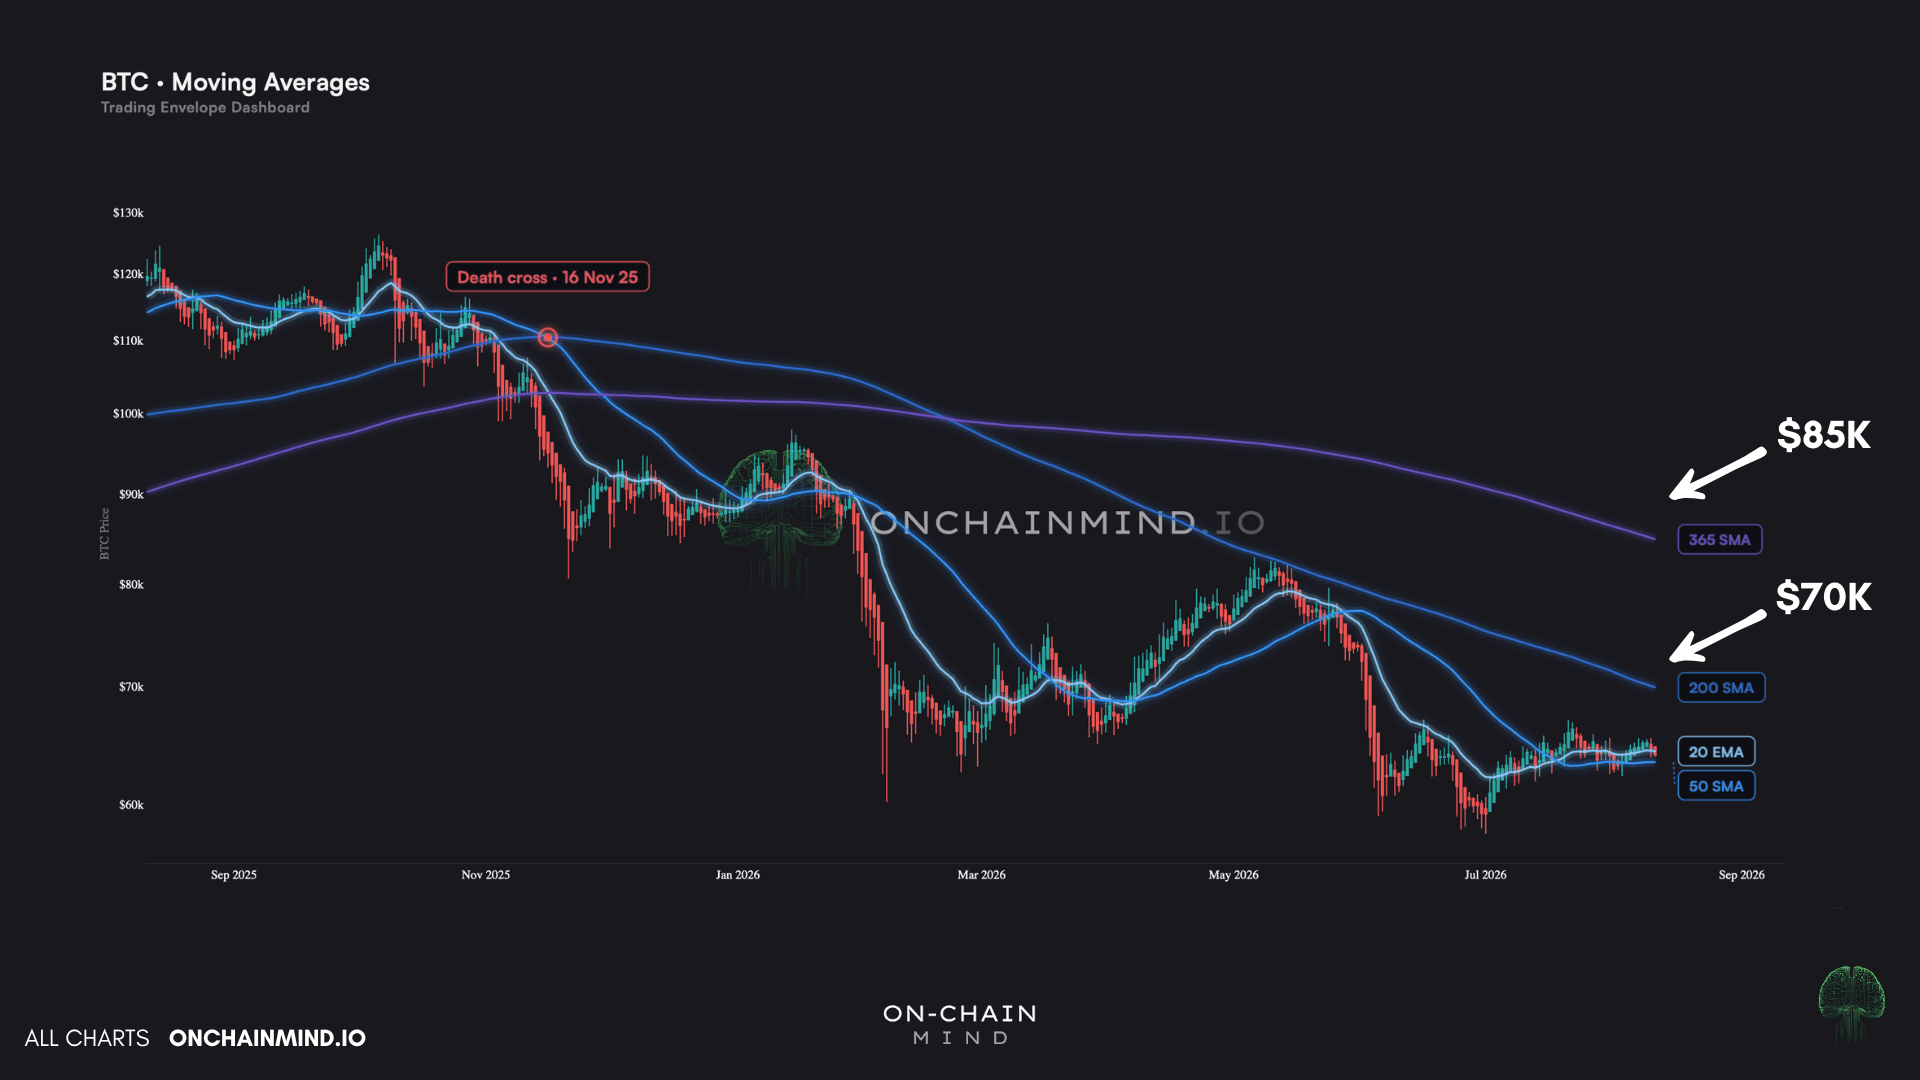
Then the two moving averages you know I watch: the 200 day just below $70,000 and the yearly just below $85,000.
Neither is clever, and that is exactly the point. Every desk, every algorithm and every retail trader is looking at the same two lines, which is what makes the reactions around them self-fulfilling.
We are well beneath both, so their job has inverted. What used to catch price on the way down is now the ceiling that has to be cleared on the way back up.
View live in OCM Studio: Moving Averages
The Level That Is Coming To Meet Us
The way I actually measure trend is the Adaptive Trend model, which we covered properly in our most recent article.
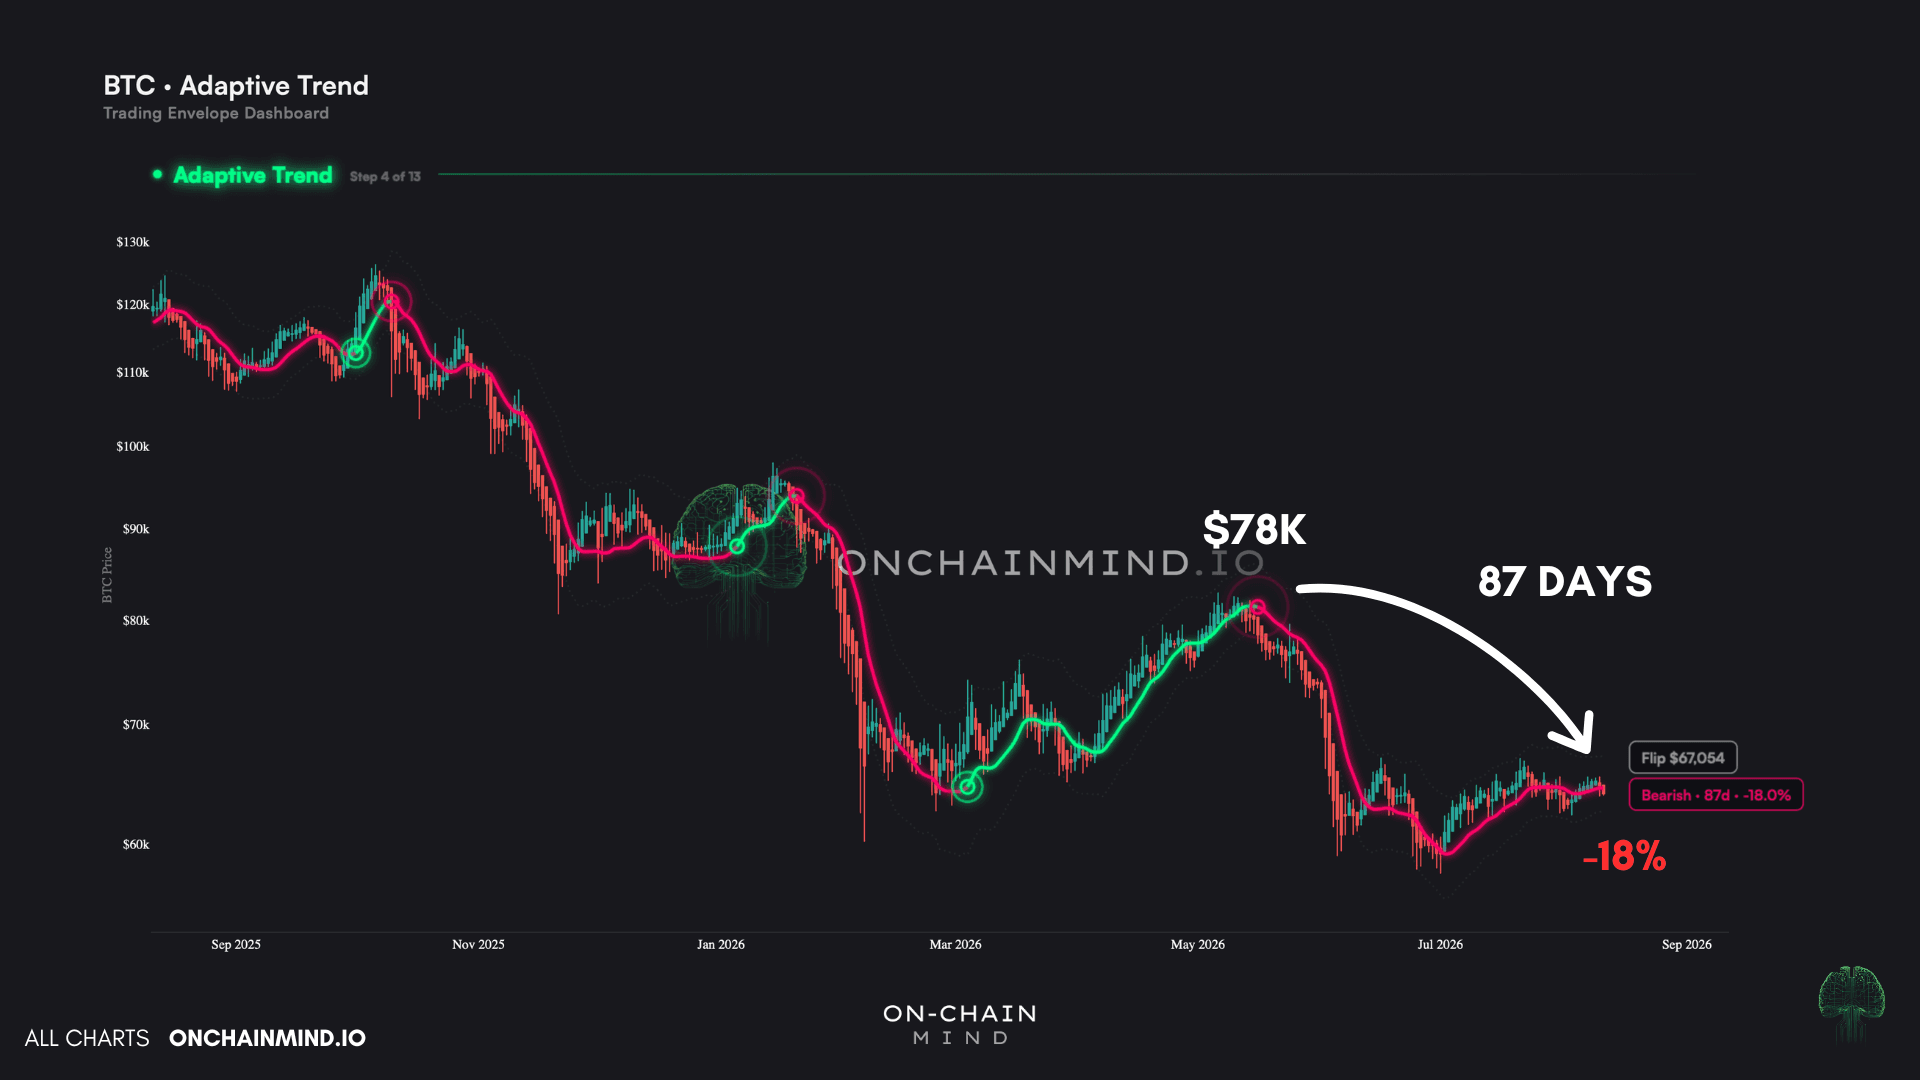
It has now spent 87 days in a bearish regime, having flipped at ~$78,000 in the middle of May, and we have taken an 18% decline since.
View live in OCM Studio: Adaptive Trend
The more interesting point right now is that the conditions for a flip are compressing.
The flip level is not a fixed number, it is set off volatility. As the market goes quiet and daily ranges tighten, which is exactly what we’re seeing right now, the distance price has to travel to break the regime shrinks with it.
Today it would take a burst above ~$67,000 to flip bullish, and that number is walking towards us while we sit still. If you write down one figure from this entire article, make it that one.
Stack it with the moving averages and you have a ladder overhead: $67,000-$70,000 for flipping short-term bullish, and then $85,000 for a confirmed regime change.
Boring Today, Weak Tomorrow, Cheap For Years
So that is the structure. So, where does price actually sit inside it?
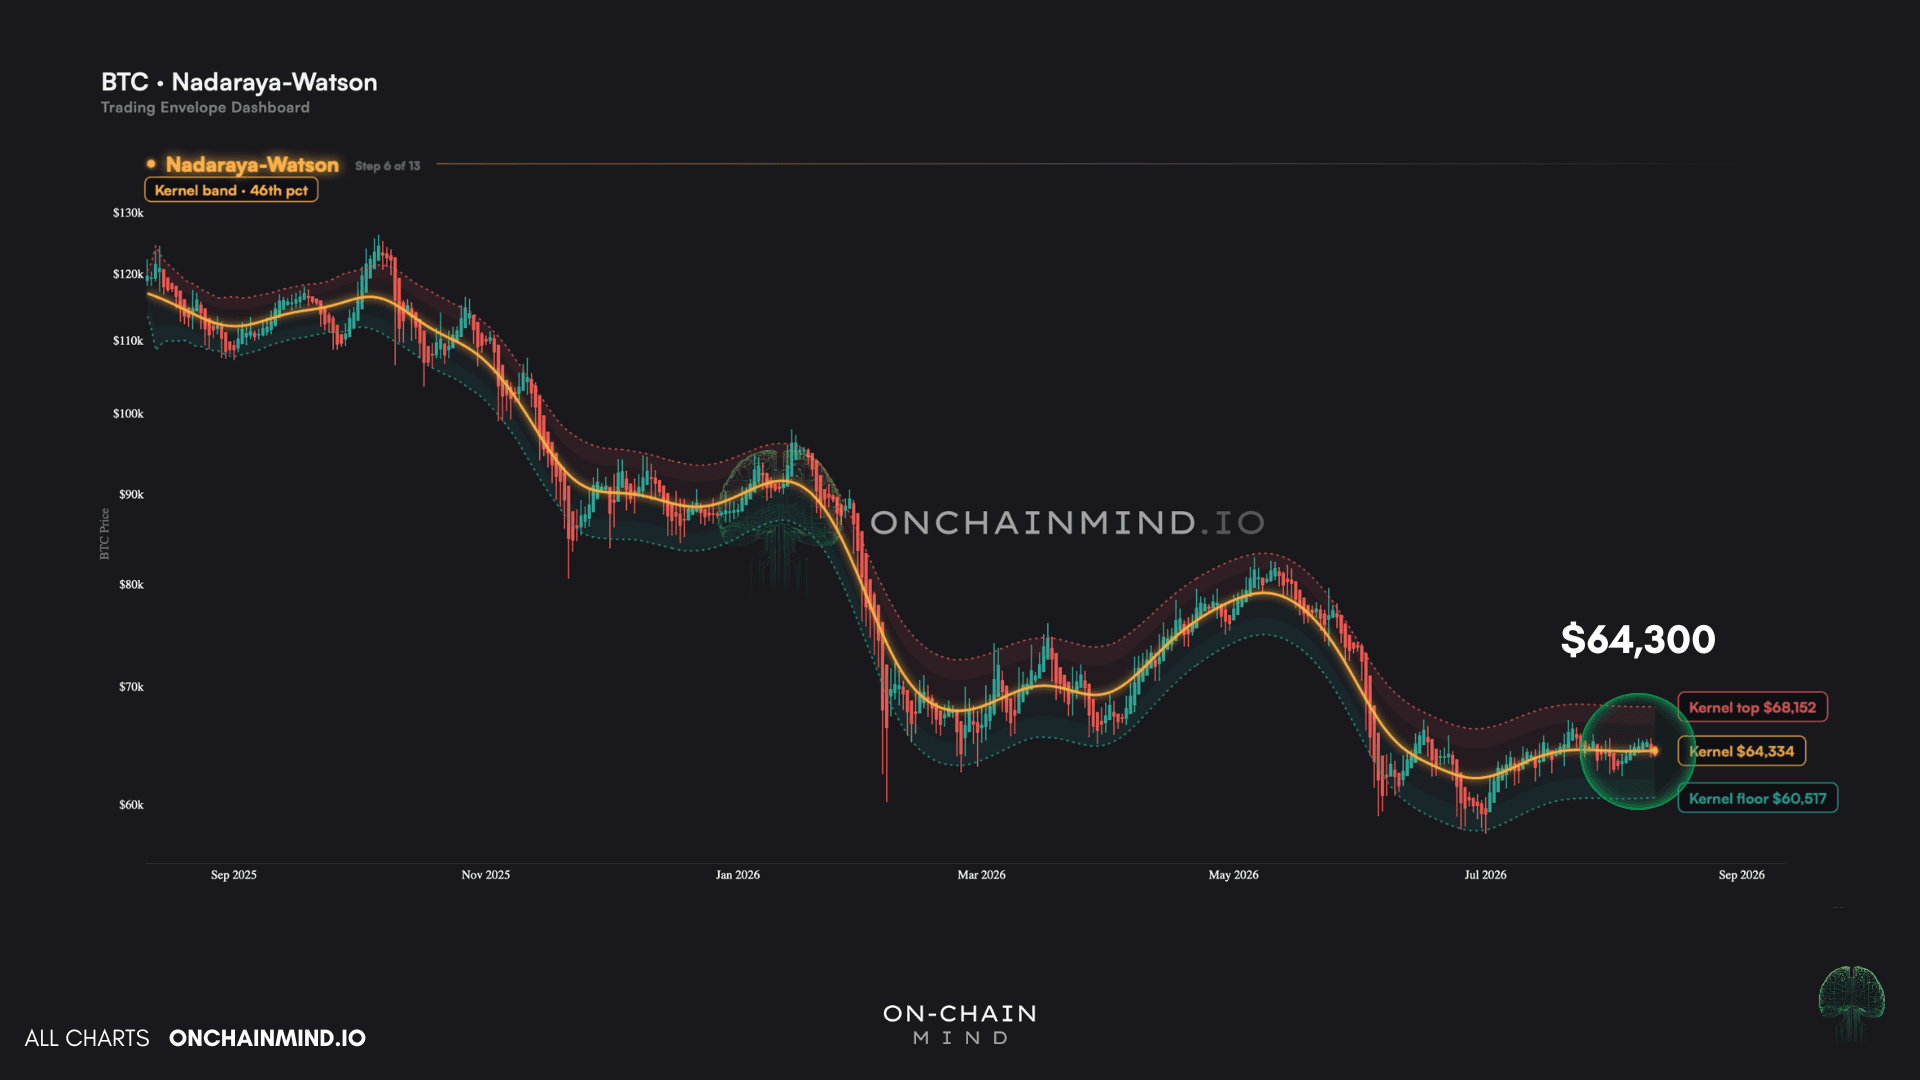
The Kernel Envelope wraps short-term price action in bands around a baseline, and that baseline is not a lagging moving average dragged behind price.
It is a kernel regression, weighting the nearest data most heavily, so the line bends with local price action rather than trailing it. Extreme wicks outside the envelope make a mean reversion back towards that baseline more likely than not.
View live in OCM Studio: Kernel Envelope
Today we are in one of the most boring periods on the entire chart, sat almost exactly on the baseline at $64,300.
However, boring is information.
There is no stretch to fade for a mean reversion in either direction, which tells you that short-term trading right now is really not something to be taking advantage of.
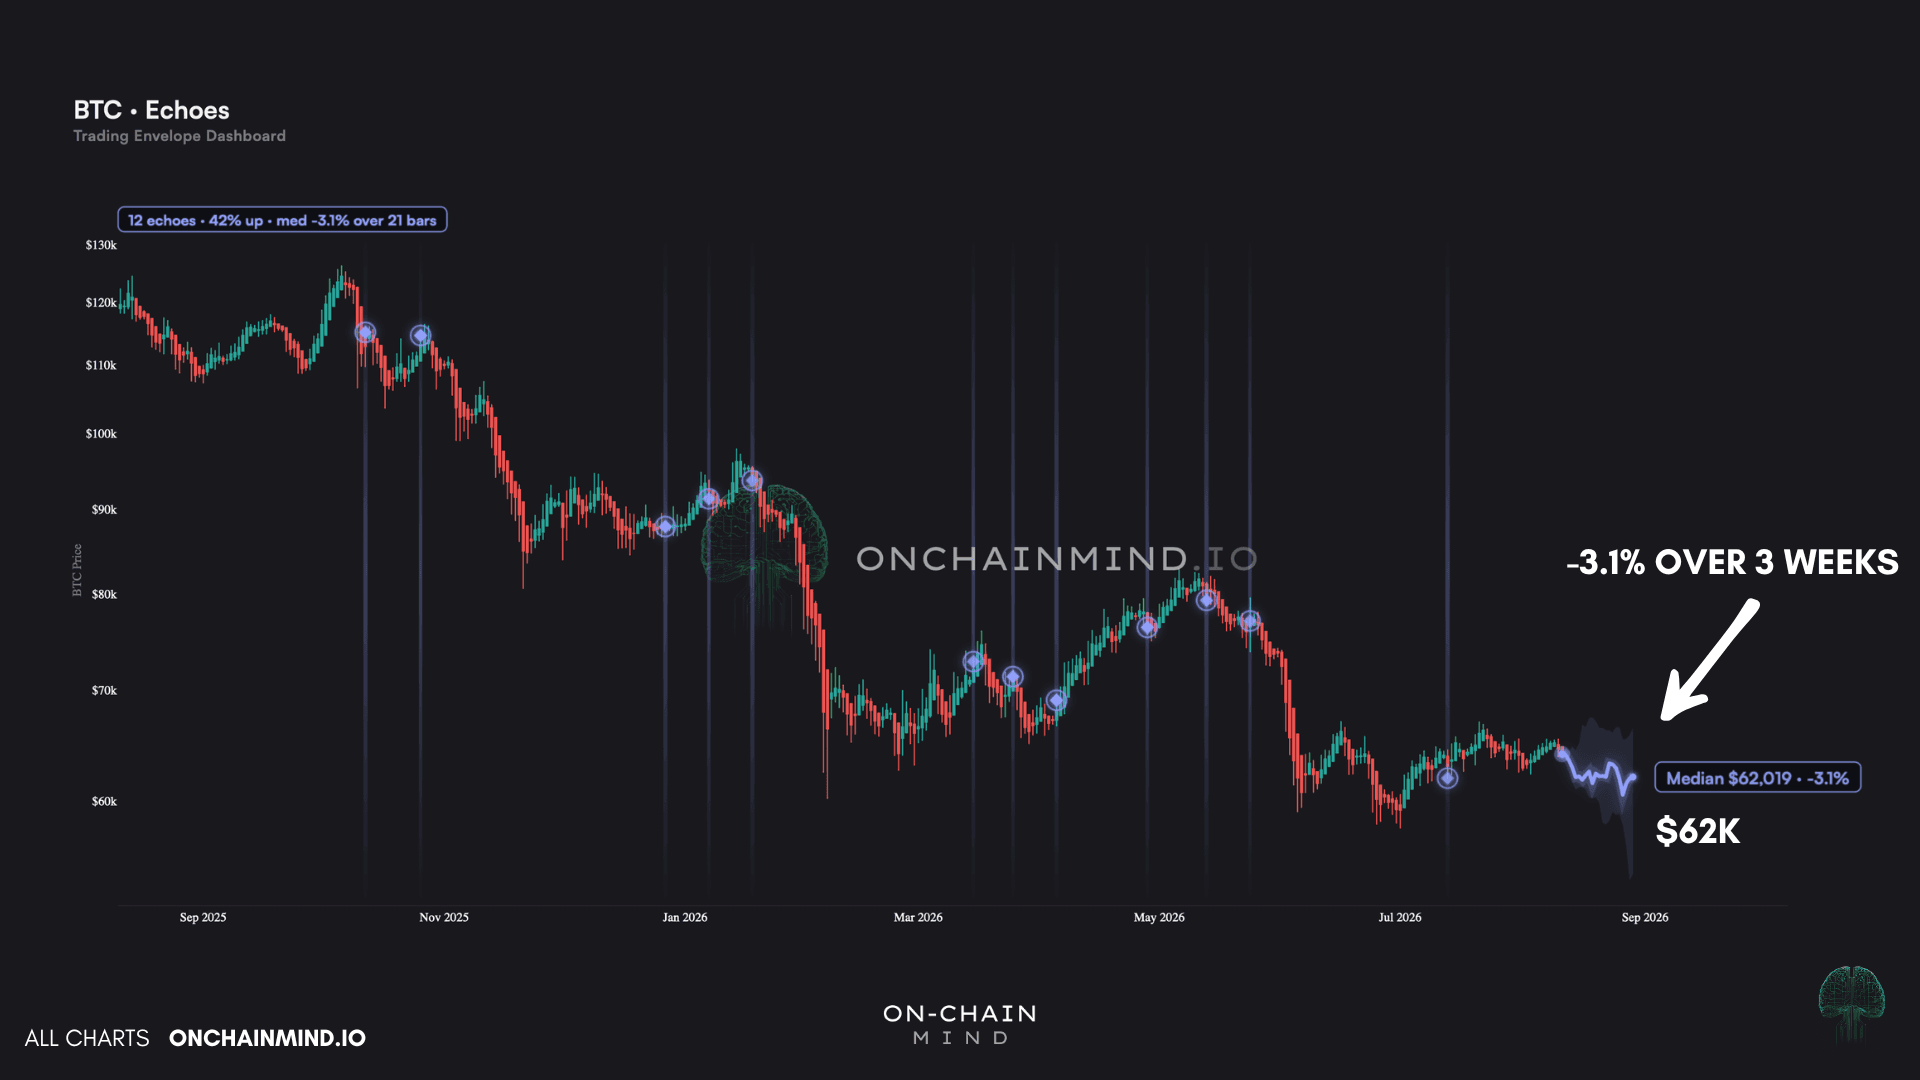
From a TA perspective, for the next few weeks I’m leaning on the Echoes, which is essentially the market’s recent memory.
For this model, we take the current combination of trend, momentum and time, find every past moment in the last year that shared that state, and measure what happened over the following 3 weeks.
These echoes do not have to look alike on a candlestick chart. Two stretches can look nothing alike to the eye yet sit in an almost identical state underneath, and that state is what drives what happens next.
View live in OCM Studio: Echoes
The median outcome right now is a 3.1% decline over the next 3 weeks, taking us to roughly $62,000. Flat to weak essentially.
I’m not using this in isolation, like any of these models here. It is simply there to give an indication of what is likely to be expected given the bearish trend of this past year.
Now the longer-term view, which is more my cup of tea.
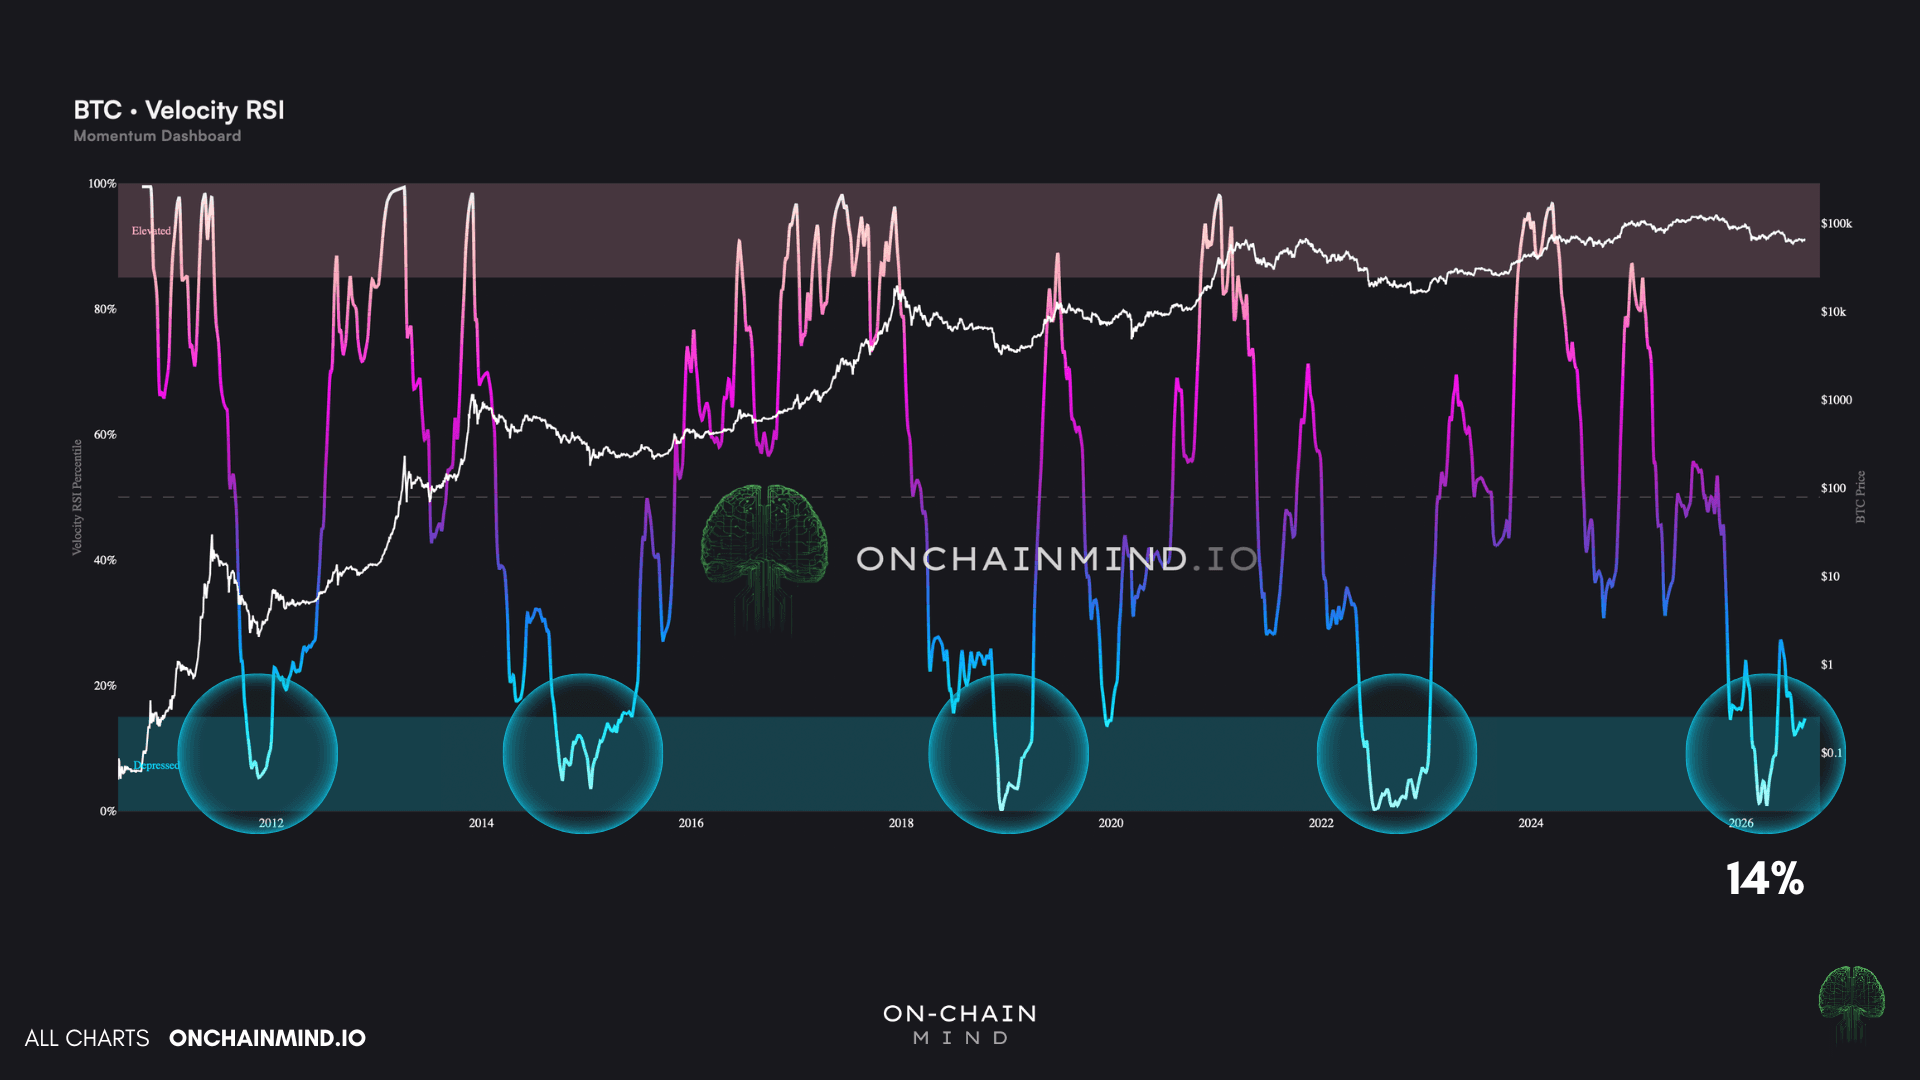
The Velocity RSI is a model we’ve been running for a long time now. It essentially takes the traditional RSI and rebuilds it on directional pressure rather than raw price change.
Instead of asking how big the moves were, it asks how much of that movement pushed consistently one way, which makes trends clearer and stops it chopping in sideways markets.
View live in OCM Studio: Velocity RSI
Whenever the weekly reading drops below its 15th percentile, into the blue box, it has marked every generational opportunity in Bitcoin’s history. And despite the May rally to ~$75,000, we have fallen back into that box and sit just above 14% today.
Backing it up is the 200-week moving average at $63,800, which price is actually sitting exactly on.
That line has compounded at almost precisely 30% a year over the past four years consistently. But that is the growth rate of the floor of this asset, and at 30% a year it doubles roughly every 2.5 years.
But buying at or near it has historically produced far higher compound returns than 30%, because you are buying the growth trend without paying the premium price spends most of its time carrying above it.

View live in OCM Studio: 200-week MA
Always Play Both Clocks
Tactically, and rather obviously, I am short-term bearish, and I do not think there is much room for debate here.
Strategically, my read is actually close to the opposite, and I am comfortable with that.
Momentum is inside a box that has only ever appeared at generational lows, and price is sat on a floor that itself is compounding at 30% a year.
Those two are not contradicting the short-term bearish trend readings we’ve covered. They are answering different questions over different horizons, and holding both at once is the actual skill here.
Here is the distinction I think most people never make. The trend tools are risk management tools. They tell you what the market is doing right now, not what it is worth, and their entire job is to stop you being a hero in the wrong regime.
The likes of the Velocity RSI and the 200-week are valuation tools. They tell you where the market’s historical valuation sits, and they have absolutely nothing useful to say about the next 3 weeks.
Almost every expensive mistake in this asset comes from using one as if it were the other. Selling a generational low because the trend is red is using a risk tool to make a valuation decision.
Buying a blow-off top because the long-term case is intact is the exact same error in reverse.
So I am not trading this tension, I am taking both sides of it.
Short-term, I am not fighting a bearish regime for a potential median outcome of -3.1%, and I am certainly not forcing an entry with nothing stretched to exploit.
Long term, this is exactly the flat, sentiment-dead price action that accumulation is supposed to feel like.
Knowing both clocks is analysis. Knowing how much capital each one gets is the strategy.