
Buying the bear market bottom is supposed to be the hard part. Get that right, and the rest takes care of itself.
Except it doesn’t.
Of everyone who bought the absolute 2022 bear market low, only 22% went on to sell for more than a 2x, and just 11% made it past a 4x.
They nailed the entry when the headlines were at their worst, and most still walked away with scraps.
I’ve tracked every coin bought at every cycle low since 2011, and the pattern doesn't change. So let me show you who really bought the bottoms, what they did next, and what it means if you accumulated near this year’s low.
Let’s get into it.
Key insights
The Floor Is Busy: Capitulation is a mass handover of coins, with 4.11 million BTC accumulated in the 2022 bottom zone.
Most Settle for a 1-2x: Only 22% of 2022 bottom buyers sold above a 2x multiple, and just 11% above a 4x .
The 50% Clock: On average across every cycle, half of all bottom buyers had sold within roughly 210 days .
Early Signs of Patience: Around 78% of this cycle's bottom buyers still hold, and most sellers so far took profit.
Following the Coins From the Floor
The new Bottom Buyers view in the Supply Distribution dashboard does one simple thing:
It tags every coin bought at each cycle low and follows it all the way through to today, recording whether it is still held, and if not, when it was sold and at what multiple.
Defining the bottom matters more than it sounds. Almost nobody buys the exact wick, so if you only measured that single candle, you'd be studying a handful of lucky trades rather than real behaviour.
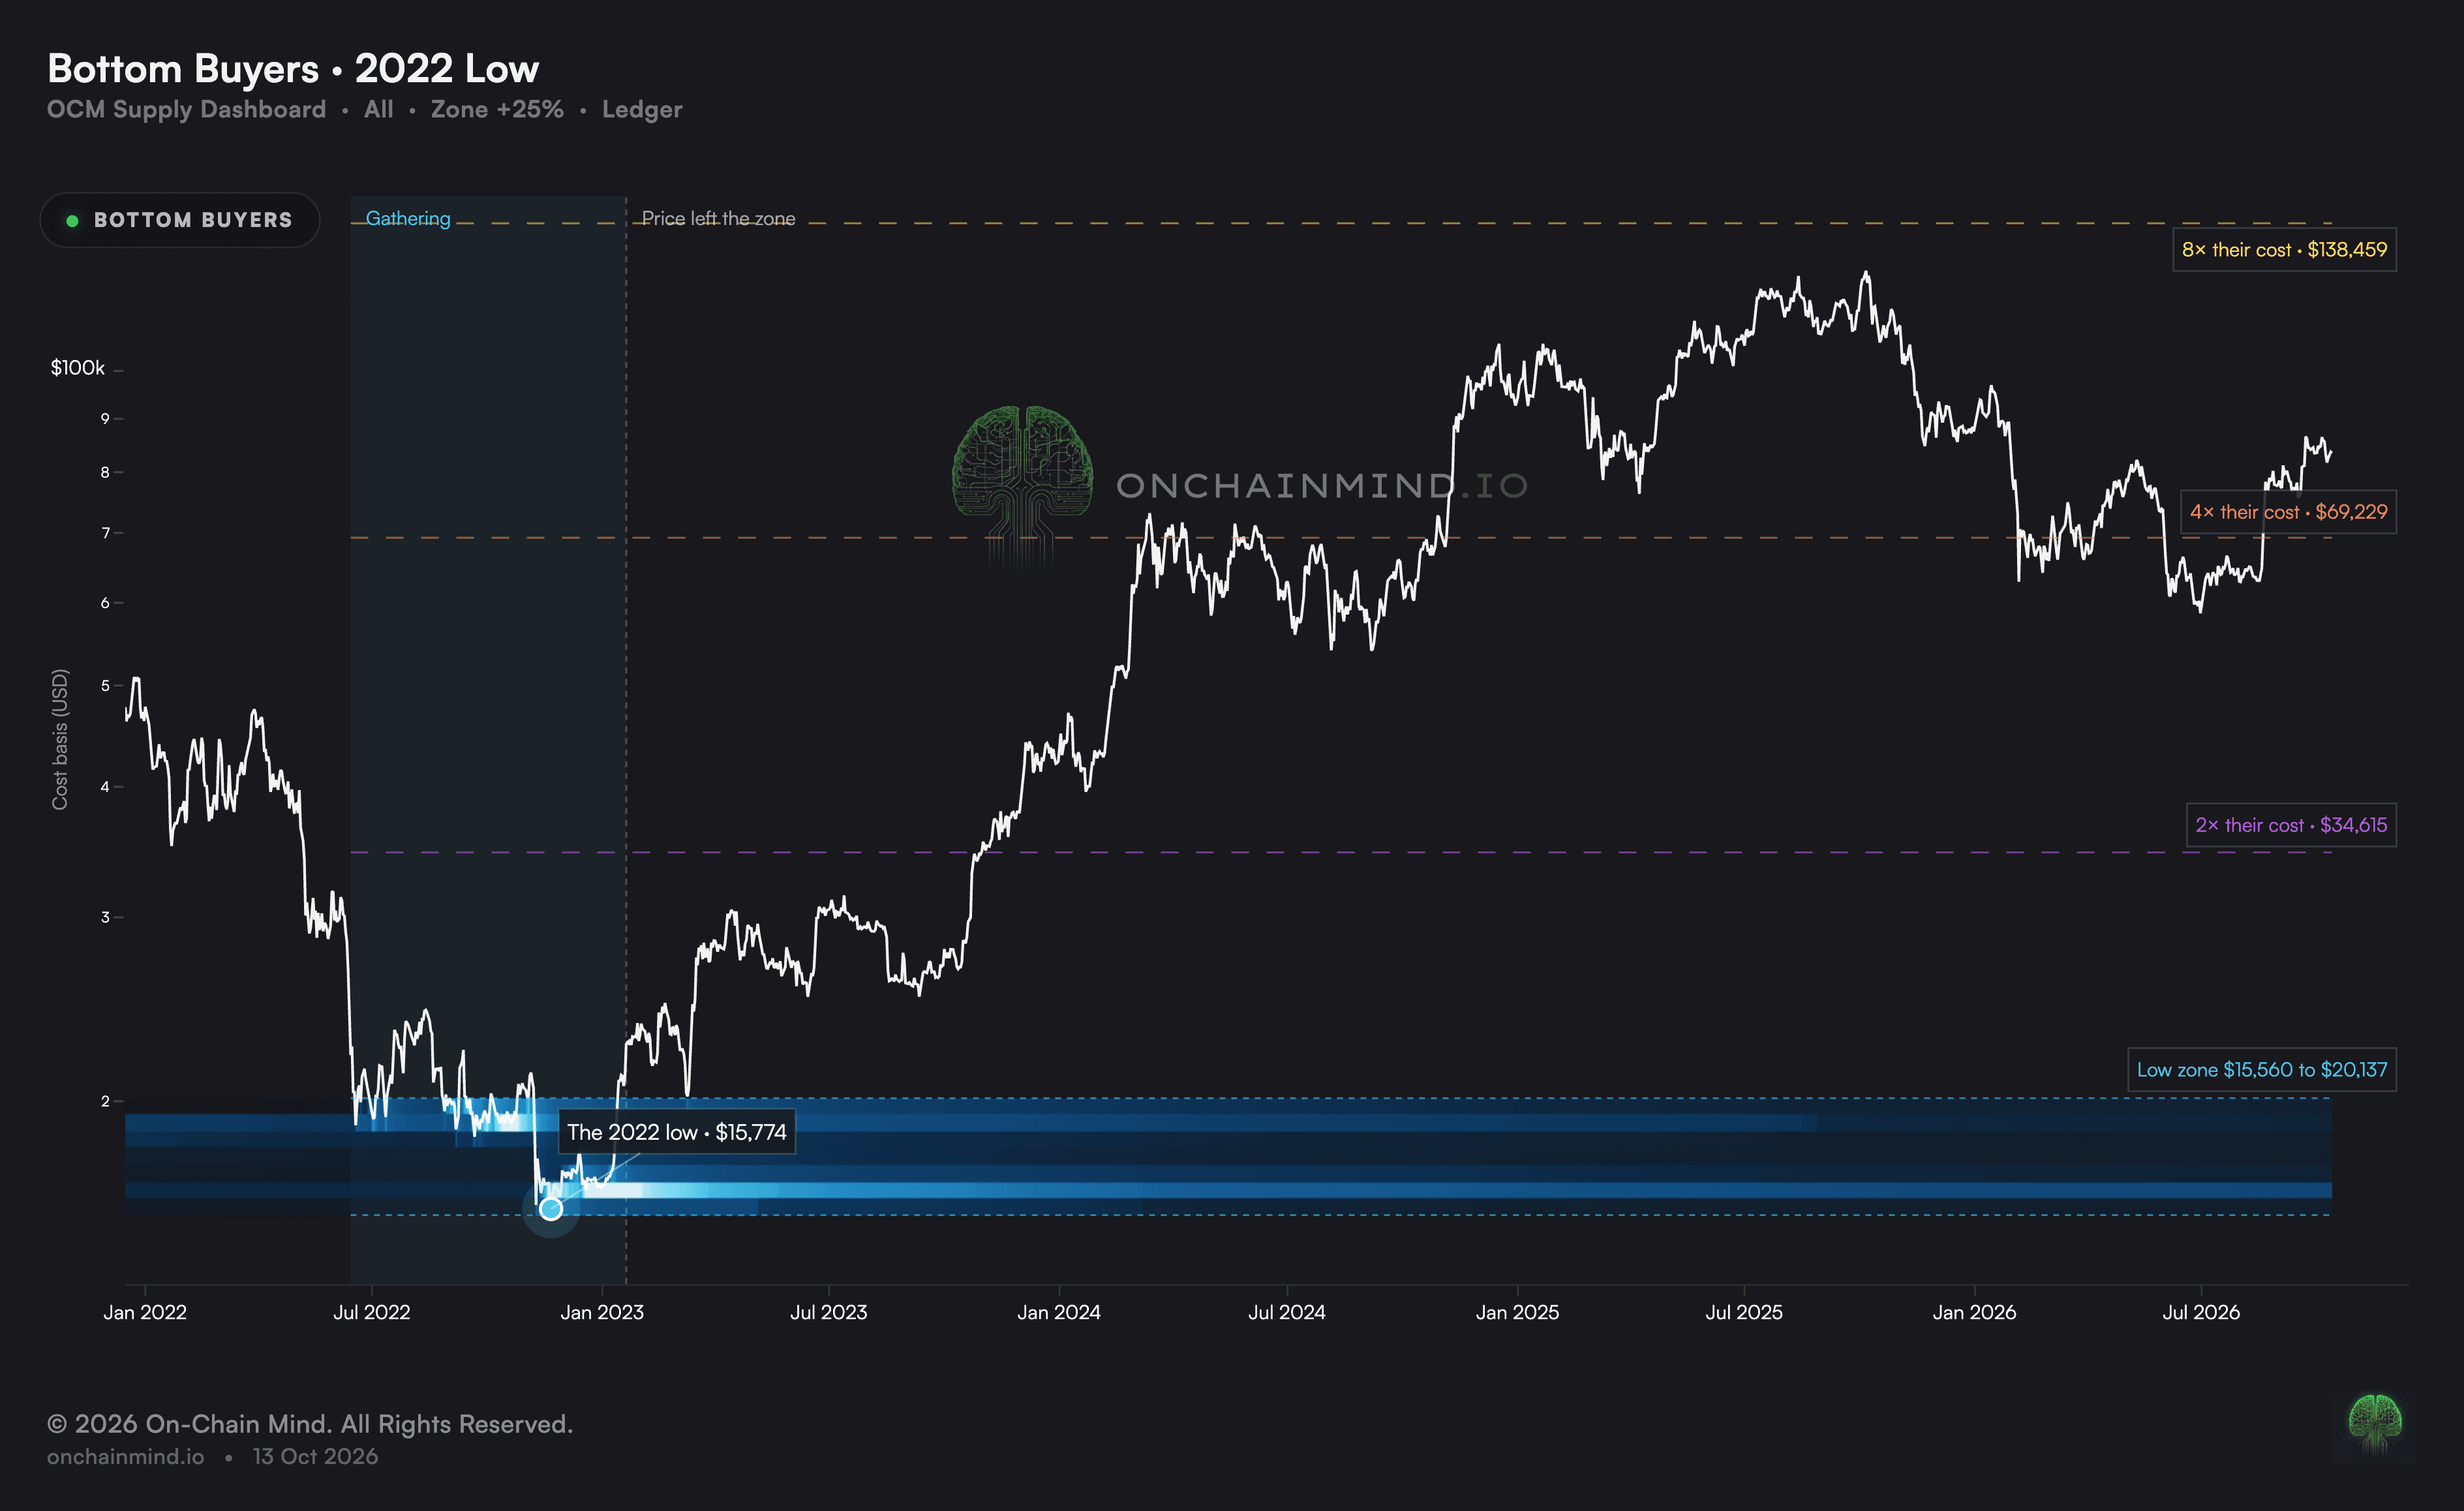
Instead, the dashboard offers three zones, set at 25%, 50% and 75% from the absolute low. Today, I'm using the tightest, the bottom wick plus 25%, which for the 2022 bear market ran from $15,500 to $20,100.
View live in OCM Studio: 2022 Bottom Buyers
And you'll notice that the heaviest accumulation sat right at the very low.
That's no coincidence. Capitulation is, by definition, a huge transfer of coins from people who can't or won't hold any longer to people willing to take the other side, which makes the bottom one of the busiest places in the entire cycle.
Much of that selling isn't really a choice. Leveraged positions get liquidated, miners offload reserves to keep the lights on, and holders who have watched months of gains evaporate finally throw in the towel. Every one of those coins still needs a buyer, and at those prices the buyers tend to be the ones with the longest time horizons and the strongest conviction.
The result is a flood of supply moving from weak hands to strong ones in a very short window, all of it landing at the lowest cost basis of the cycle.
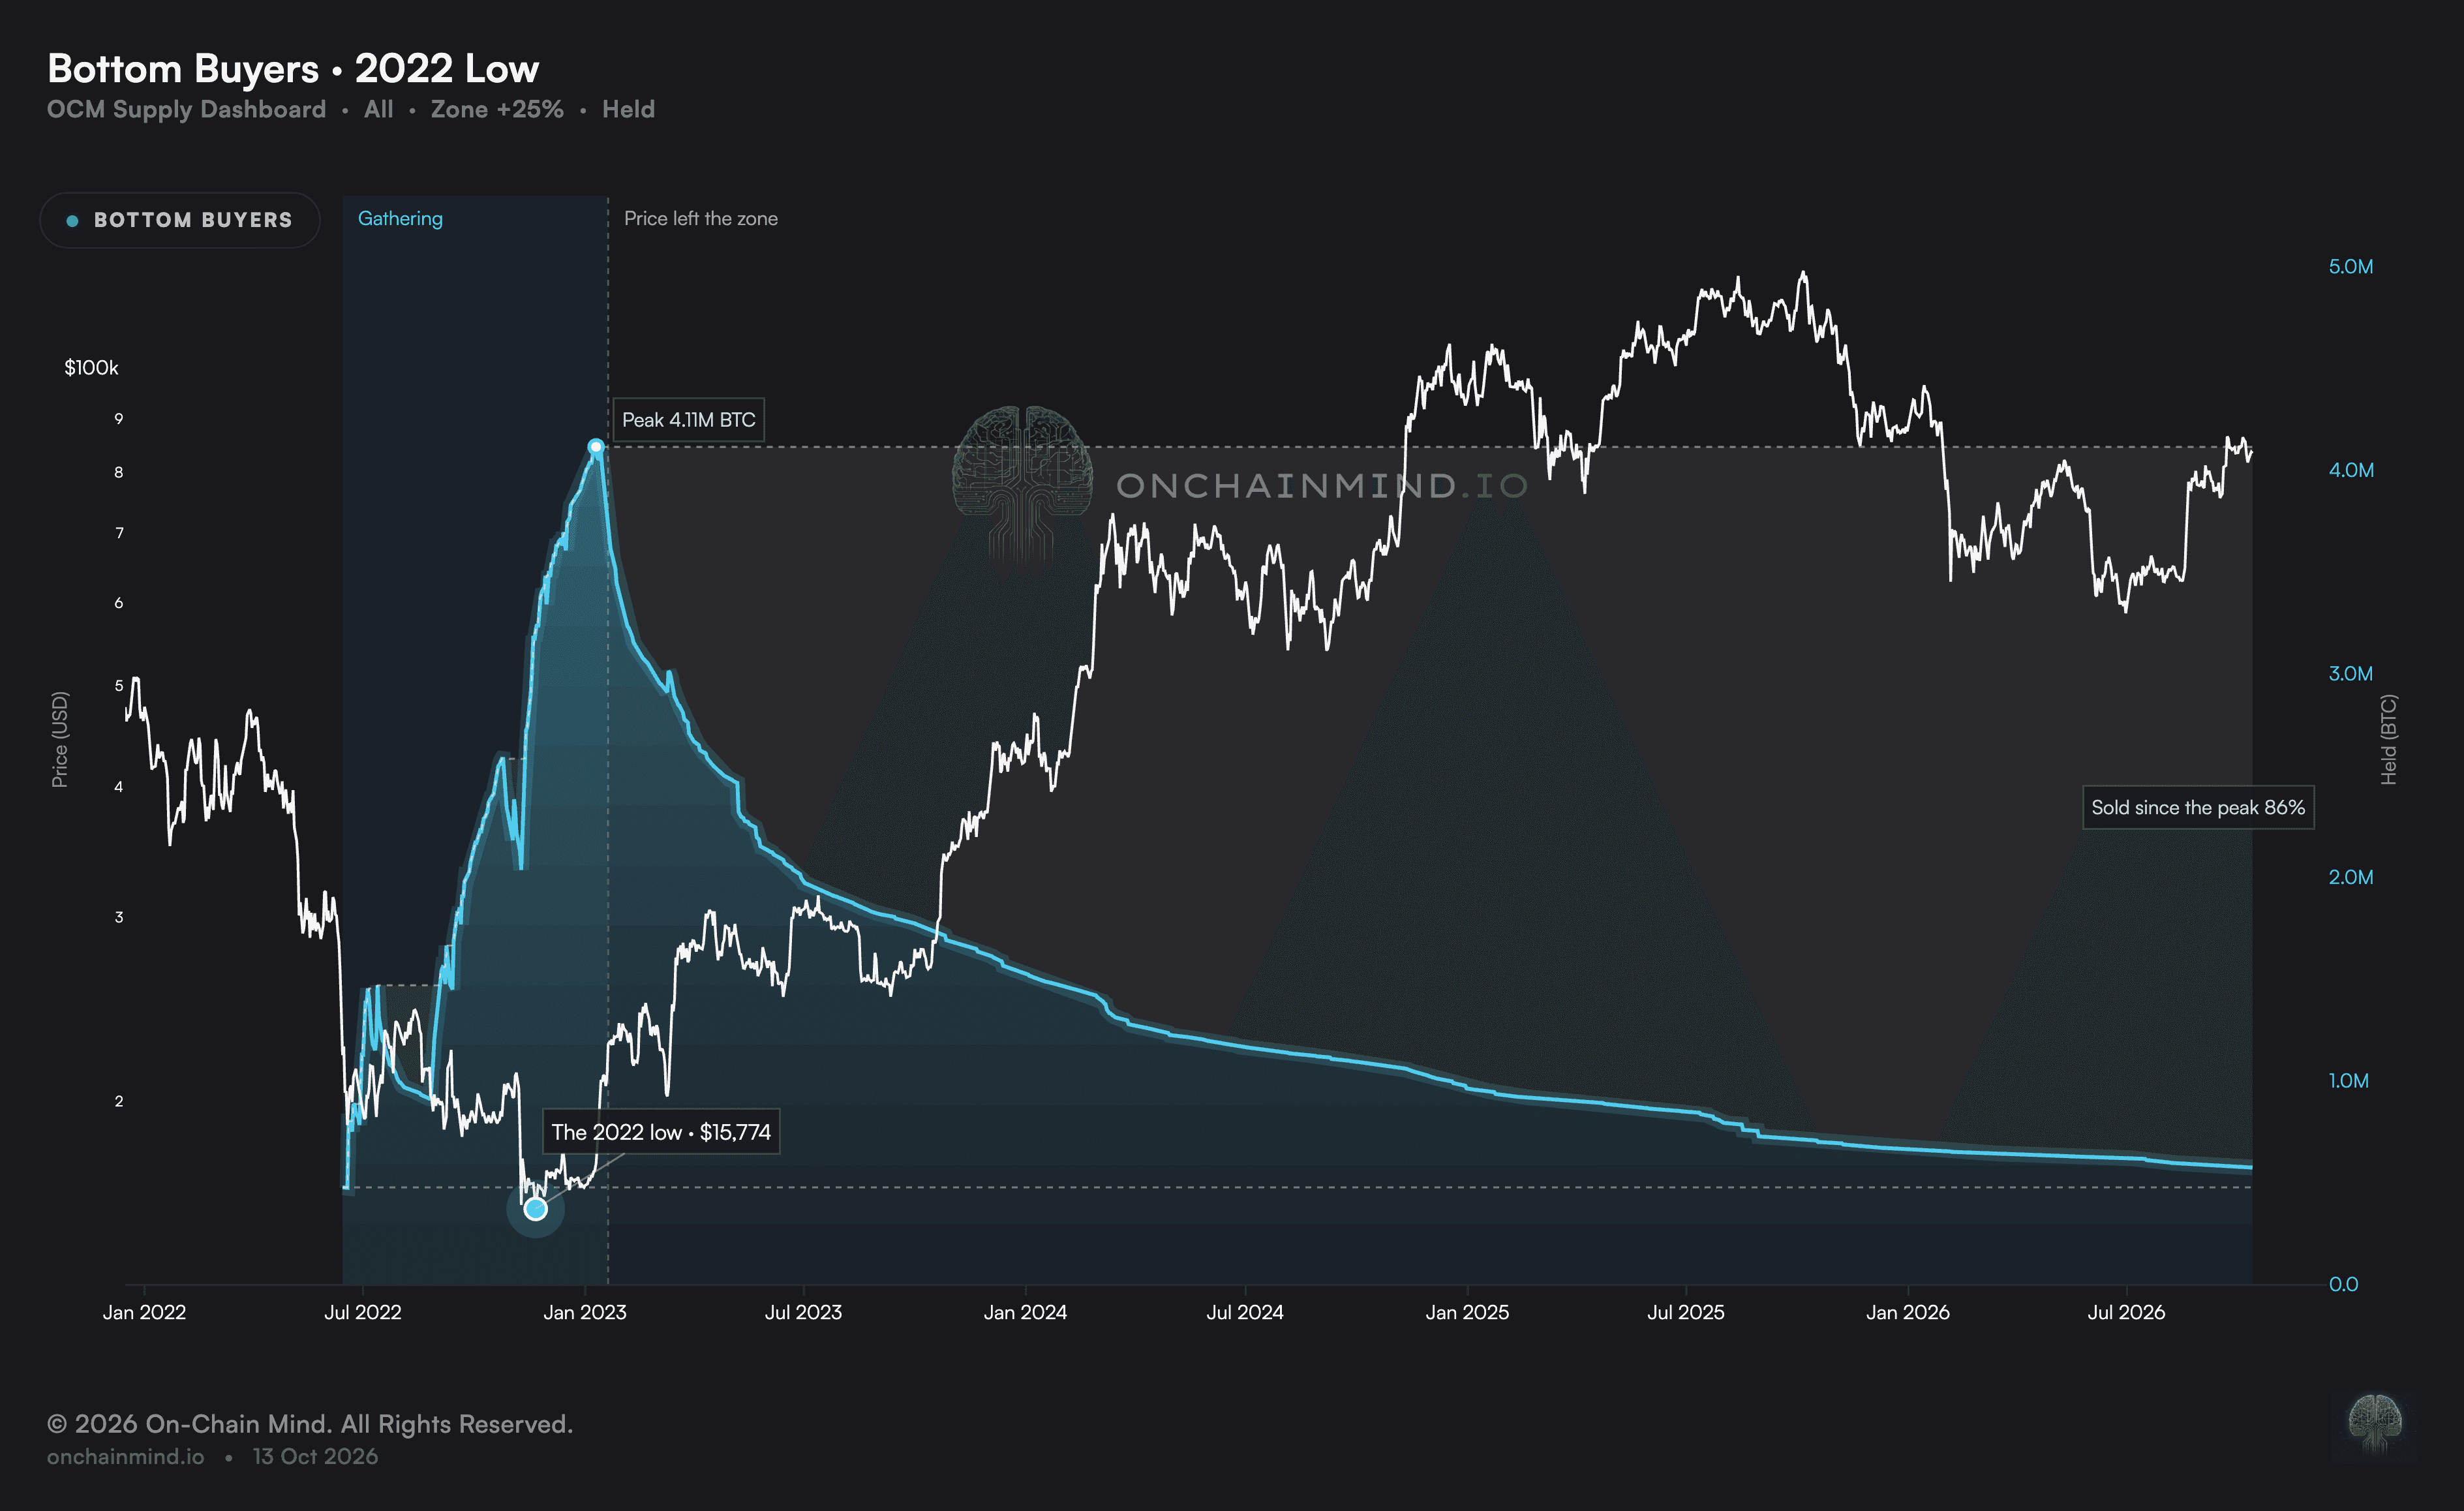
Accumulation in the zone climbed the deeper the bear went, peaking at 4.11 million BTC at the exact moment price began lifting off the floor in early 2023.
View live in OCM Studio: 2022 Bottom BTC Held
Today, only 571,000 of those coins remain unspent. That's just 14%, or roughly one in every seven coins bought at the floor.
The decline traces a smooth curve, with sharp kinks wherever a big rally handed holders a reason to let go. The smooth part is the slow, steady bleed you would expect from any group of holders over time, as life gets in the way, needs change and coins drift into circulation one wallet at a time.
The kinks tell a different story.
They line up with periods of strong price appreciation, when unrealised gains became too large to ignore and holders spent in clusters rather than in a trickle. After each of those bursts the curve flattens again, as if the holders who were ever going to be tempted have already been tempted.
It's a useful reminder that long-term holders don't sell on a schedule, they sell into strength.
Buying the Bottom Is the Easy Part
So what did those bottom buyers actually sell for?
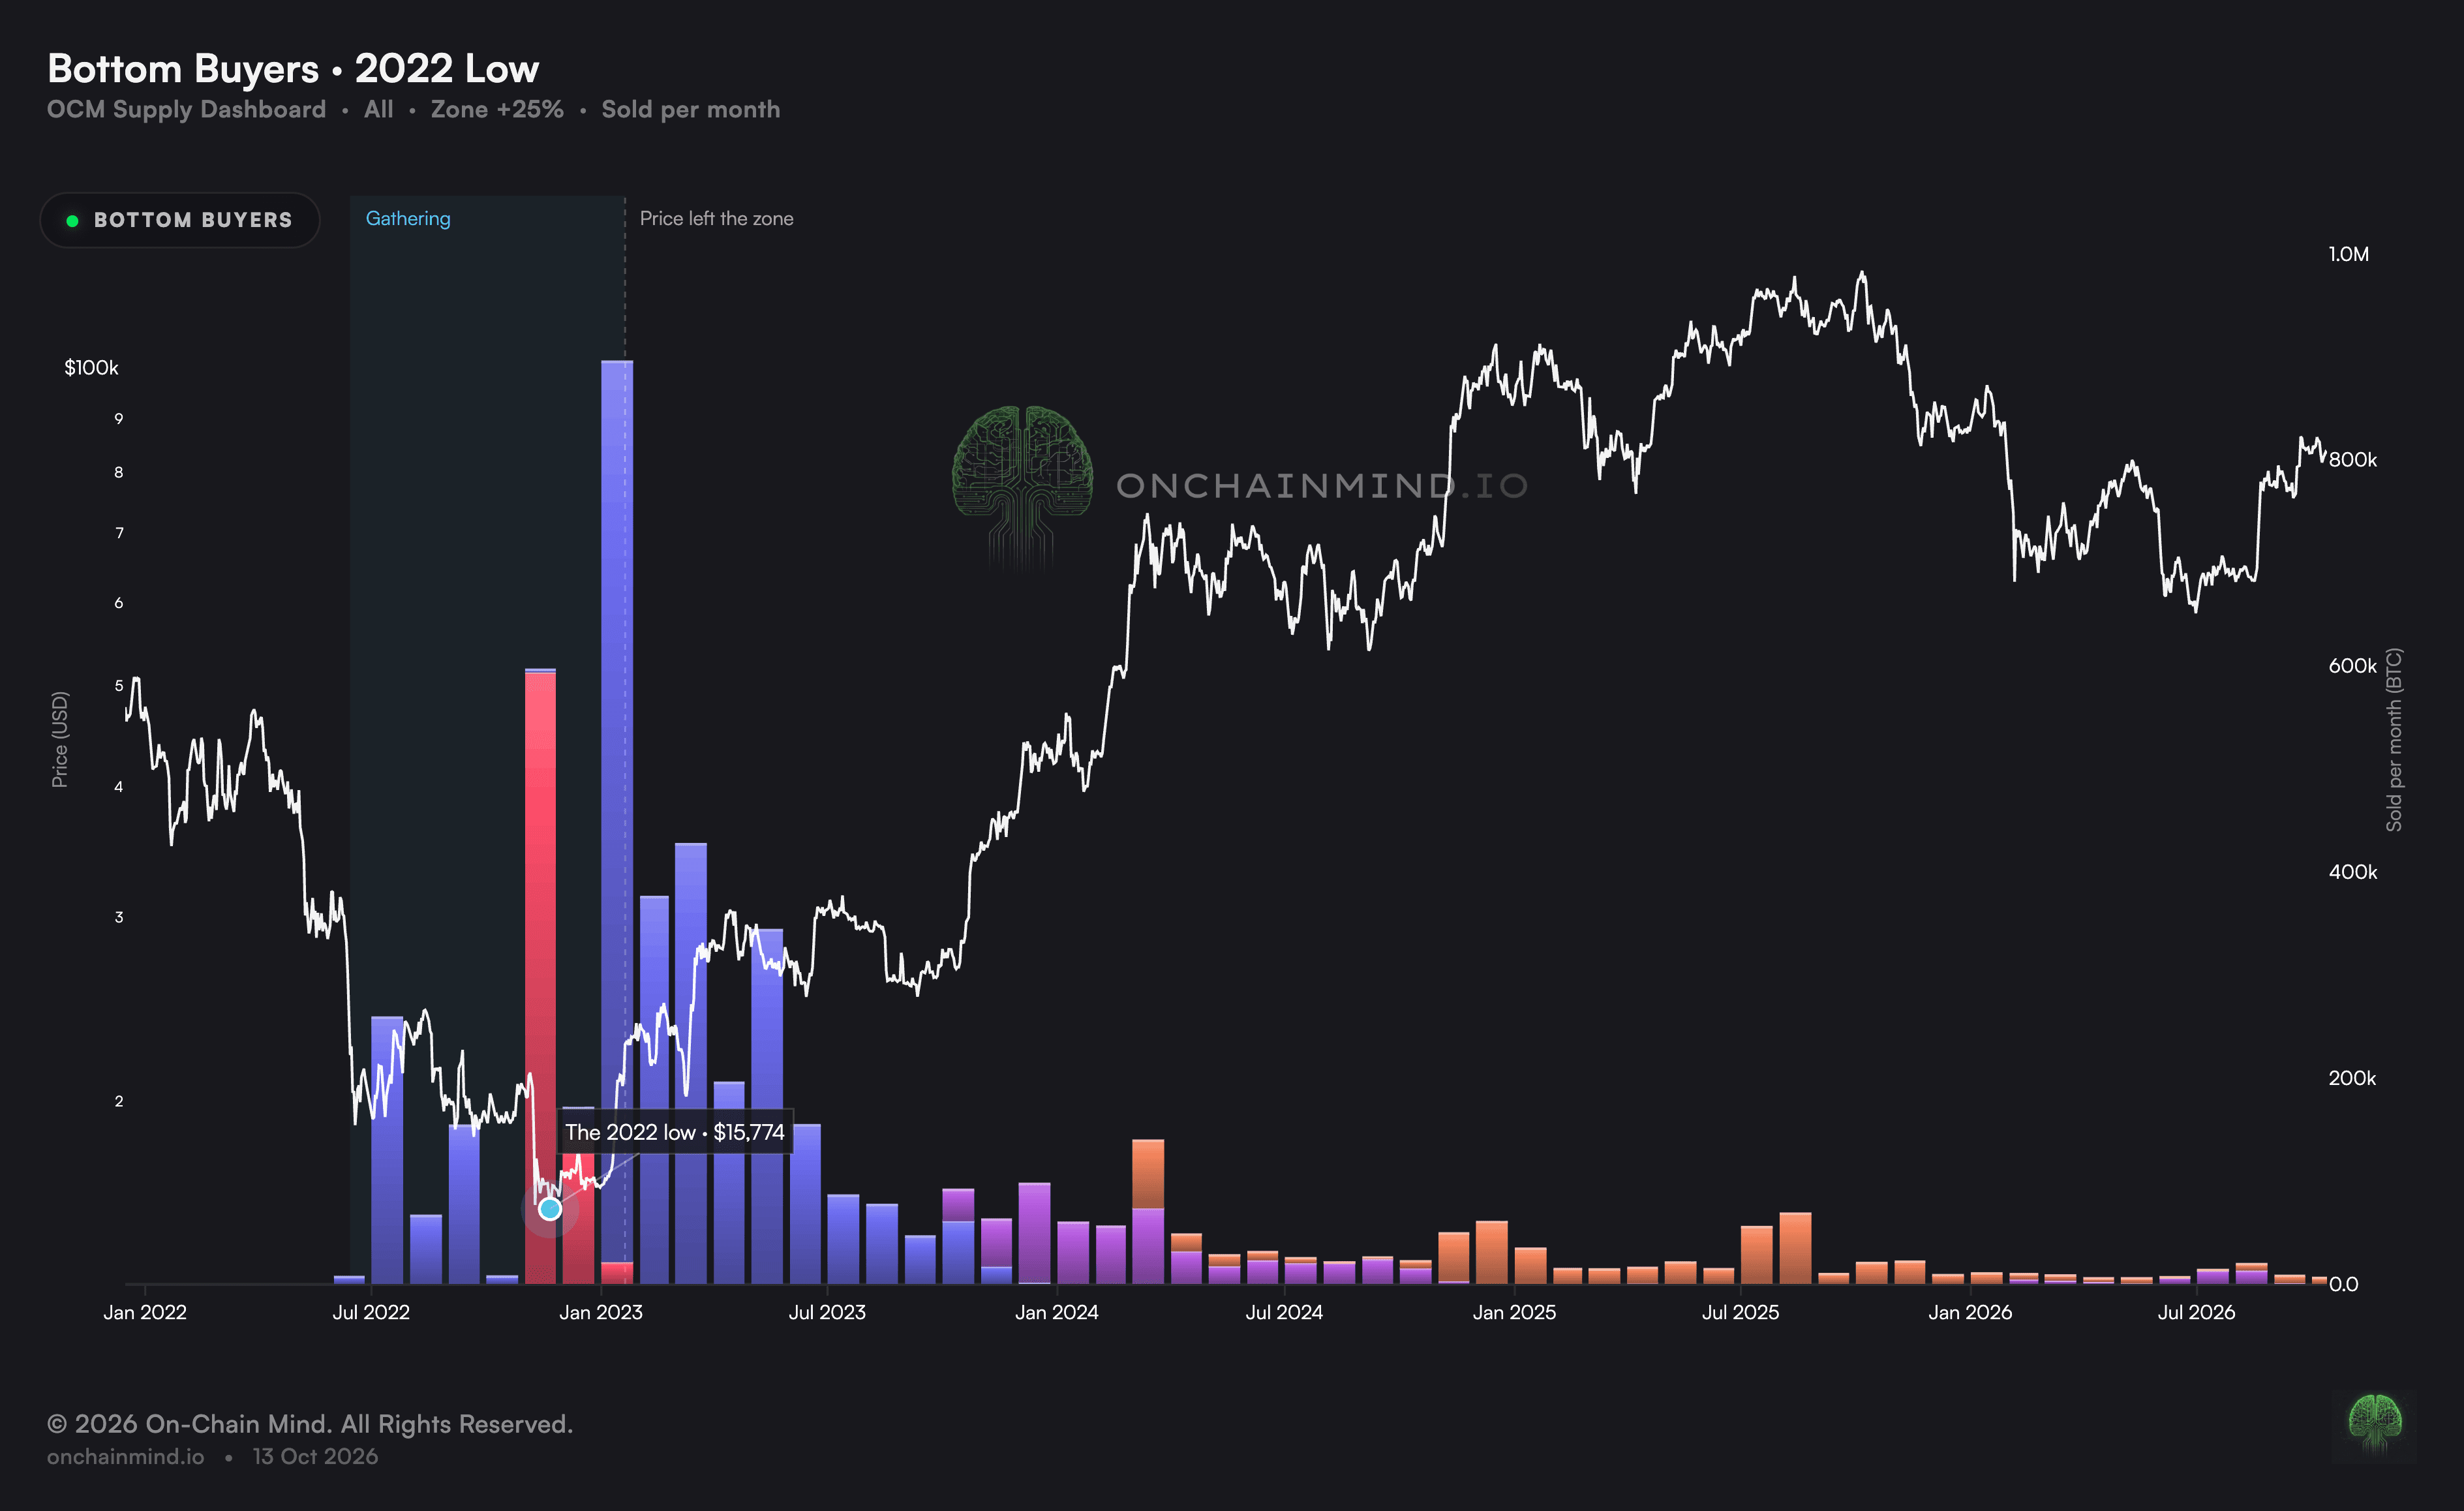
The first sellers didn't wait for a rally at all. During the final leg of capitulation into the November low, hundreds of thousands of coins every week that had been bought in the zone were sold at a loss.
You're looking at people who stepped in when the headlines were at their worst, did the hard part, and then got shaken out right at the very end.
The next wave came as price lifted off the lows. About 63% of the supply accumulated at the bottom, was sold for between a 1x and a 2x multiple.
That's the dominant outcome. Somewhere between breaking even and doubling your money. Not exactly what I expected.
Roughly 550,000 BTC went for a 2x to 4x, and almost exactly the same amount went for a 4x to 8x, clustering around the three major peaks of the last cycle as holders sold into strength.
Which leaves the most striking finding of the study: only 22% of the cohort sold for more than a 2x, and only 11% for more than a 4x.
View live in OCM Studio: 2022 Bottom Sold Per Month
The timing is just as revealing. On average across all cycles, half of the bottom buyers had sold within about 210 days, which for 2022 lands on the 19th June 2023 with Bitcoin at around $26,000.
A respectable gain, sure, but nowhere near what the cycle was about to offer.
Put it in context. The 2022 low came in November, with Bitcoin trading at roughly $15,500 in the aftermath of FTX. Anyone who bought there and sold in mid-June 2023 walked away with something like 68%. In most asset classes that would be an exceptional year. In Bitcoin, coming off a cycle bottom, it was only the opening act.
What followed is the part that stings. Bitcoin spent the rest of 2023 grinding higher, broke through $40,000 before the year was out, and pushed to a new all-time high above $73,000 in March 2024 on the back of the spot ETF launches. By December 2024 it was trading above $100,000. Measured from the November 2022 low, that is more than a six-fold move, and the typical bottom buyer captured only a fraction of it.
I want to quickly mention why this happens, because it is not stupidity. Buying at the bottom takes conviction at the exact moment the market has none, and that conviction is usually tested hardest once the position is in profit.
After a brutal bear market, a 60% gain feels like vindication. The temptation is to bank it before the market takes it away again, and mid-2023 offered plenty of reasons to do so, with price chopping sideways and macro headlines doing little for confidence.
So the bottom buyers did the hard part. They just did not stay for the part that paid.
That is the real lesson here. Spotting the bottom is only half the job. The money is made by sitting through the boredom that comes after it.
The Same Fingerprint, Cycle After Cycle
You might assume that 2022 was simply a quirk of one particular cycle, but it wasn't, and the earlier cycles tell exactly the same story.
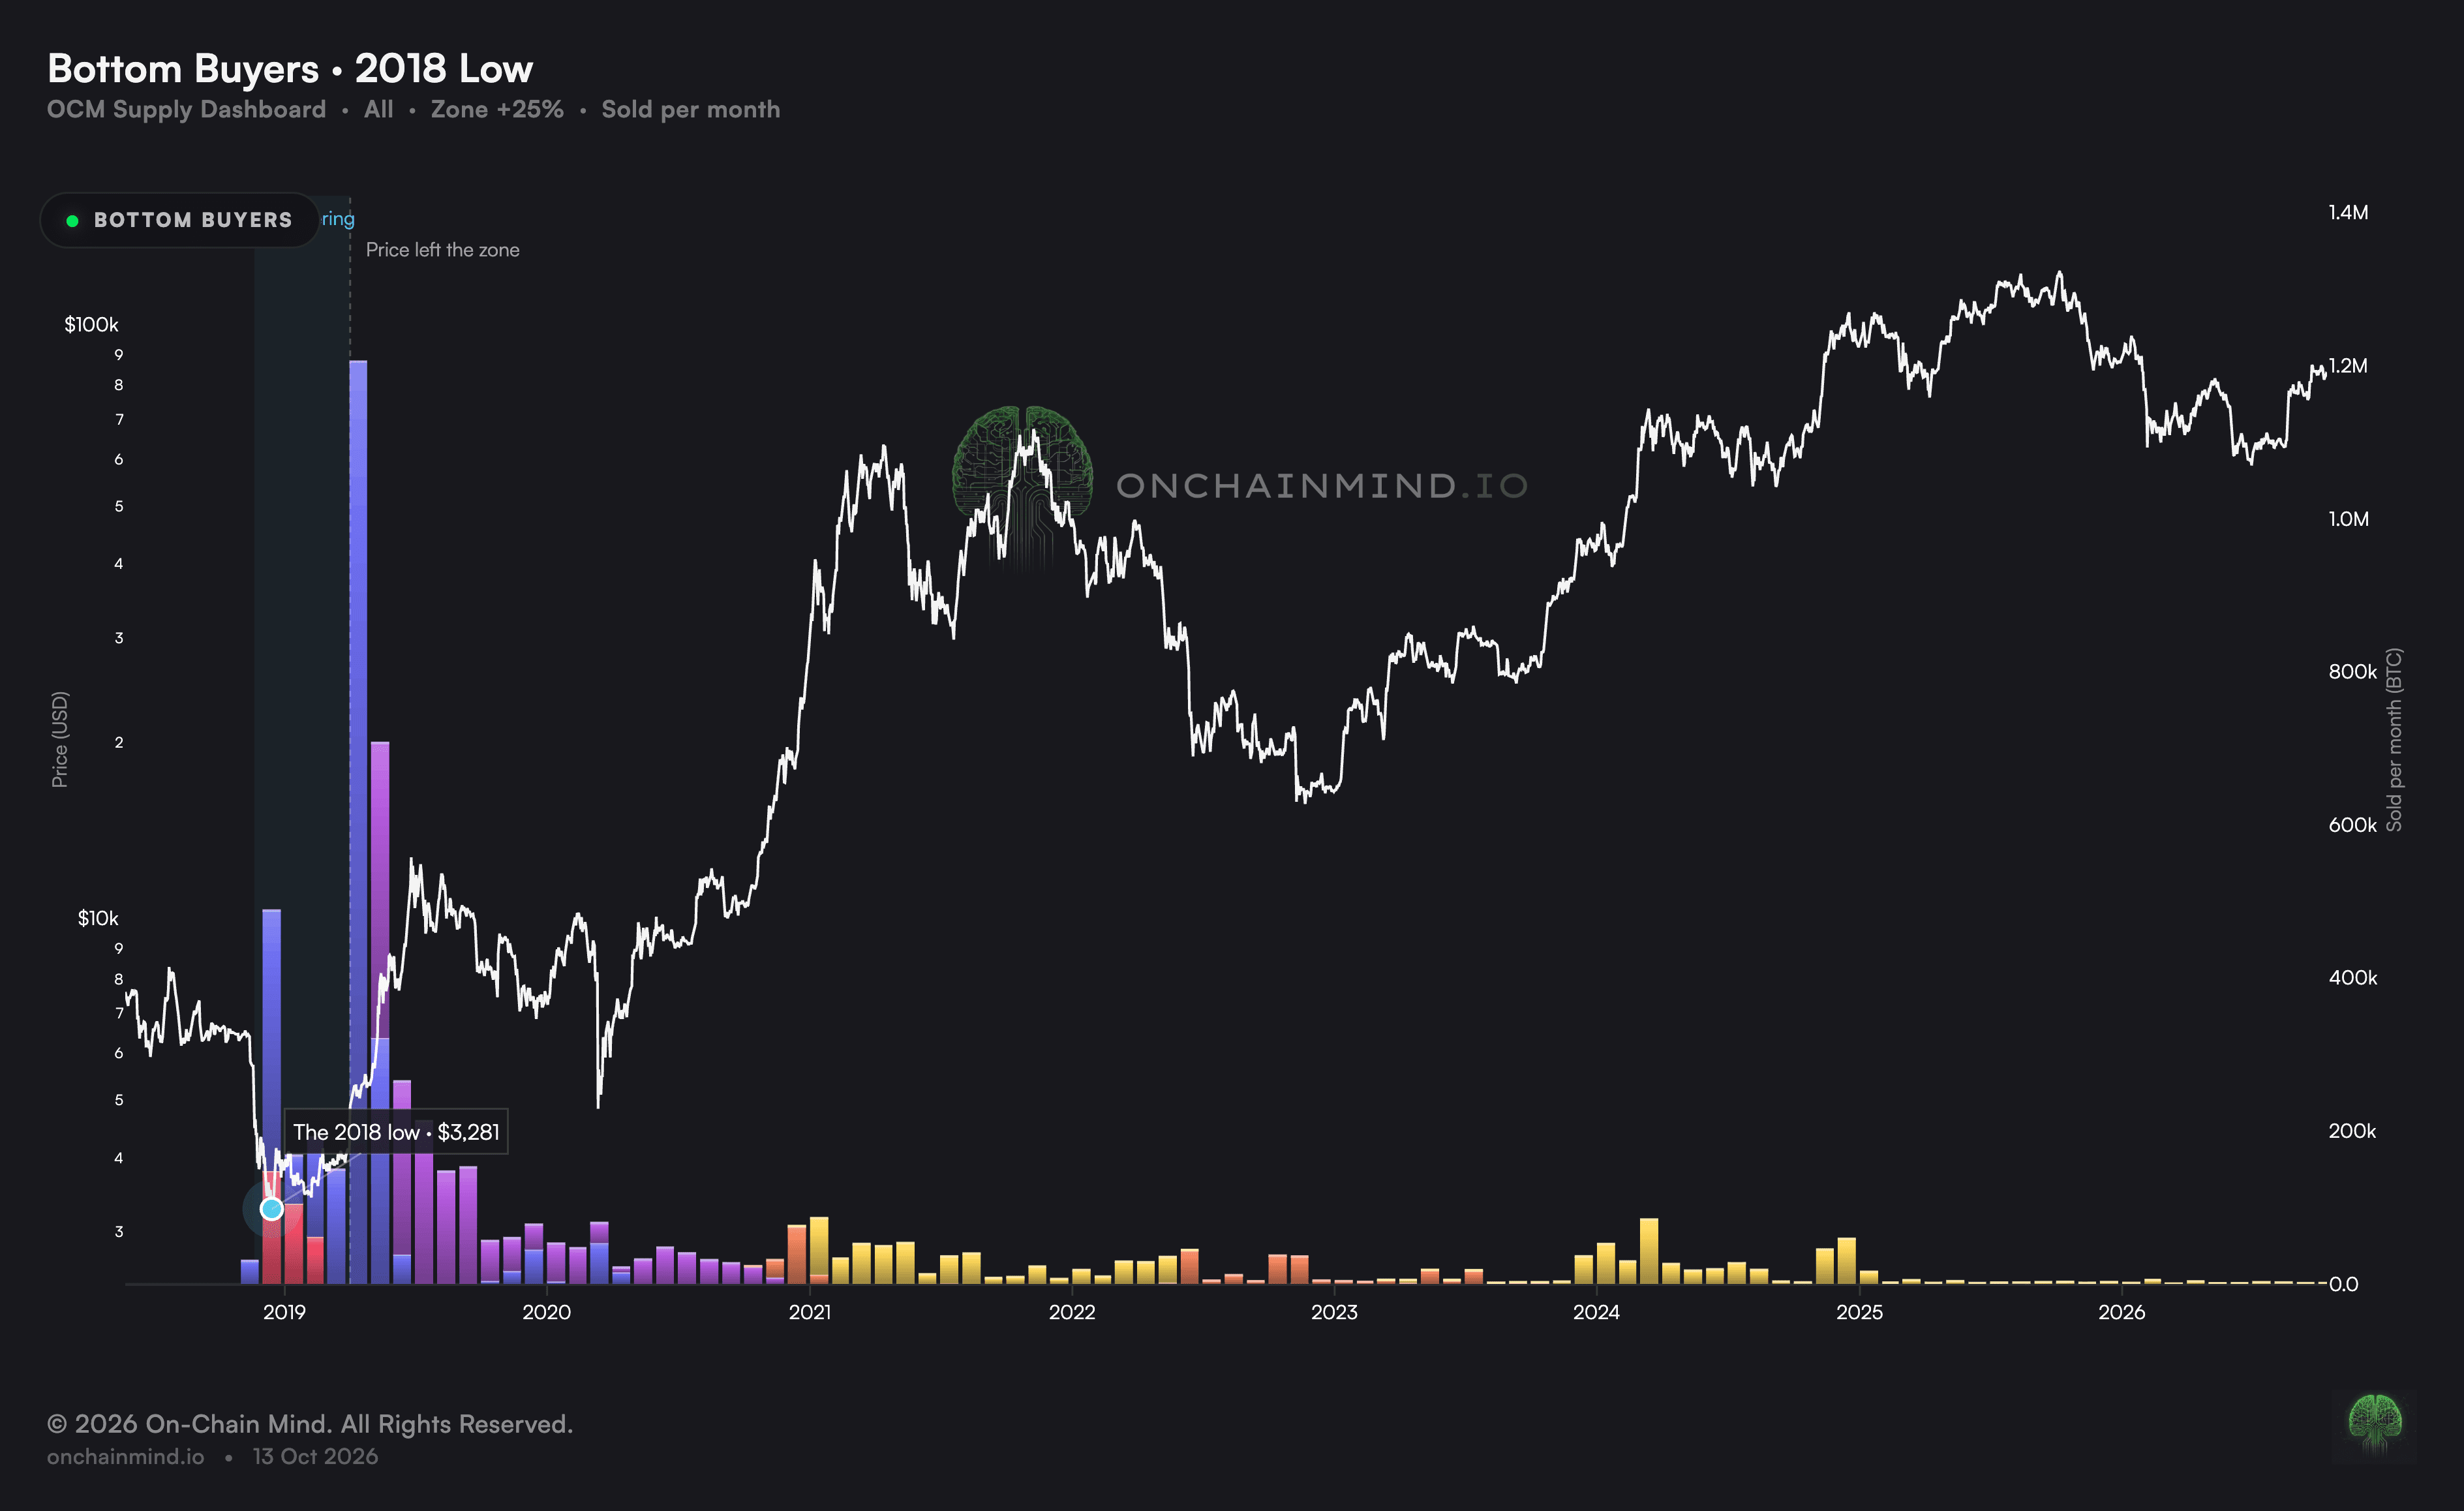
Take the 2018 low, where coins were accumulated between about $3,200 and $4,100. Once again the biggest bucket was the 1x to 2x range, with about 43% of that supply let go there, so a large share of those buyers sold before they had even doubled their money.
View live in OCM Studio: 2018 Bottom Sold Per Month
The people were different, the market structure was different and the narratives driving the price were different, yet the outcome was the same.
Much of the rest sold for a 2x to 4x into the 2019 mini bull, and by roughly the peak of that move, half of the 2018 bottom buyers had already sold. They did well, of course, but in taking those profits they missed the exponential rally that followed.
And that's the part that stings, because the patient minority who held on did spectacularly. Over a million coins, or 18% of that supply, were sold above an 8x, with the biggest spikes coming at the 2021 top and then again on the rallies to $70,000 and $100,000.
About 6% still hasn't moved at all, which points to either iron conviction or keys lost on a hard drive somewhere back in 2019. My view is that it's a mix of both, though nobody can reliably prove it one way or the other.
Go further back to the 2011, 2013 and 2015 lows and the remainder is even smaller, with only about 1% to 3% of that supply still unspent.
So across every cycle we can measure, the pattern holds. Most bottom buyers sell early, a smaller group holds on long enough to sell into the big rallies, and a tiny remainder never moves at all.
In other words, the weakest hands leave first and leave fast, and what's left behind gets progressively stickier as time goes on.
Time Is the Edge Most People Waste
If you believe the $58k capitulation this summer marked this cycle's low, and apply the same 25% range, the bottom zone runs from around $58,600 to about $75,800.
And the early fingerprints of this bull already look familiar. They match every previous cycle: a little distribution on the way up, a final capitulation that shook some bottom buyers out at a loss, then mild profit-taking as price climbed off the lows.
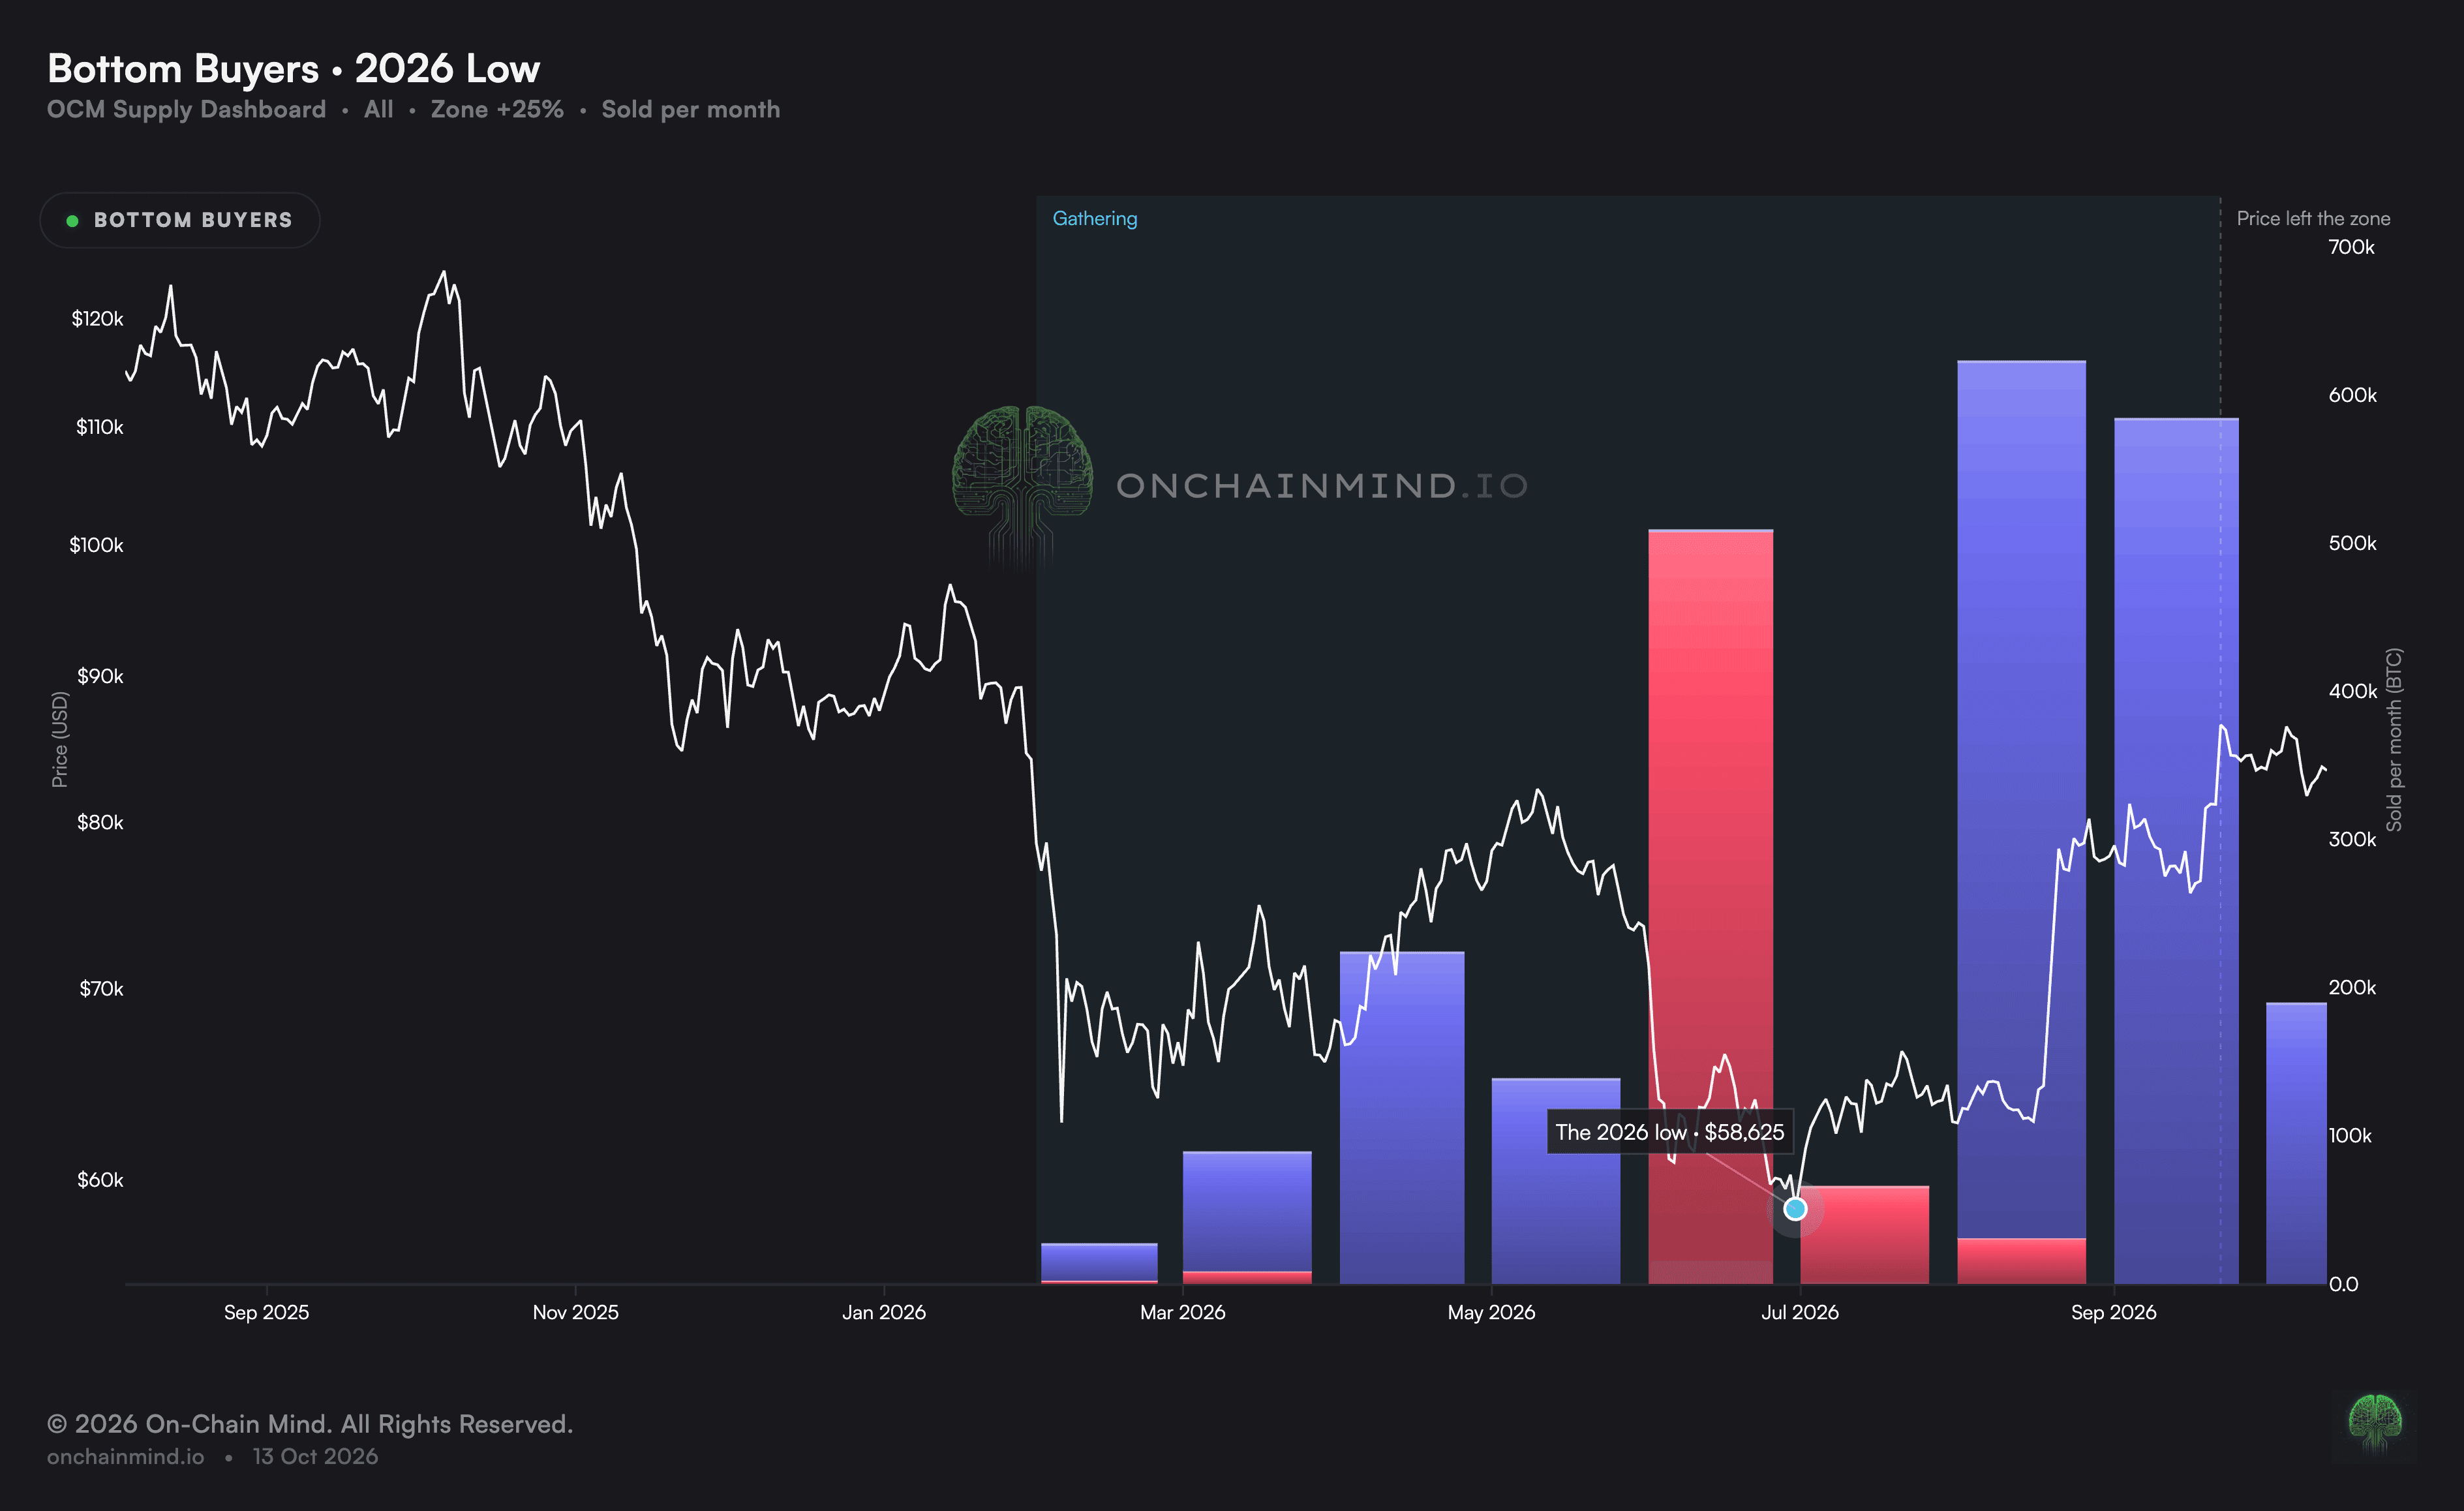
View live in OCM Studio: 2026 Bottom Sold Per Month
So what does that mean if you bought in that zone? History gives you roughly a 50% chance of selling before the January 2027.
That isn't a prediction about you personally. It's simply what the data shows. But if you behave like the average bottom buyer, you'll probably let go far earlier than you think.
There is a more hopeful reading, though. About 78% of this cycle's cohort is still actually holding, and of those who have sold, 75% did so at a profit versus 25% at a loss.
It's early, and I'm wary of reading too much into a few months of data. But still, I can't help wondering whether this cohort is finally getting smarter.
As for me, we're nowhere near the overheated territory where I'd even consider taking profit, so my coins aren't going anywhere.
But certainly what I've learnt from this study is that buying the bottom is one skill. Sitting still through the rally that follows is another entirely, and the data says most people are likely to only achieve the first.
Time shapes the outcome of every decision you make in this market more than anything else. So zoom out. It's probably the most powerful tool in your toolbox, and the one most people put down far too soon.