
Most of the time, I live comfortably in the world of macro and on-chain data. It’s slow, deliberate, and ruthlessly effective. But every so often, the short-term starts to matter. Not because it changes the long-term thesis, but because it reveals how the market is behaving right now.
This article takes a deliberate step away from my usual macro-heavy framing. Instead, we zoom right in and examine Bitcoin through the lens of short-term positioning, regime awareness, and advanced mean-reversion tools.
The aim is not to predict the future, but to understand the structure of risk and opportunity as it currently exists.
Key insights
Macro Regimes Still Rule Everything: Short-term trades only work when framed inside the correct macro environment.
Our Line In The Sand Matters: The 100k regime divider isn’t just psychological, it’s structural and dynamic.
Mean Reversion Is Not Bullishness: Extreme downside moves often snap back without changing the broader trend.
The Next Floor Is Closer Than It Looks: We identify the next major structural support zone after the failing of the previous local level.
Start With the Regime, Always
Any good short-term analysis starts in the exact same place as long-term investing: the macro regime.
This is where most traders go wrong. They try to scalp, trade, or position without understanding what type of market they’re in. Trends behave differently in bullish regimes than they do in bearish ones, and mean-reversion works very differently depending on that backdrop.
The cleanest way I know to define Bitcoin’s macro regime is the Bitcoin Regime Divider. Now this is simple, but deceptively powerful:
Red indicates a bullish regime
Green indicates a bearish regime
The divider itself is derived from Bitcoin’s yearly moving average, a level that has done a remarkable job of separating bullish and bearish environments throughout Bitcoin’s entire history.
And when I say remarkable, I mean it. There is very little ambiguity on the chart. Bitcoin has spent long, sustained periods either clearly above or clearly below this line (minus the Covid black swan), and those periods align uncannily well with broader market behaviour.
Right now, we are sitting in the 5th bearish regime Bitcoin has ever experienced.
The current dividing line where regime opinion would begin to change sits at $100,000. That’s a level we have talked about a lot recently, and it moves constantly as the yearly average evolves. But at present, any sustained price action below that level should be treated as macro-bearish by default.
That does not mean price cannot rally. It does not mean volatility disappears. It does mean that upside should be treated sceptically, and risk should be managed aggressively.
Until Bitcoin reclaims that regime divider, the market remains lean-bearish. That is the framework within which all short-term positioning should be evaluated.

Mean Reversion in a Bearish Environment
Once the macro regime is defined, we can safely zoom in.
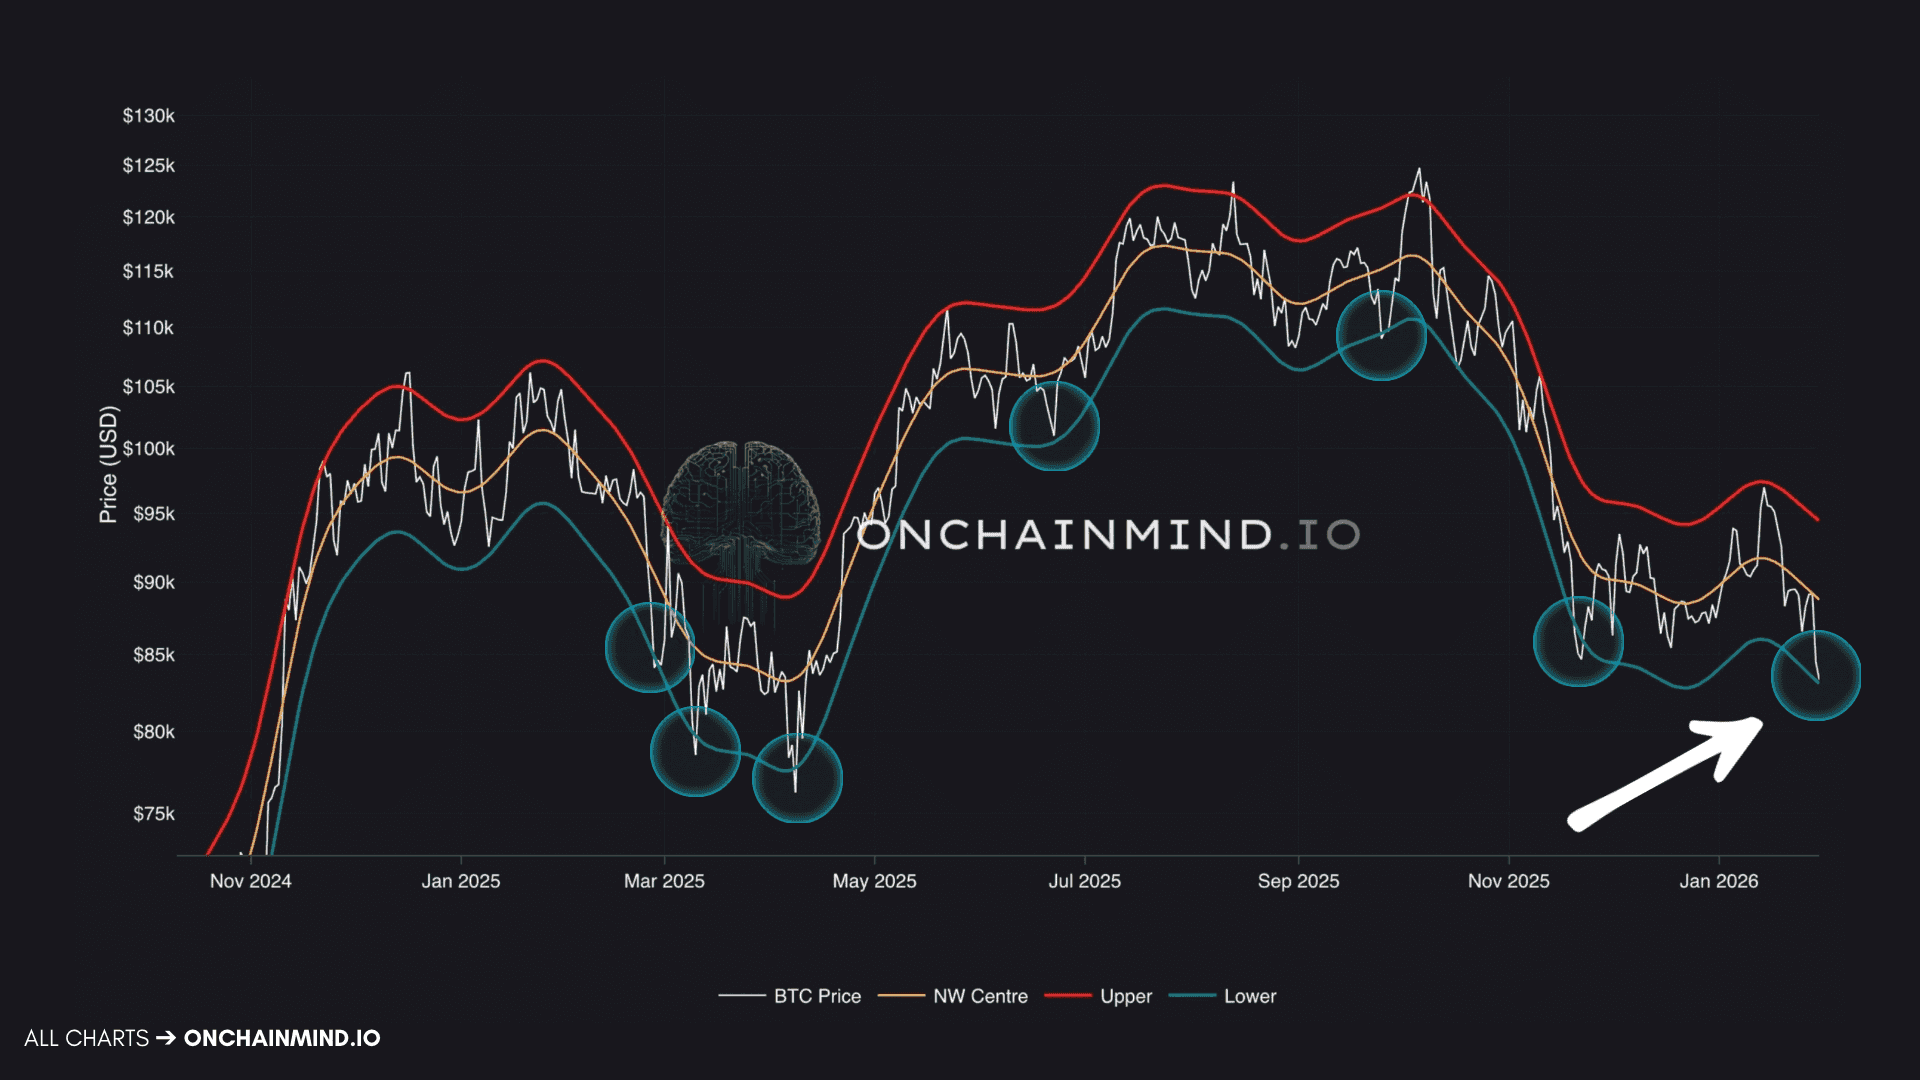
For short-term trading and scalping, one of the most effective tools available is the Nadaraya-Watson Z-Envelope. This is not a traditional indicator, and it is not a moving average dressed up with fancy language.
It is a refined volatility and mean-reversion model built on non-parametric regression, specifically the Nadaraya-Watson estimator using Gaussian weighting.
In plain terms, it creates:
A dynamically smoothed central price line
Upper and lower adaptive bounds
Envelope behaviour that responds to localised volatility
The result is a structure that highlights statistical overextension with remarkably low lag.
Right now, Bitcoin’s price is touching the lower envelope, which is sitting around $83,000. That is not common.
Price frequently approaches the envelope boundaries, but actual touches or breaches of the upper or lower band are rare. When they occur, it usually indicates that the preceding move was extreme relative to recent volatility. This is classic mean-reversion territory.
The centre of the envelope, currently near $88,000, represents the dynamic mean around which price tends to oscillate. While its calculation is complex, you can think of it loosely as a volatility-aware, adaptive equilibrium level.
However, let’s get it straight: a mean-reversion bounce is not bullish.
In bearish regimes, price often rebounds from the lower envelope towards the centre, and sometimes even towards the upper envelope, while the entire structure continues trending downward.
That is exactly what we’re seeing now. The envelope itself is falling. The upper bound has dropped from roughly $97,000 to $94,000 in just a couple of weeks. That alone should temper expectations.
Bitcoin does not move vertically without significant macro catalysts. Expecting sustained price acceptance above $90,000 in this environment is optimistic at best. Without a major macro shock, it’s simply a tall order.
From a trading perspective, that gives us clarity:
The envelope centre acts as a naturally neutral zone
$90,000-$92,000 becomes a no-brainer short-term profit-taking region
Any move into that area should be treated tactically, not emotionally
This envelope allows us to operate both short and long positions within a downtrend, rather than fighting it or pretending it doesn’t exist.
Structural Support and the Importance of the Next Floor
Mean reversion tells us where price wants to go. Structural analysis tells us where it might stop.
Continue reading with OCM Premium
You have been reading the free preview of this article. The rest of it (about 500 more words and 1 more chart) is for OCM Premium members. See OCM Premium plans.