
For 6 weeks, Bitcoin sat trapped in a $5,000 range with volatility compressed to some of the lowest readings on record.
We flagged that compression last week, and the honest truth is it never tells you the direction, only that a violent move is loading somewhere close by.
The direction came from positioning:
A macro catalyst out of the US Treasury
A technical breakout into the densest pocket of stacked short liquidations
The largest short squeeze in Bitcoin's history
And then, crucially, real spot and ETF capital arriving behind the mechanical move
It was a landmine most couldn't see until it went off.
I want to show you exactly how that landmine got built, and why what happened after the squeeze matters more than the squeeze itself.
Let’s get into it.
Key insights
Macro Lit The Fuse: Treasury bond buybacks doubled, reviving the debasement trade and pushing the dollar, gold and Bitcoin apart.
The Largest Short Squeeze On Record: Shorts made up 92% of $3.3 billion in liquidations, forcing mechanical buying into thin overhead air.
ETFs Absorbing 3.4x Issuance: A monthly average of 1,521 coins are being bought daily by the ETFs against 450 issued to miners.
The Levels That Decide Everything: The STH cost basis and True Market Mean must now convert from resistance into support.
The Spark Came From Washington
The trigger was not crypto native at all. On 19th August, Treasury Secretary Scott Bessent unexpectedly announced the Treasury would at least double its buybacks of 10 to 30 year government bonds, taking each operation from roughly $2 billion to $4 billion.
Now I don’t pay too much attention to macro news. But for Bitcoin, this one kind of matters, because this is the debasement trade waking up again.
When the state steps in to support the long end of the curve, it is quietly capping the price of fiscal risk. Yields are no longer allowed to fully express what the bond market actually thinks about the sustainability of the deficit, and that suppressed risk does not simply evaporate. It gets transferred somewhere else, and historically it lands in the currency.
This is financial repression in one sentence: the bondholder absorbs the cost through a debased unit of account, and hard assets re-rate against it.
You saw the mechanism play out almost immediately, with the dollar softening while gold and Bitcoin pushed 4% and 5% higher respectively. Two very different assets, one shared message here.
But don’t get too excited. This is not the quantitative easing (QE) jets being turned to full power. The Treasury is not creating bank reserves the way the Fed does when it buys assets outright. But in a market pinned to the same $5,000 range for 6 weeks, a modest shift in the macro backdrop is all it takes to nudge price into the zone where things get pretty violent.
The Landmine Beneath $67,000
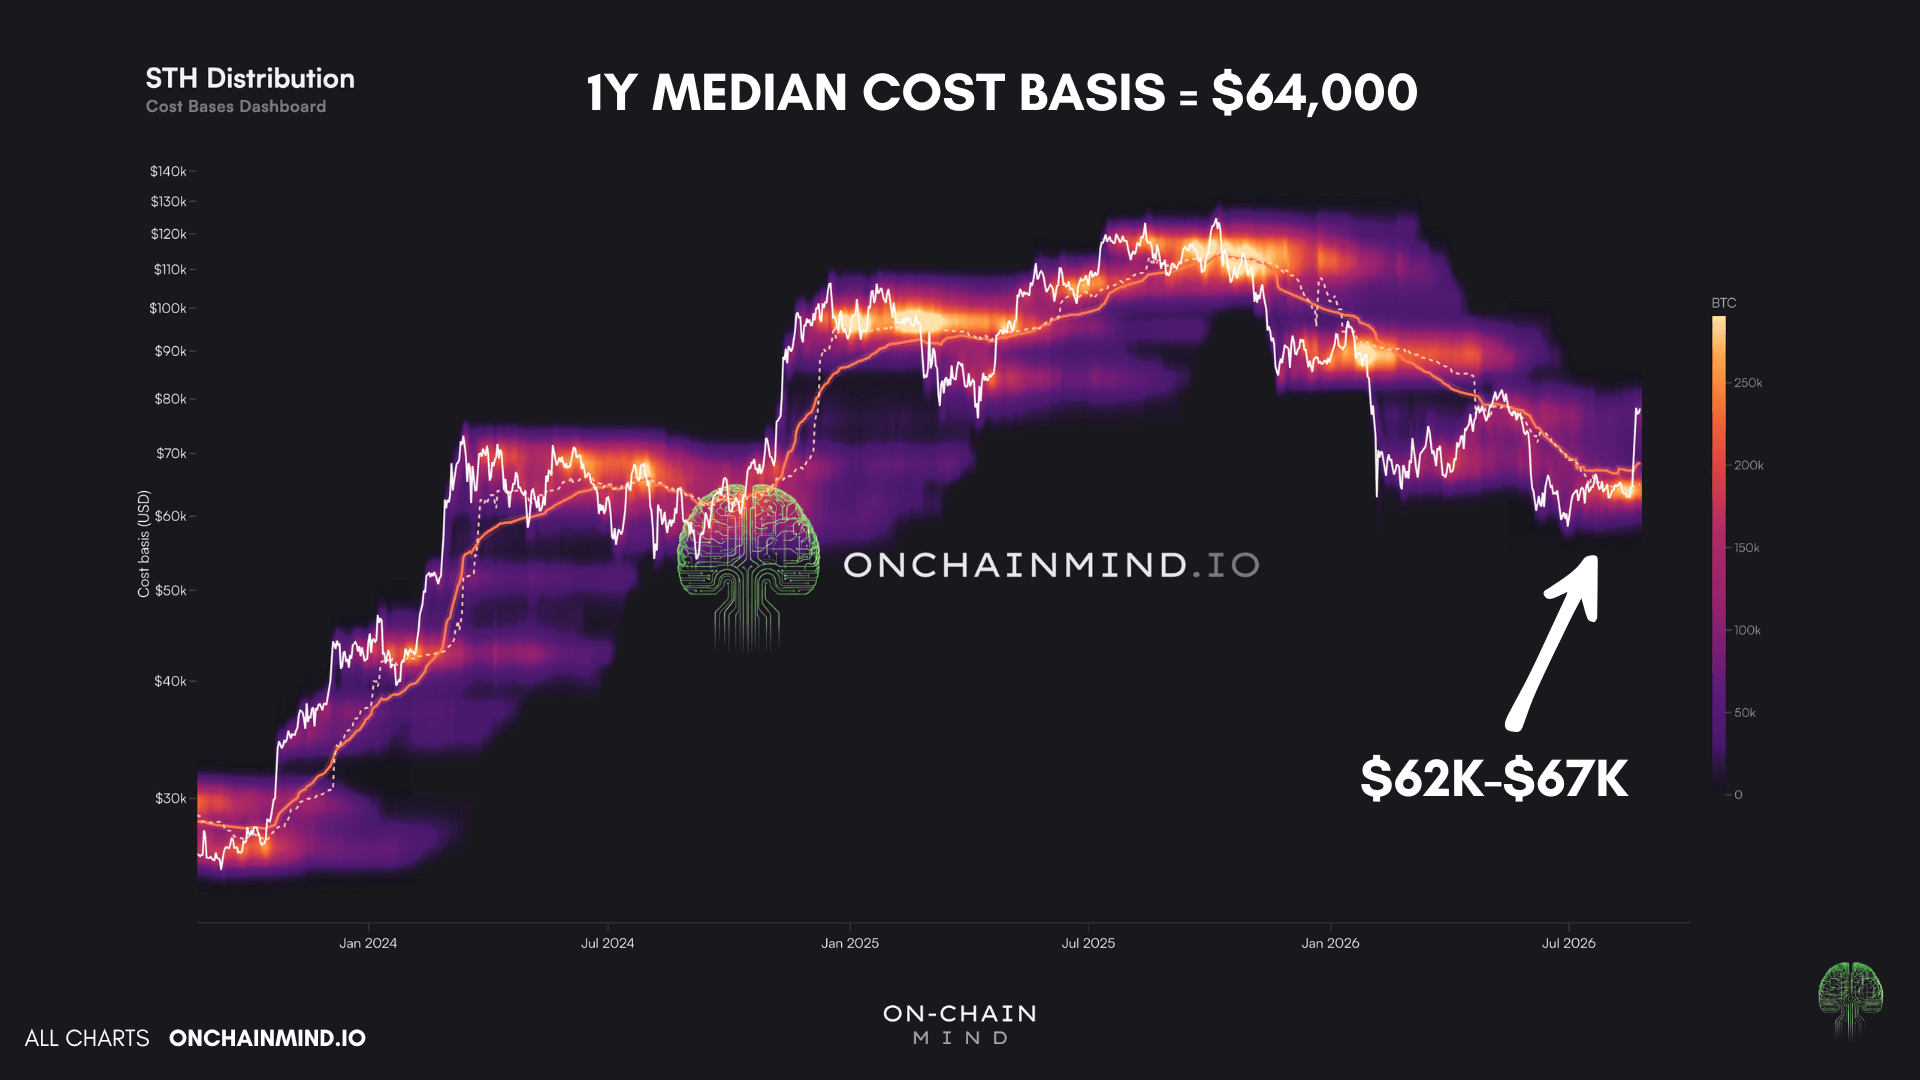
Bitcoin has been trapped between $62,000 and $67,000 for what seems like an eternity, and the reason was written all over the chain.
The median cost basis for coins acquired this year sat right at $64,000, which is precisely why price felt magnetised and directionless. When the marginal buyer's breakeven sits in the middle of your range, every rally meets sellers reaching for a flat exit and every dip meets buyers defending their entry.
View live in OCM Studio: Cost Basis Distribution
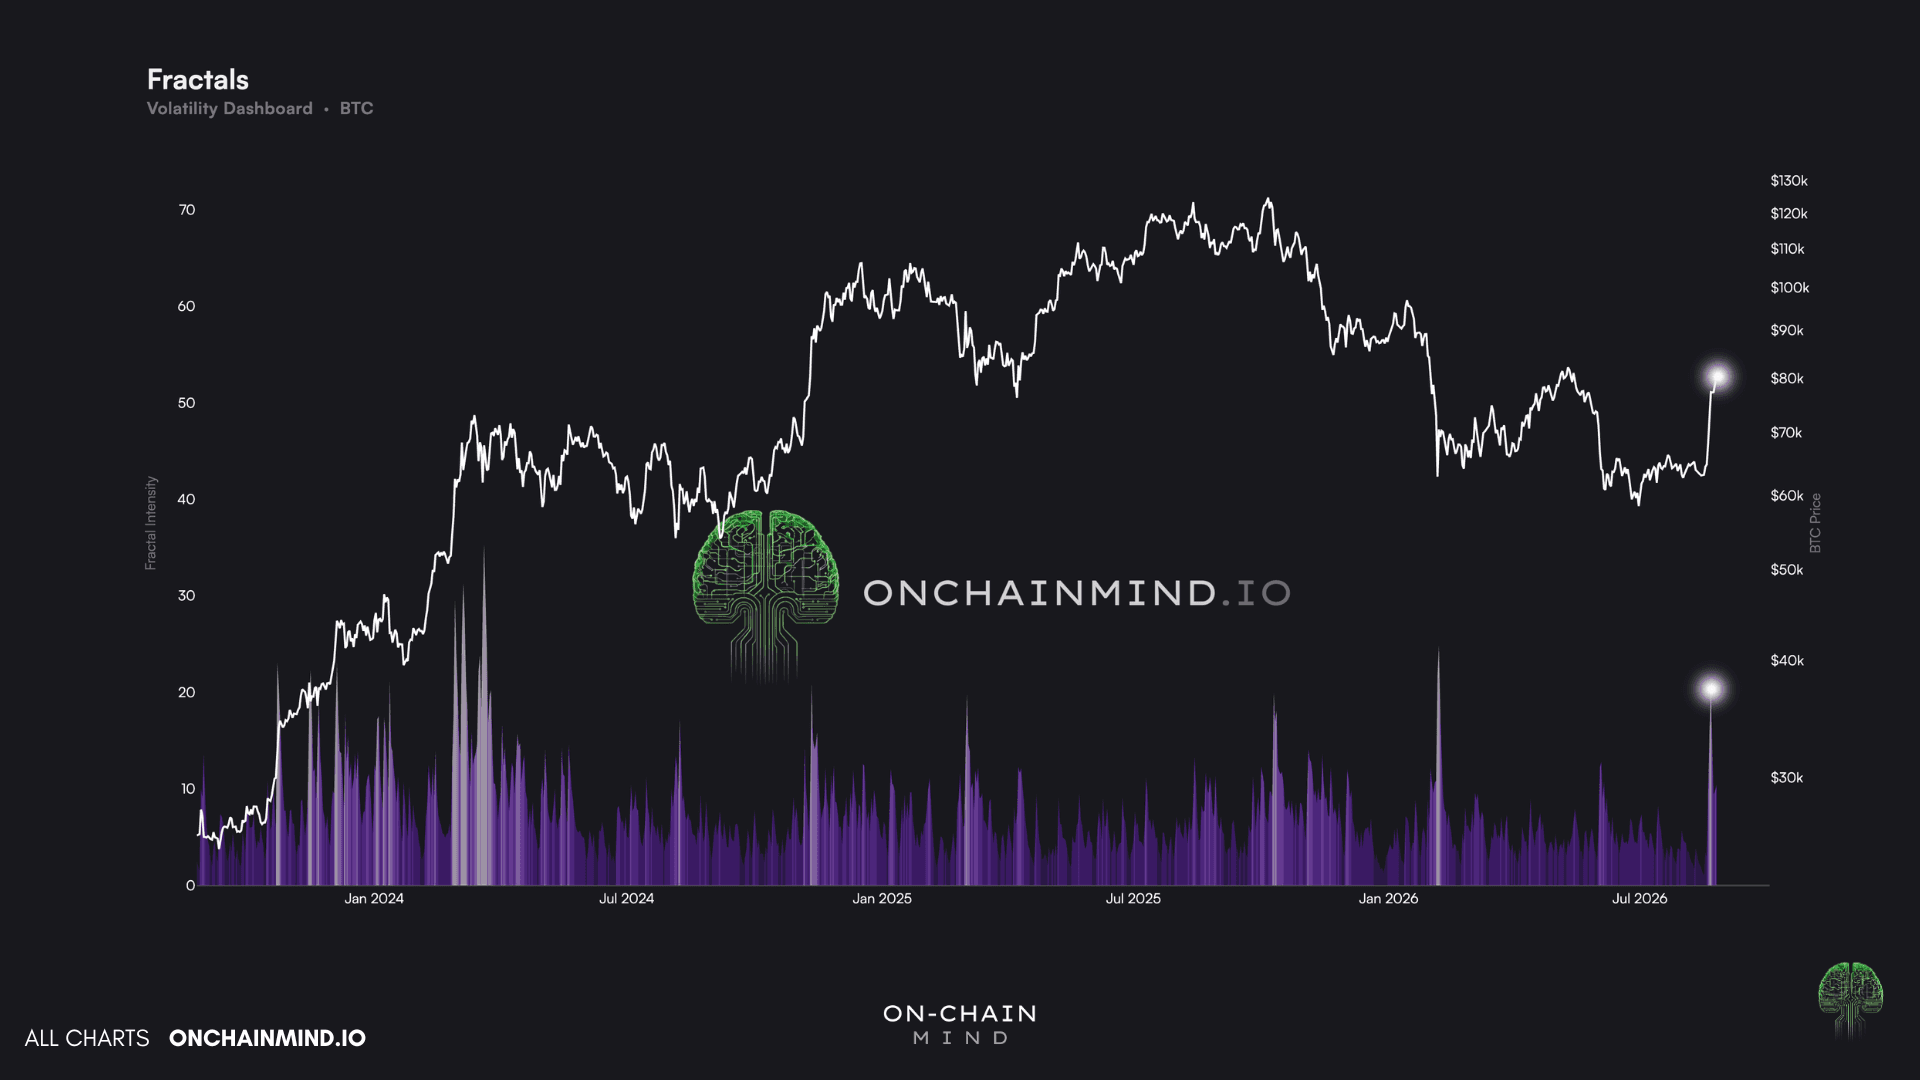
Alongside that, volatility had compressed to some of the lowest readings on record. I flagged that on the podcast with Matt and Tristan last week, and in hindsight it looked like some exceptional foresight. But honestly, it was not genius at all.
Bitcoin oscillates between choppy boredom and explosive re-rating on a continuous basis, and compressed volatility of that severity for that length of time pretty much guarantees expansion without ever telling you the direction.
View live in OCM Studio: Volatility Fractals
The direction clue actually came from positioning. Traders had shorted the top of that range repeatedly, and each attempt stacked liquidation levels into the $65,000-$67,000 band, which is measurable fuel sitting on the order book.
The map of forced buyers was directly above price, in plain sight.
When the Treasury news landed, it provided just enough bid to push into that zone, and the market hit the landmine.
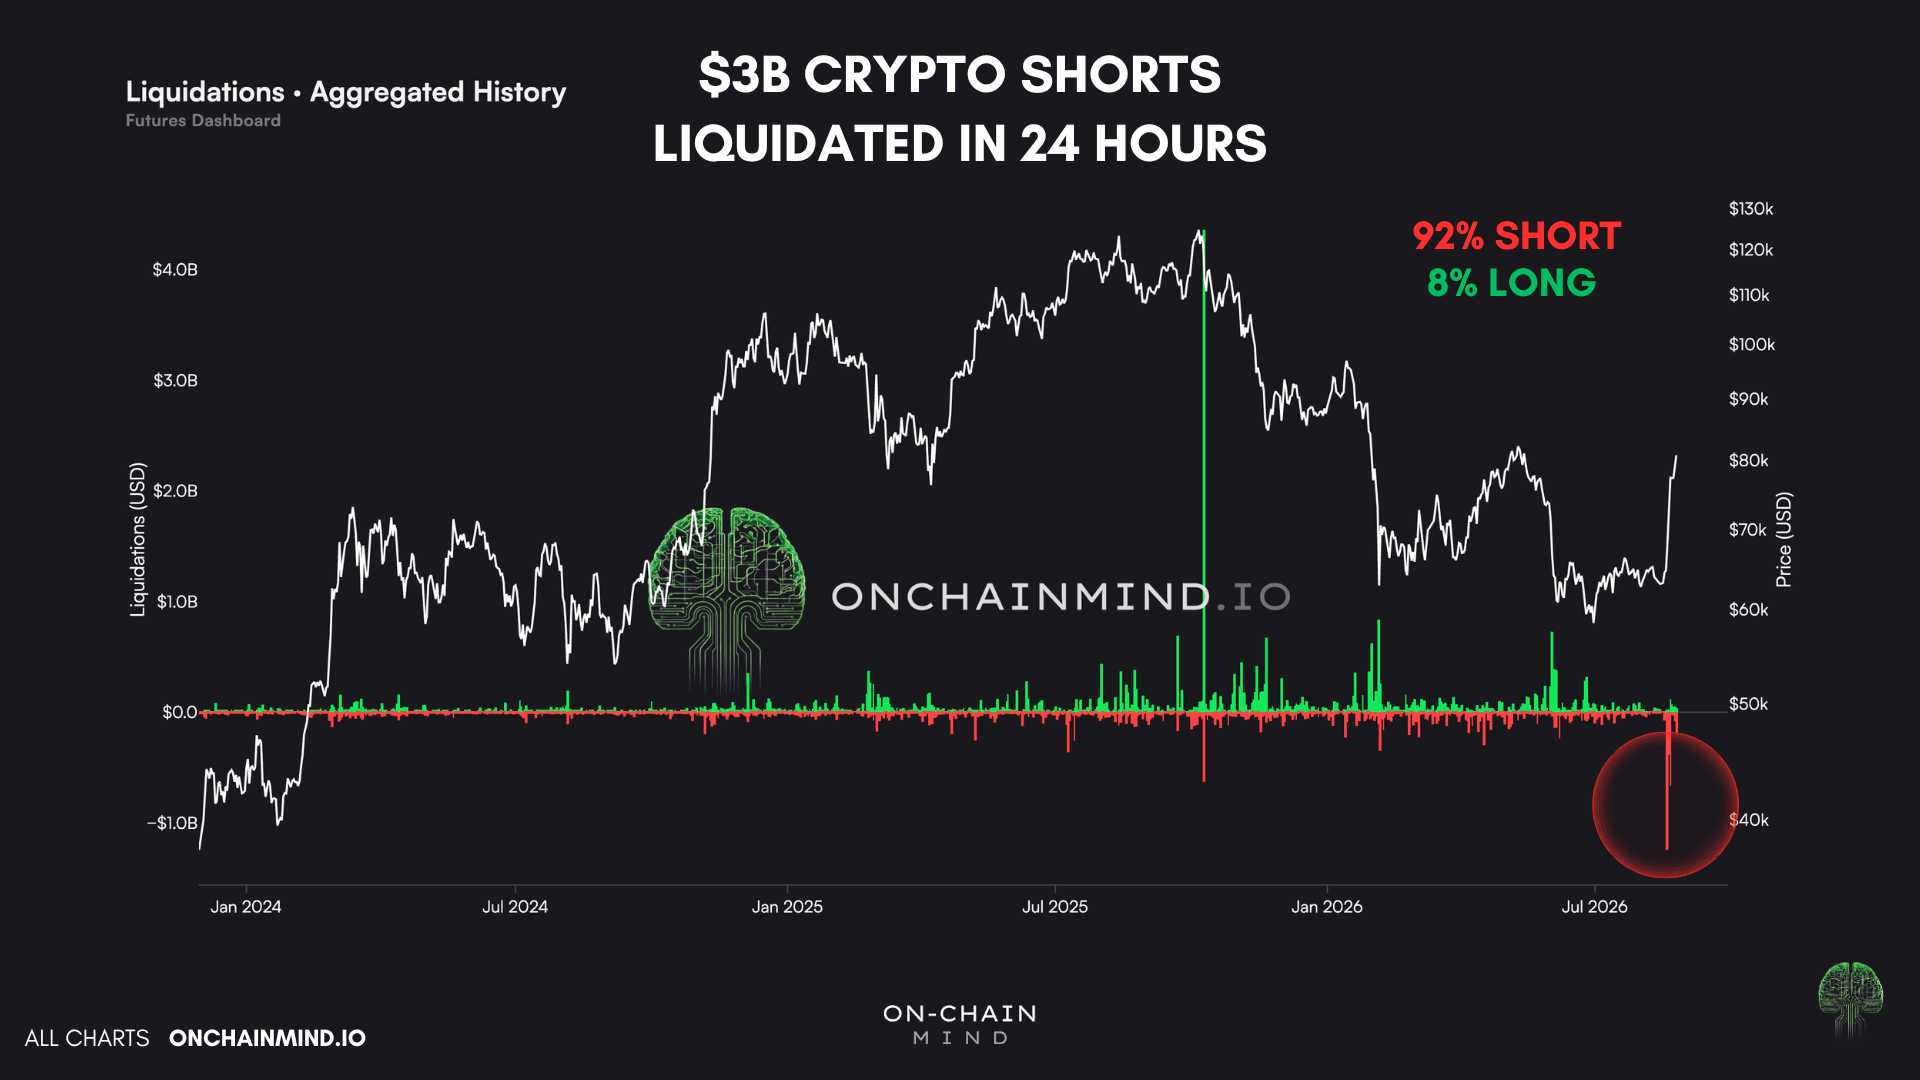
Roughly $3 billion of crypto shorts were liquidated inside 24 hours against only $264 million of longs, meaning around 92% of all liquidations were short side. Bitcoin alone accounted for over half, with more than $1 billion of shorts wiped in a single hour as price moved over 8%.
That is the largest short-side liquidation event in Bitcoin's history.
The 10th October crash was bigger in total, but that was longs being annihilated at the cycle top. On the short side, nothing comes close to this.
View live in OCM Studio: Liquidations (aggregated)
Why This Squeeze Looked Healthy
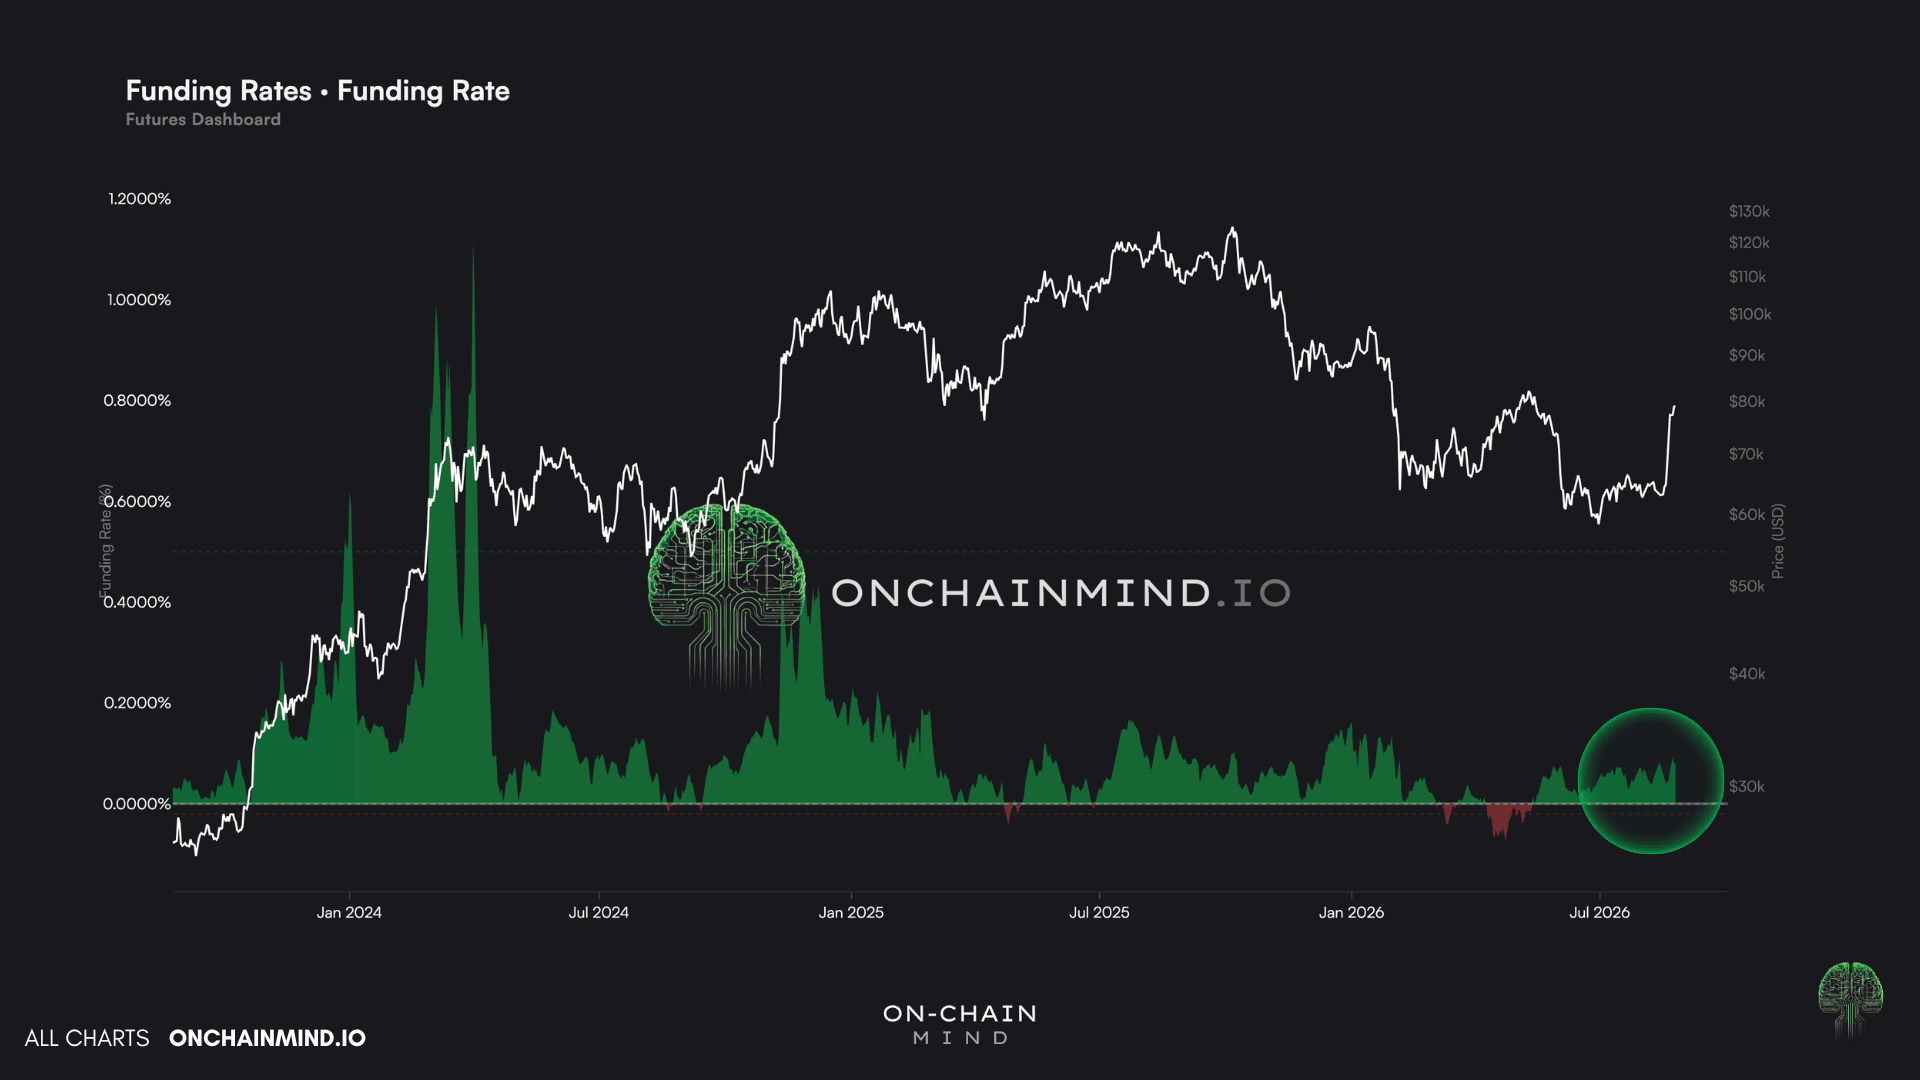
Here is the bit that separates this from the usual leverage frenzy. Through the initial squeeze, funding rates stayed remarkably restrained, futures basis actually compressed, and spot buying led futures rather than following them.
That combination matters enormously.
If this were simply degens piling in behind the wreckage, funding would have gone vertical and the futures premium would have blown out as traders paid up for exposure they did not have the cash to hold. Instead, the derivatives complex stayed calm while spot did the work.
View live in OCM Studio: Funding Rates
So the causal chain is clean: macro catalyst → technical breakout at $67,000 → record short liquidation → forced buying → accelerated breakout.
That is a far more satisfying explanation than shrugging and calling it random volatility.
A Demand That Cannot Be Liquidated
A squeeze on its own is mechanical, and mechanical moves tend to round-trip. You'll quite often see a huge liquidation in one direction followed by an immediately massive cascade in the other. But that didn’t happen this time.
And the reason for that seems to be centred around the US spot Bitcoin ETFs.
The ETFs pulled in roughly $2 billion between 17th and 21st August, their strongest week since October 2025. By zooming out to the monthly timeframe, we can see that net inflows hit $2.7 billion so far this August, which is the best monthly figure since the bull market peak.

View live in OCM Studio: ETF Monthly Flows
Now for the most part, dollar figures are almost useless without a denominator, so let me reframe it in the only unit that matters. Post-halving BTC issuance to miners runs at about 450 coins per day. And on a rolling monthly basis, the ETFs are currently absorbing over 1,521 coins per day.
That is 3.4 times daily issuance being hoovered up by a single demand channel.
This is the part of the move that cannot be reversed by a funding reset. Liquidated shorts create a transient bid that disappears the moment the cascade ends. ETF creations require cash to be exchanged for coins that are then removed from the tradable float and held by an entity with no leverage and no stop loss.
The first vertical candle was liquidation driven. What has held price up since is something structurally different.
What The Rally Actually Repaired
Now to the on-chain picture itself.
Throughout the vast majority of this bear market, Bitcoin has traded beneath the short-term holder realised price, the average cost basis of every coin that has moved within the last 155 days. That level now sits at $68,500, and it is arguably the single most important line on the chart right now.
The reason, as always with on-chain analysis, is behavioural.
It represents the breakeven of the most reactive money in the market. In bull markets it acts as support, because dips into it meet buyers who are still onside. In bear markets it acts as resistance, because rallies into it hand every trapped buyer a free escape at cost. And in classic fashion, we rejected off it cleanly twice during this bear market alone.
Retesting that level as support, whenever the dip finally comes, is the cleanest test of regime change available.
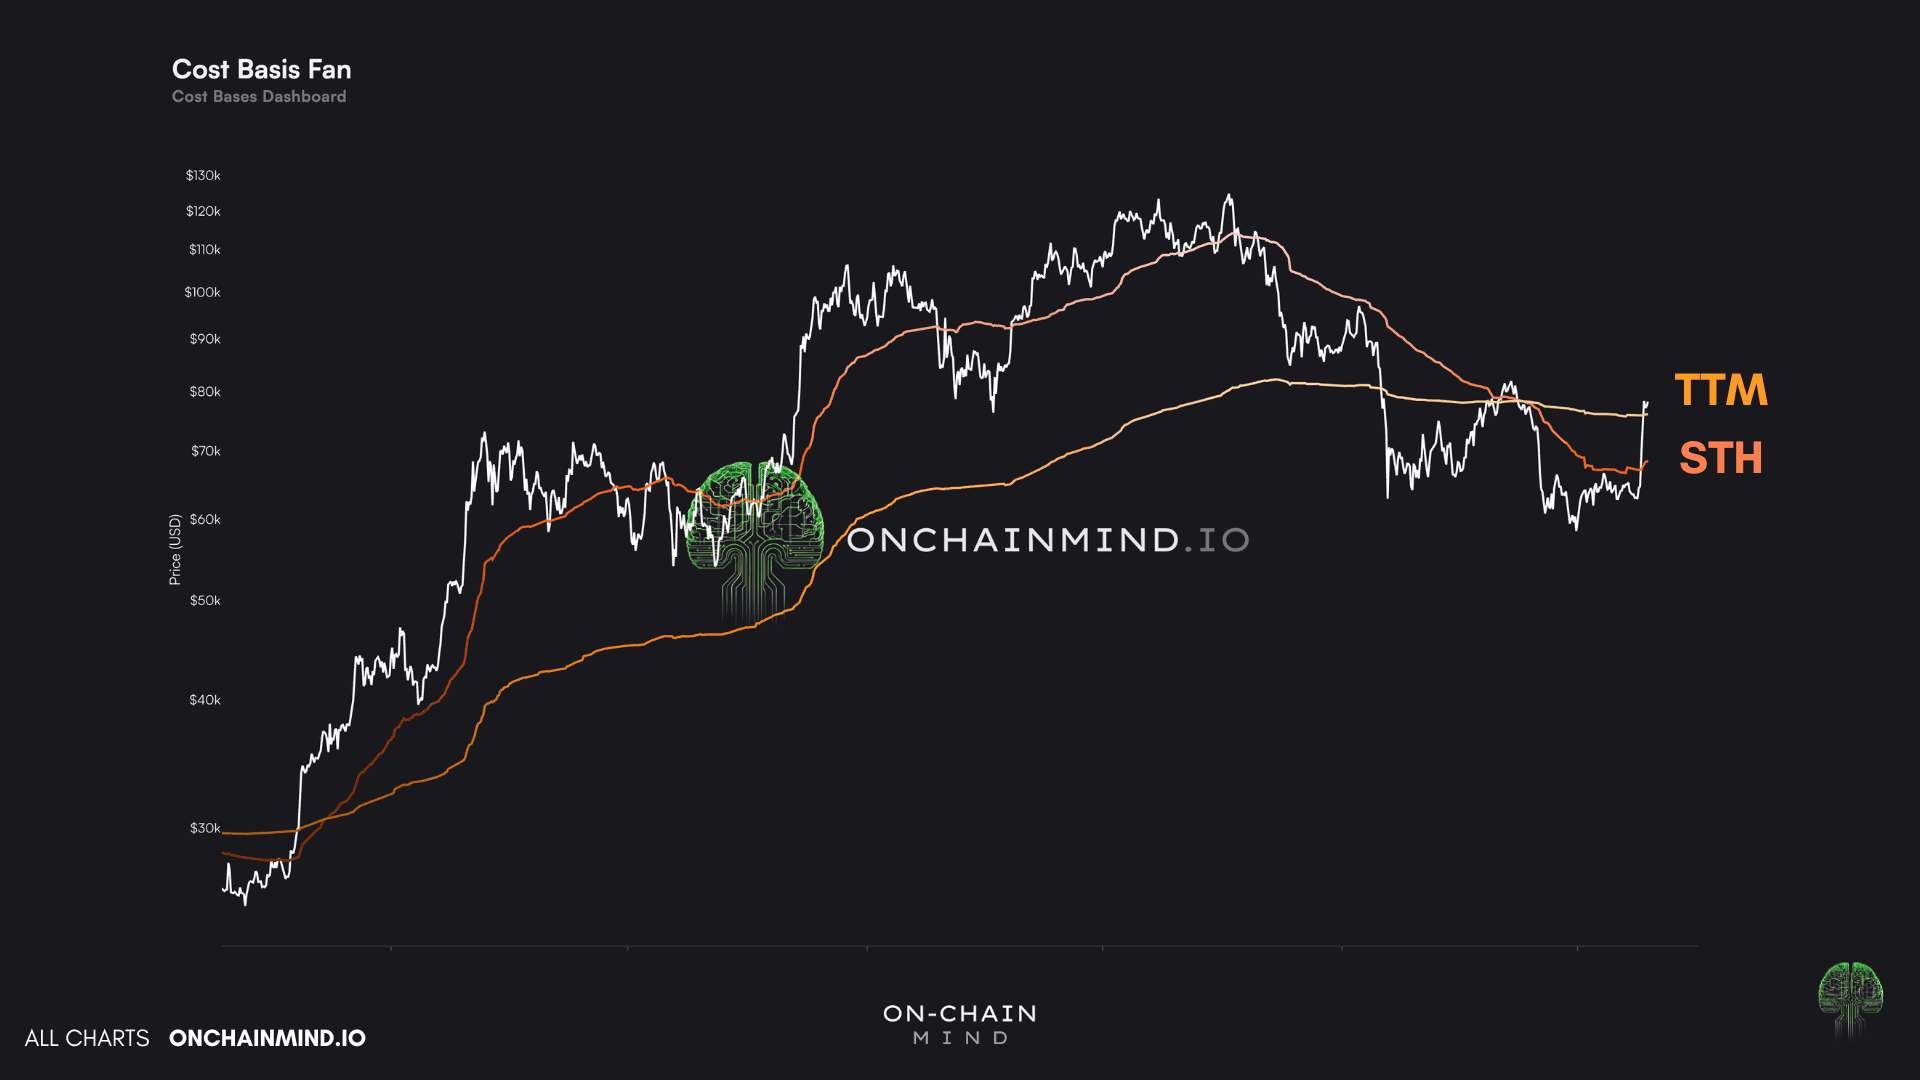
View live in OCM Studio: STH Cost Basis & True Market Mean
The profitability flip underneath is remarkable too.
Recent buyers have gone from underwater, to breakeven, to an average of 14% in profit in a matter of days. If you look at the percentage of short-term holder supply in profit, you’ll find that it has exploded from under 5% in early July to over 80% today.
As we know, profitability drives behaviour.
Underwater cohorts sell into strength to escape at breakeven, and that is what caps every rally in a bear market. Profitable cohorts have no such urgency, and their reflexive tendency is to add rather than exit.
That kind of violent repair in cohort profitability is exactly what the beginning of the last bull market looked like too. The largest rate of change in STH profitability occurred right as the tide turned into the subsequent 3 year bull.
From studying every prior cycle, we can say there’s one thing that seems to always remain true in this asset: sentiment does not improve gradually. It flips.
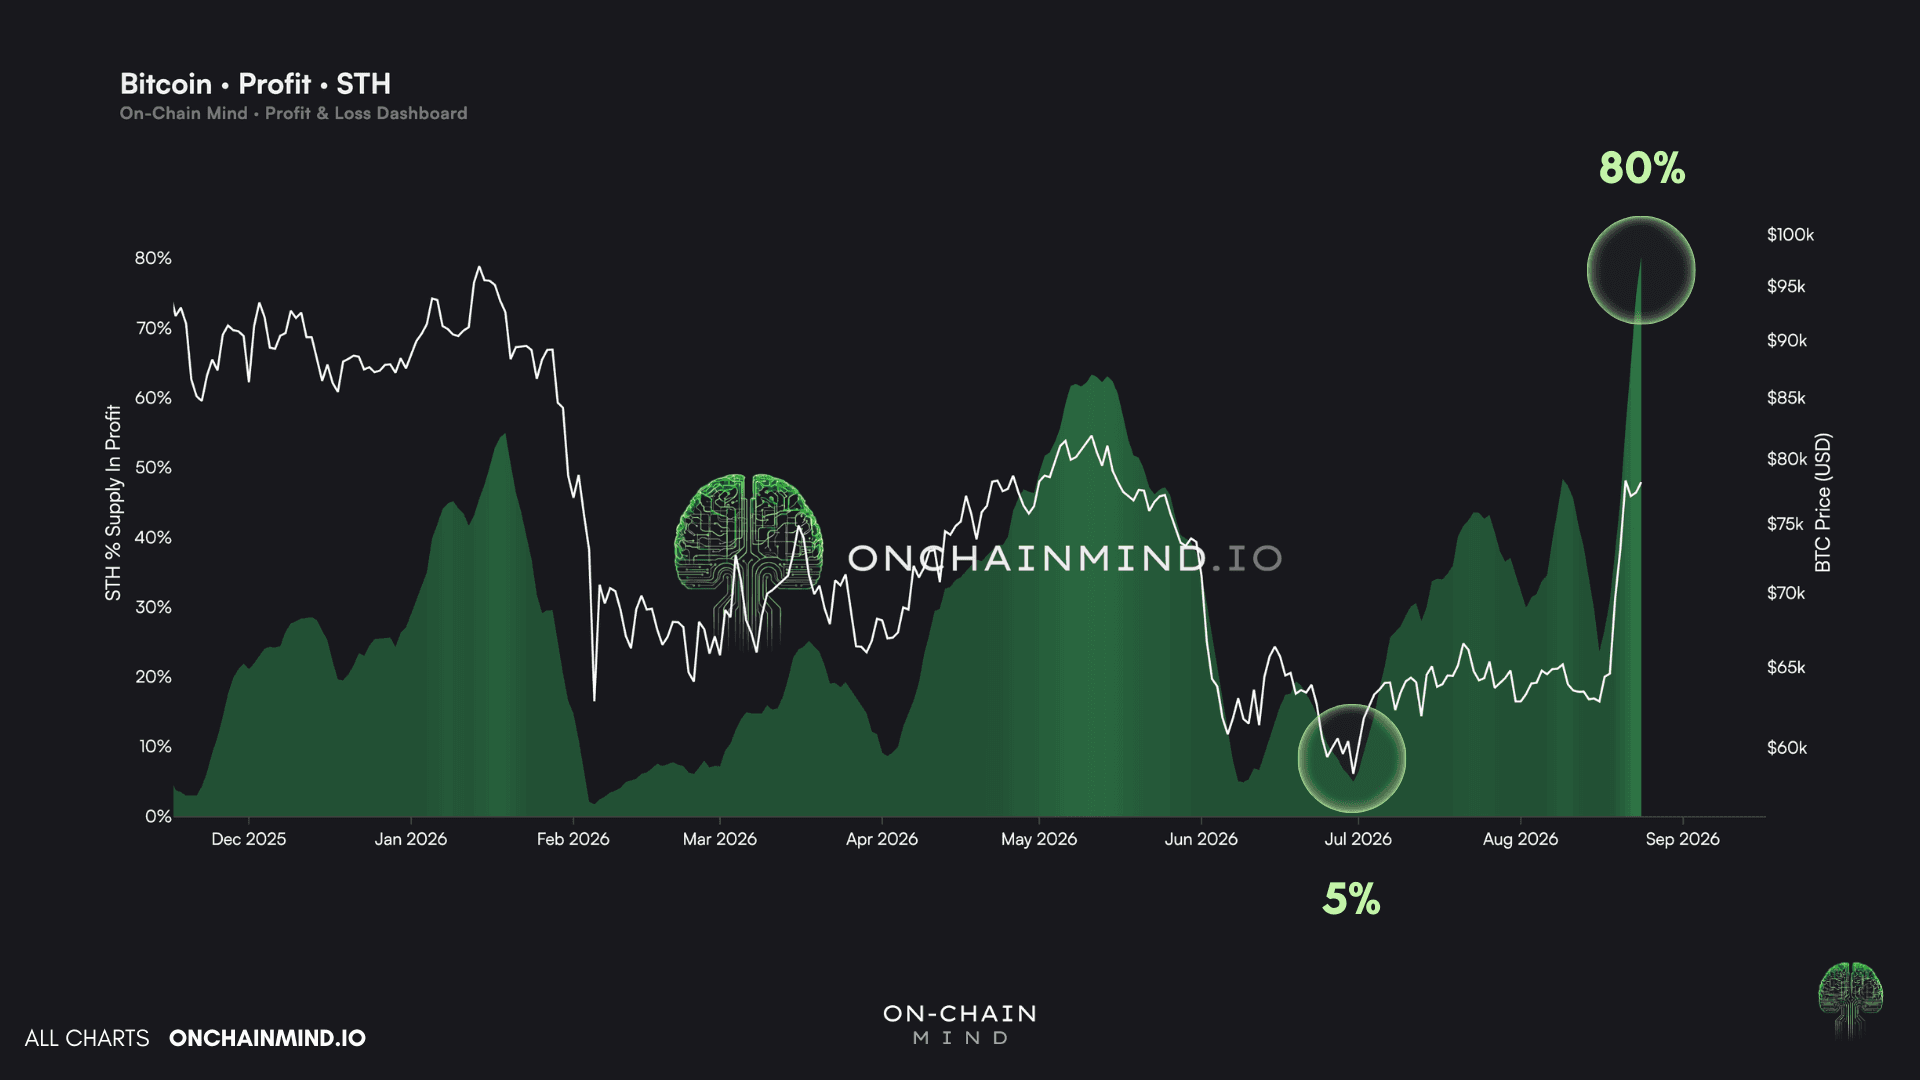
View live in OCM Studio: STH % Supply in Profit
Where Do We Go From Here?
Let’s start with the trend itself.
My Adaptive Trend model flipped bullish 6 days ago and Bitcoin is up 15% since, so as far as I'm concerned the trend is bullish until it's invalidated. I'm not going to start arguing with my own models just because a move feels uncomfortably good.
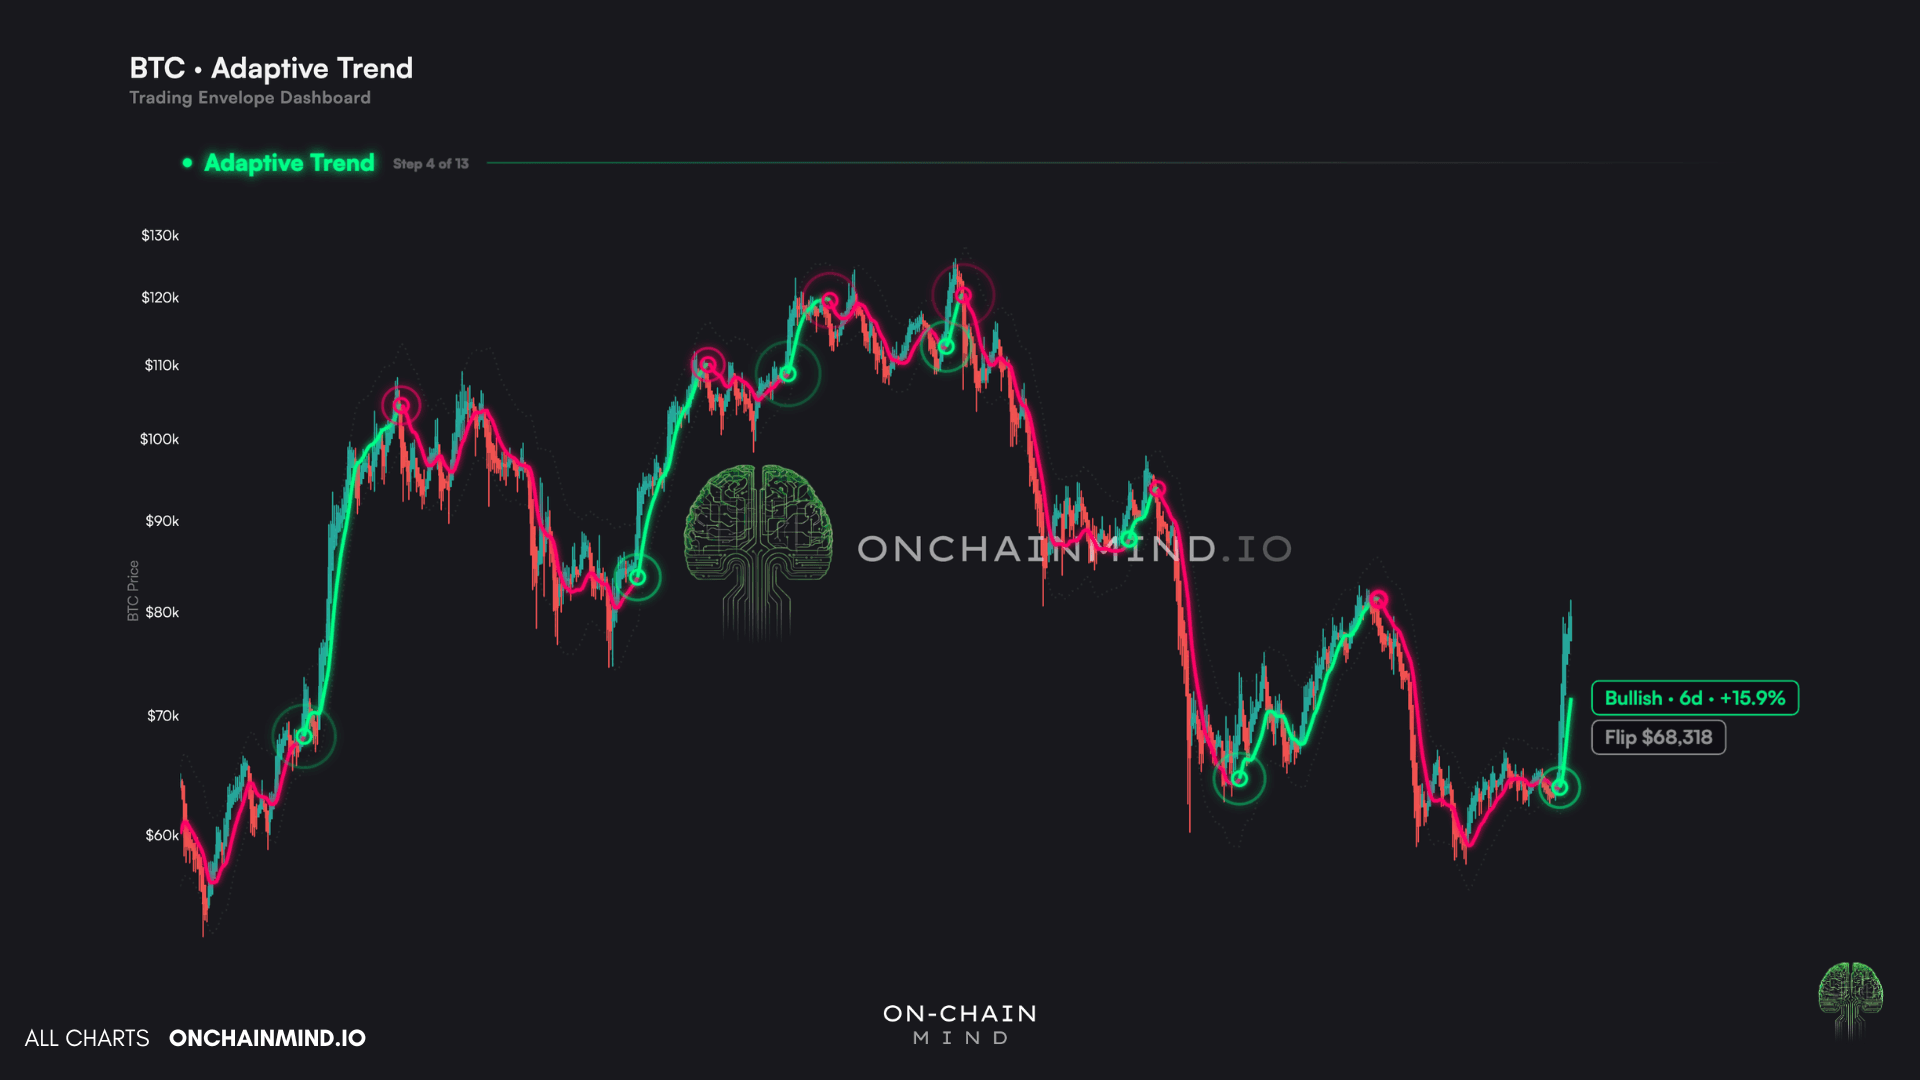
View live in OCM Studio: Adaptive Trend
But the Short-Term Omega Score is consistently sitting in the high 90s over the past few days, and that's telling me the market is running about as hot as it gets in the immediate term.

View live in OCM Studio: Short-Term Omega Score
Some form of mean reversion is coming. It always does. Chasing a vertical candle into a 90-plus reading is exactly how people manage to be completely right about the trend and still lose money on the entry.
So my plan here is genuinely quite boring, which is usually a good sign. I'm watching the short-term holder realised price and the true market mean as the levels where I'd look to add on weakness. If you feel like you missed this rally, those are your levels. Not here around $80,000.
Because what I'll really be watching isn't whether we tag $85,000 tomorrow. It's the first proper pullback.
Hold the mid-$70,000s with those cost bases underneath, and recent buyers stay green, that level converts from resistance to support for the first time in this cycle, and the case for a genuine regime change gets very difficult to argue against.
Lose the STH cost basis on light ETF flow, and the answer is simpler than that. Most of this was positioning, not demand, and the bear never truly broke.
I'm not calling the bull market. I'm saying the evidence looks like the start of one, and that the next drawdown will likely tell us which it is.