
Everyone wants the same thing right now: certainty.
Not hope. Not vibes. Not Twitter conviction. A real, genuine answer grounded in data.
This article doesn’t pretend to give you a crystal ball. What it does offer is something far more useful: a structured, probabilistic framework built from 4 independent areas of the Bitcoin market. They span holder behaviour, network-level losses, cost basis dynamics, and statistical extremes.
Taken together, they allow us to answer a simple but uncomfortable question:
Are we in the final stage of the bear market process, or is meaningful downside still ahead?
Key insights
Bear Markets Leave Structural Footprints: Every Bitcoin bear market shares recurring on-chain and statistical characteristics that repeat with diminishing severity.
Capitulation Is a Process, Not a Moment: The most violent sell-offs usually signal the start of bottom formation, not the final low.
HODLer Behaviour Matters More Than Price: Long-term and short-term holder cost bases reveal stress levels that price alone cannot capture.
Probabilities Beat Predictions: Statistical deviation models consistently identify when downside risk is largely exhausted.
The “Classic” Bear Market Framework
Let’s start with the uncomfortable baseline assumption: this time might not be different.
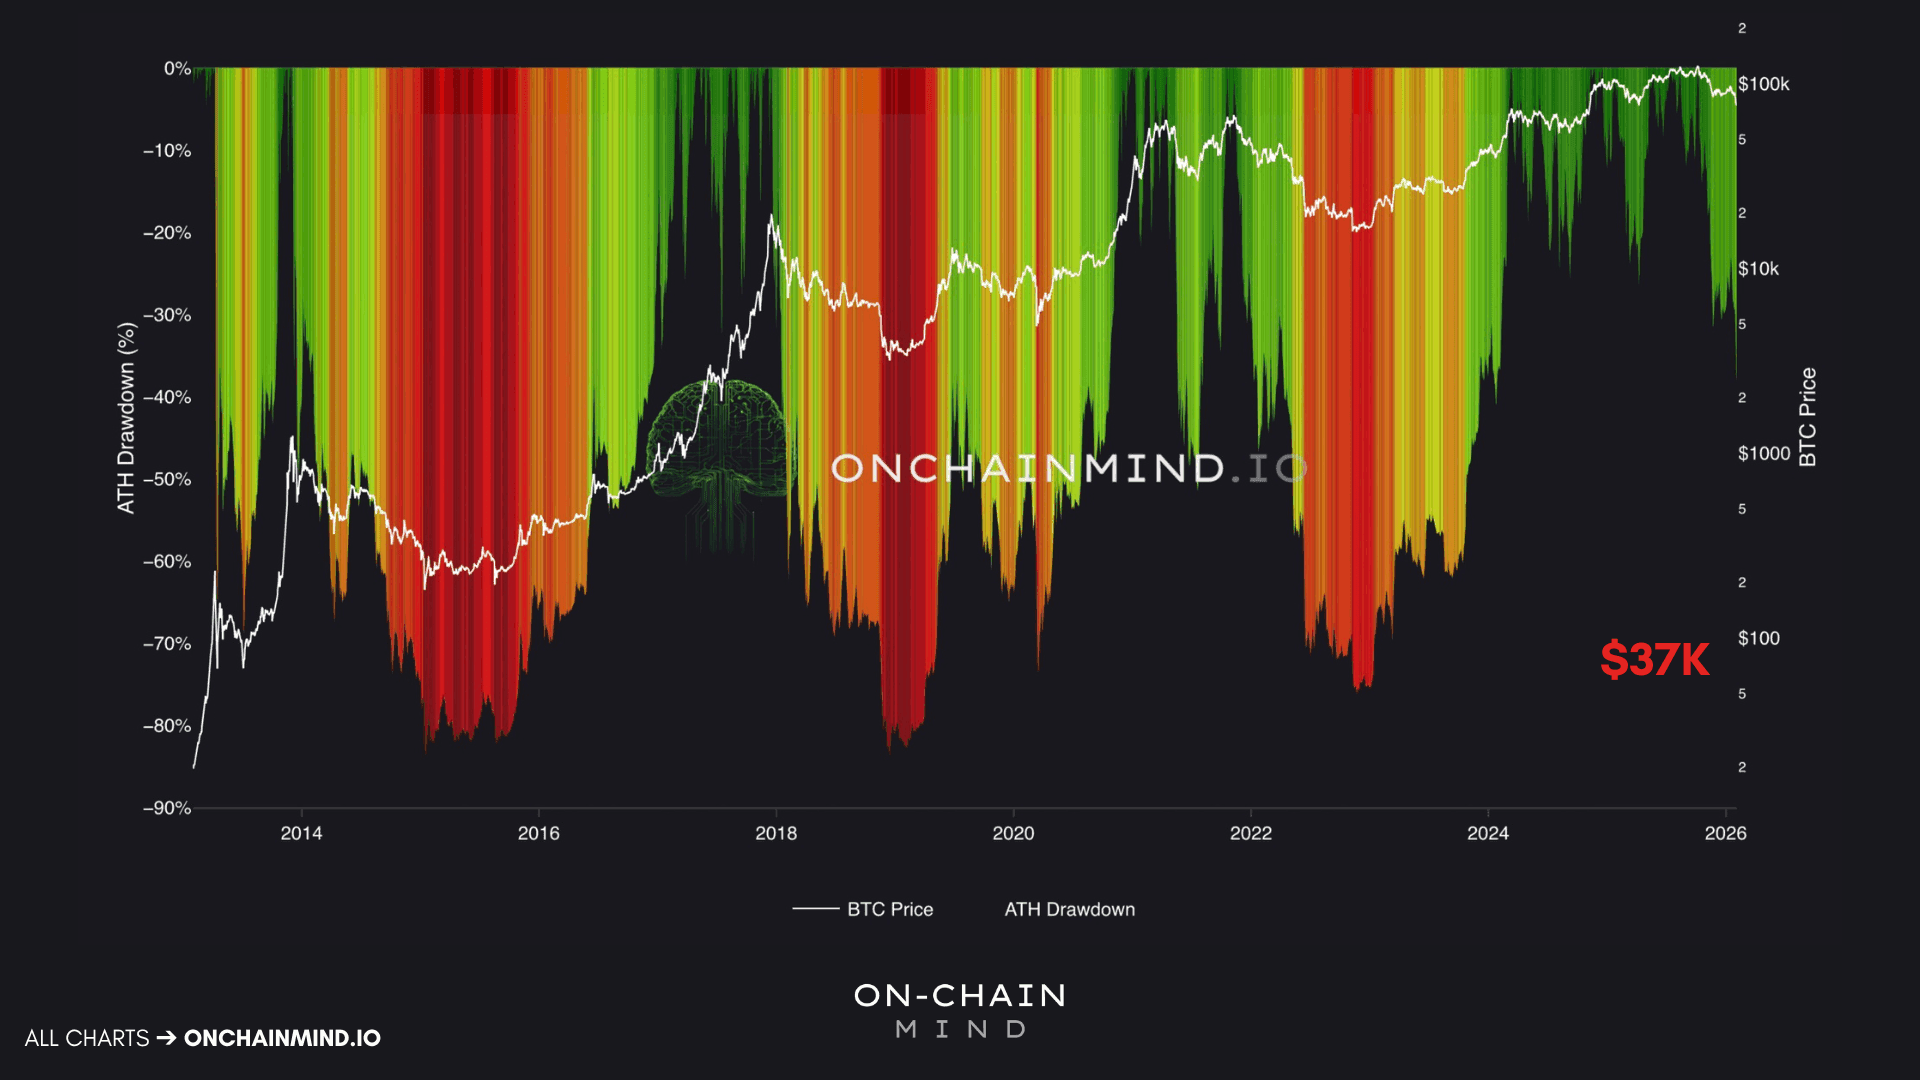
Every major Bitcoin cycle so far has ended its bear market with a deep structural reset. Price declines of over 70% from peak to trough are not anomalies; they are the historical norm. we were to follow that "standard" script from our $126,000 high, we would be looking at a Bitcoin price near $37,000.
That said, this cycle complicates things. The preceding bull market was notably more muted than previous euphoric blow-offs, which opens the door to a more muted bear market in return.
That argument has merit. But serious investors do not build strategies around best-case narratives. They prepare for alternative outcomes.
Rather than anchoring to an arbitrary percentage drawdown, we need to examine whether the conditions that historically define a true bear market bottom have actually appeared.
Measuring Network-Wide Pain
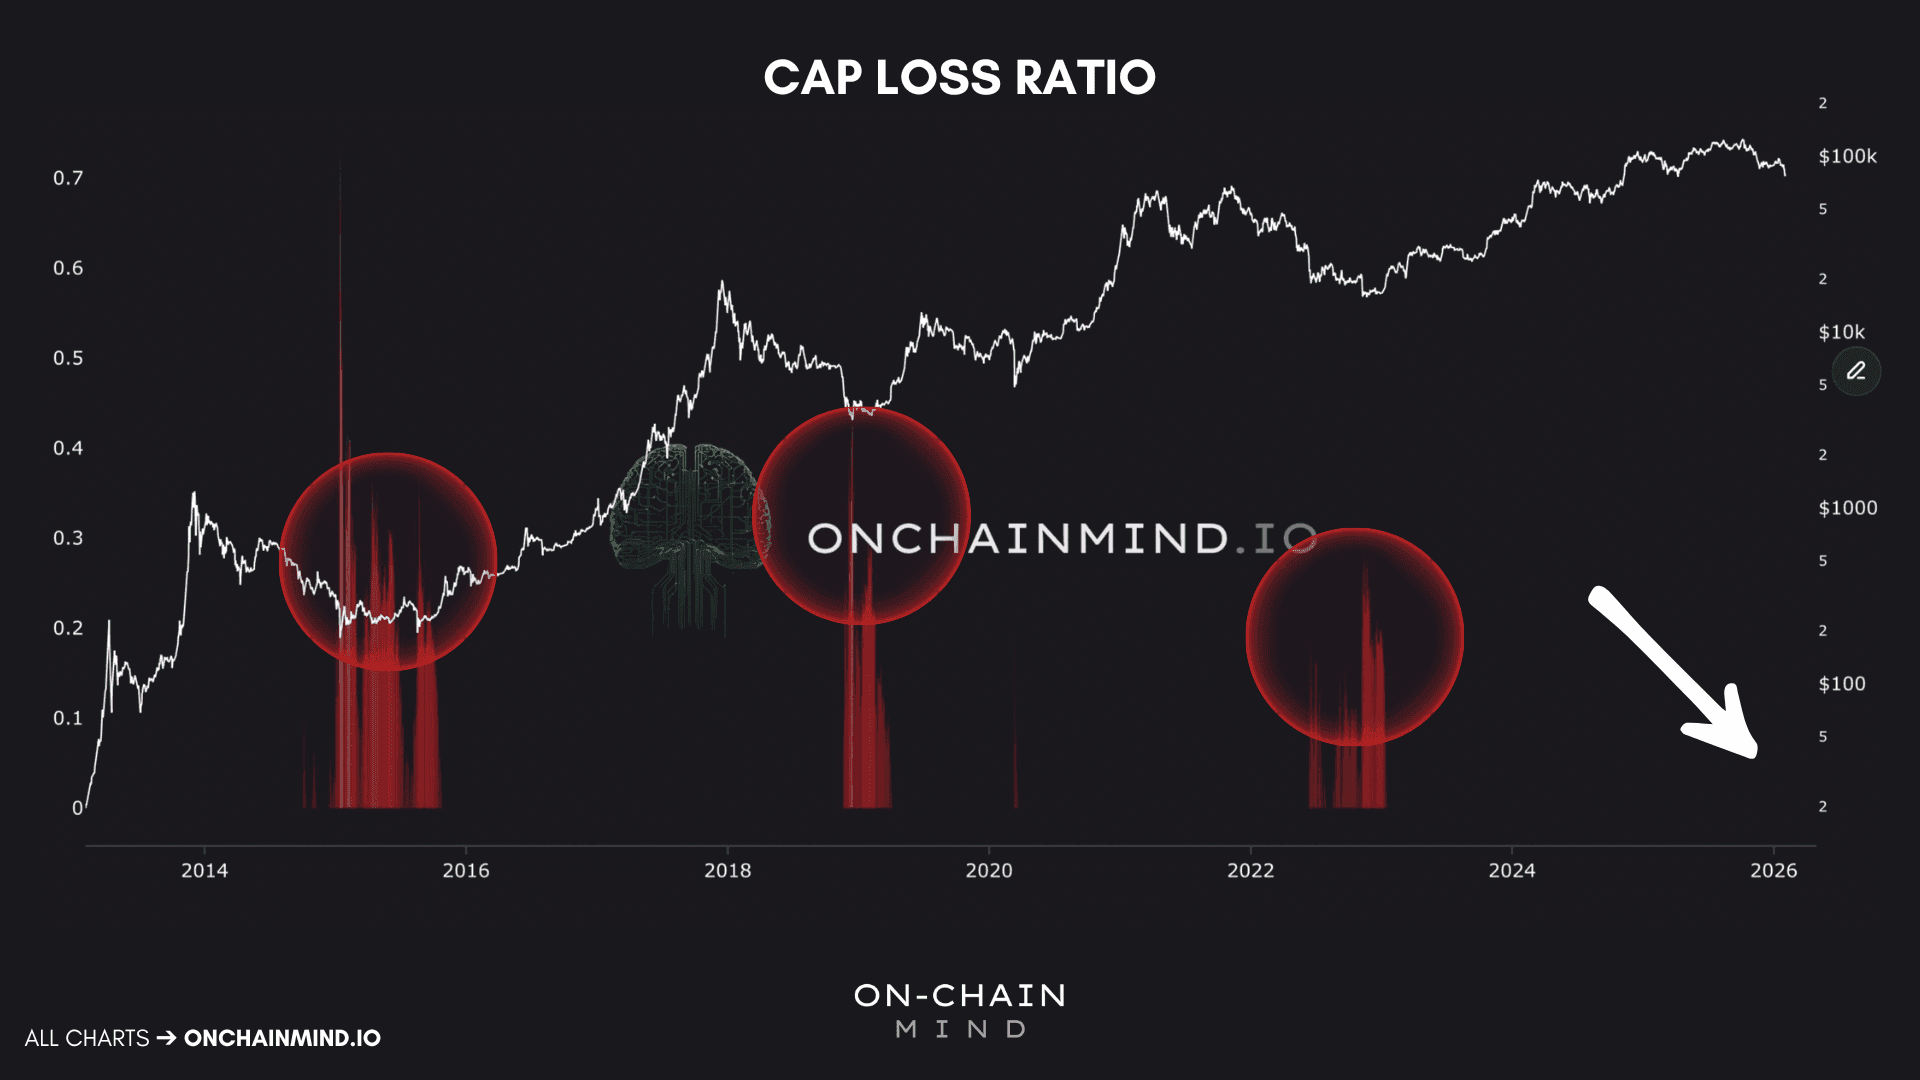
One of the most telling metrics here is what I call the Cap Loss Ratio. This is a network-level indicator designed to measure how much of the Bitcoin ecosystem is underwater at any given time.
At its core, the Cap Loss Ratio compares two things:
Market Cap, which reflects current price-based valuation.
Realised Cap, which represents the aggregate cost basis of all coins in circulation.
When the Market Cap falls below the Realised Cap, the network as a whole is operating at a loss. That is not a theoretical condition. It is actual, realised financial pain distributed across millions of participants.
This is why it functions as a kind of capitulation thermometer. It only activates when losses are broad-based and unavoidable. The sharper the spike, the deeper the distress.
Historically, the pattern is clear:
In 2015, the ratio frequently exceeded 0.3 and at times pushed beyond 0.5. That was full-scale capitulation.
In 2018-19, it again cleared 0.3 and briefly touched 0.4.
In 2022, it mostly hovered above 0.2 and briefly entered the 0.3 zone.
Each cycle has shown diminishing extremes, with the peak stress level falling by roughly 0.1 each time. If that pattern continues, a comparable capitulation in this cycle would likely occur somewhere between 0.1 and 0.2.
Here’s the critical point: we are not there yet.
The ratio has not meaningfully lit up at all. From a pure network-wide loss perspective, the market has not experienced the kind of systemic pain that historically marks final bear market lows.
That does not guarantee lower prices. But it does tell you that, under a “classic” bear market framework, downside risk has not been fully exhausted.
And when this indicator does light up, history is unambiguous: those moments have offered some of the most generational accumulation opportunities Bitcoin has ever produced.
Stress Among the Strong Hands
Bitcoin holders are not a monolith. Their time horizon fundamentally changes their behaviour, and the data captures this shift remarkably well.
The industry-standard threshold is 155 days, just over 5 months. Below that, you are classified as a Short-Term Holder (STH). Beyond it, you become a Long-Term Holder (LTH).
This distinction matters because behaviour changes dramatically after that point. LTHs are statistically less reactive, less emotional, and far more resistant to selling into volatility. But when they do come under pressure, it's important to start taking note.
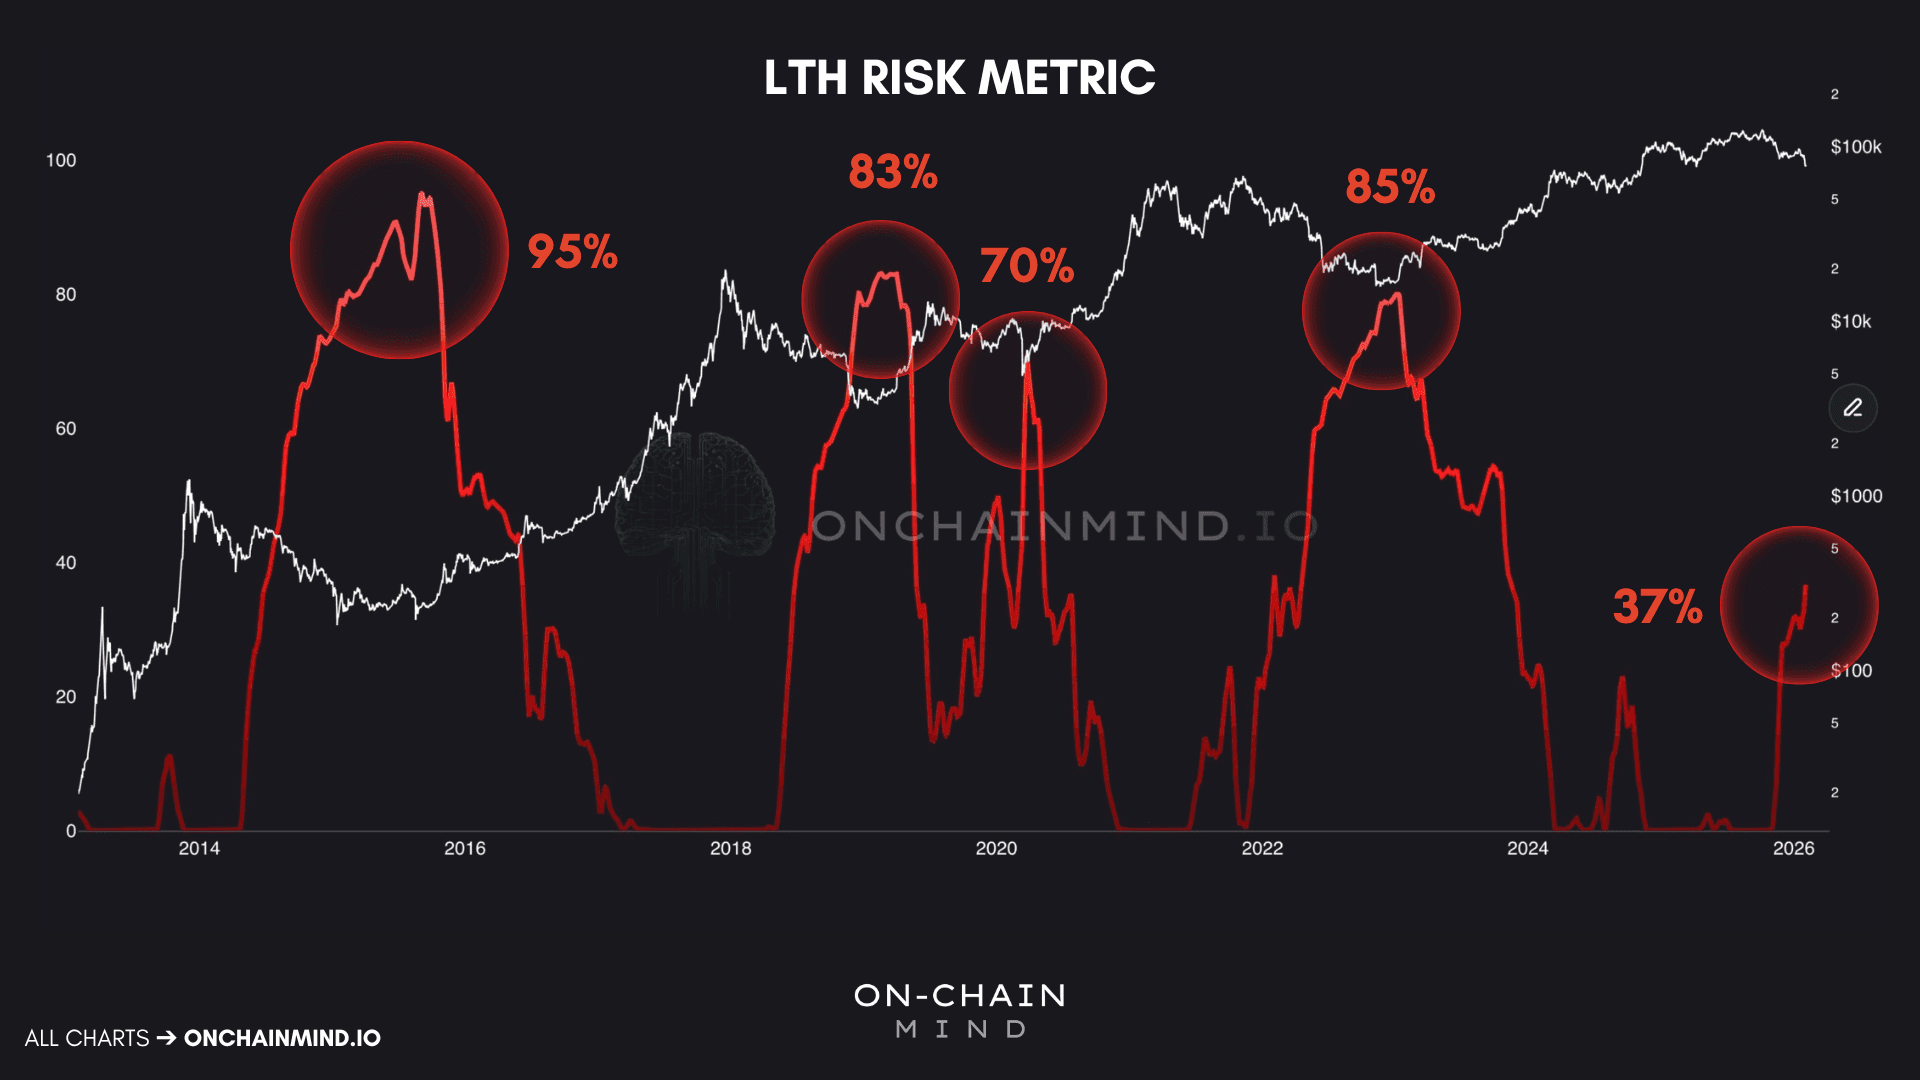
The LTH Risk Metric tracks the percentage of long-term holders who are sitting on unrealised losses.
This cohort is usually profitable. That is their defining characteristic. So when a significant portion of them is underwater, it signals deep structural stress.
The data has been normalised into a probabilistic risk metric:
0% represents conditions where essentially no long-term holders are at a loss. These periods align with bull market expansions.
100% does not mean every long-term holder is underwater. It means the metric has reached the highest level of LTH distress ever observed historically.
Looking back:
2015 peaked around 95%.
2019 reached roughly 83%.
March 2020 spiked to about 70%.
2022 peaked near 85%.
There is some diminishing severity, but not dramatically so.
What matters most is the threshold. Historically, once this metric pushes above 55-60%, the bottoming process begins quickly. Within a few months, the market transitions and bottoms out.
Today, we are sitting around 37%.
That tells us something important. LTHs are uncomfortable, but they are not yet in full distress. If this cycle follows historical patterns, even in a diminished form, a move above 70% would strongly suggest we are approaching the end of the bear market.
When even the most patient participants are hurting, you are usually close.
Where Floors Are Built
Now let's flip the script and look at the newest participants: Short-Term Holders.
This cohort represents recent entrants from the last 5 months. Their average acquisition price forms the STH Realised Price, around which we can construct dynamic Cost Bands.
These bands act like a probabilistic map of where bear markets typically end:
The green band represents roughly 1 standard deviation below the STH cost basis.
The blue band marks deeper capitulation events at 2 standard deviations, often brief and violent.
Across every bear market, price has bottomed inside these zones.
Zooming in on recent history, the green band has done most of the work. The blue band is usually only touched during fast, liquidity-driven wicks where supply is absorbed almost immediately.
Right now, price is sitting at the lower end of the green band and brushing against the blue.
In concrete terms:
The green band currently sits around $75,000.
The blue band sits near $61,000.
These levels are not predictions. They are probabilistic accumulation zones. They tell you when the risk-reward balance shifts decisively in favour of the buyer.
One crucial caveat: these bands are dynamic. Over a few months, they can shift by $5,000-$10,000. This is why real-time monitoring matters. Static levels miss the point.
But structurally, being in this zone has historically been an excellent time to accumulate, not to panic.

Stripping Back The Probabilities
On-chain data is powerful. But it is not the only lens worth using.
Sometimes, the cleanest signal comes from asking a simpler question: How statistically extreme is the current price relative to its own history?
That is where the Z-Score Probability Waves come in.
This model measures how far price deviates from its long-term mean in standard deviation terms. Unlike many indicators, it automatically adapts across cycles. There is no need to manually account for diminishing returns or changing market regimes.
Historically, Bitcoin bear market bottoms form between -1 and -2 standard deviations, with brief dips below -2 during extreme events.
We have just experienced a -2 standard deviation move.
These events are rare. They represent statistically massive downside deviations. Importantly, they almost never mark the exact day of the bottom. Instead, they signal that the bottoming process has begun.
What usually follows is not a V-shaped recovery, but months of choppy, frustrating, slightly negative price action. This phase exists to exhaust sellers, shake conviction, and test even long-term holders.
Price may still drop another $5,000, $10,000, or even $15,000. That is part of the bottoming process.
If you are still here after a move like this, you have already survived one of the worst statistical drawdowns relative to recent history.

The Psychology of the Lone Wolf
Watch the video walkthrough on YouTube
Continue reading with OCM Premium
You have been reading the free preview of this article. The rest of it (about 350 more words) is for OCM Premium members. See OCM Premium plans.