
What if the most confident-sounding analysis in Bitcoin right now is built on 3 data points and a 1-in-10 coincidence?
The 4-year cycle has taken over the minds of a huge share of this market, and people are making genuinely consequential financial decisions on the back of it.
I kept getting comments all year, along the lines of "I'm buying in October regardless of price". That sentence, more than anything else, is what prompted this piece.
Because if your accumulation strategy is anchored to a date on a calendar rather than to what the network is actually doing, you have outsourced your thinking to a pattern that never really existed.
That's why this piece is going out to everyone. It is simply too important to gate.
Before anyone reaches for the pitchforks, let me be clear about one thing. I do believe Bitcoin moves in cycles. I just don't believe the calendar has anything to do with it. Trusting a pattern in a calendar is like thinking the clock predicts lunchtime, rather than the fact that people actually get hungry.
So let me take the 4-year cycle apart properly: where it starts (nobody agrees), the statistics holding it up (they can't), and what actually drives the cycle (people, not the calendar).
Let's get into it.
Key insights
Where Does the Cycle Actually Start? Halving, low, top or yearly open. Every anchor tells a different story, and the analyst picks the one that looks neat.
1 Million Simulations: I tested the "tight clustering" claim a million times. The precision behind it is a 1-in-10 coincidence.
Unfalsifiable by Design: Left-translated, right-translated, Q4 or "technically Q1" . A forecast that can't be wrong isn't a forecast.
What Actually Drives the Cycle: Liquidity, leverage and who holds the coins set the rhythm, not the calendar.
Every Consensus Cycle Decays: Markets have run this experiment before, and history is clear about what happens once everyone believes.
The Tidy Story and the Untidy Chart
The 4-year cycle story treats Bitcoin like clockwork. Halving, bull run, blow-off top, a year-long bear, repeat. It's clean, it's memorable, and it fits beautifully on a YouTube thumbnail.
The actual chart is far less tidy. The first bull phase ran 325 days, from 2010 into 2011. The second ran 747 days, from late 2011 to late 2013. Only the last 3 have stretched beyond 1,000 days. Bear markets have lasted anywhere from 163 to 406 days. The 2 earliest cycles simply don't fit a 4-year rhythm at all.
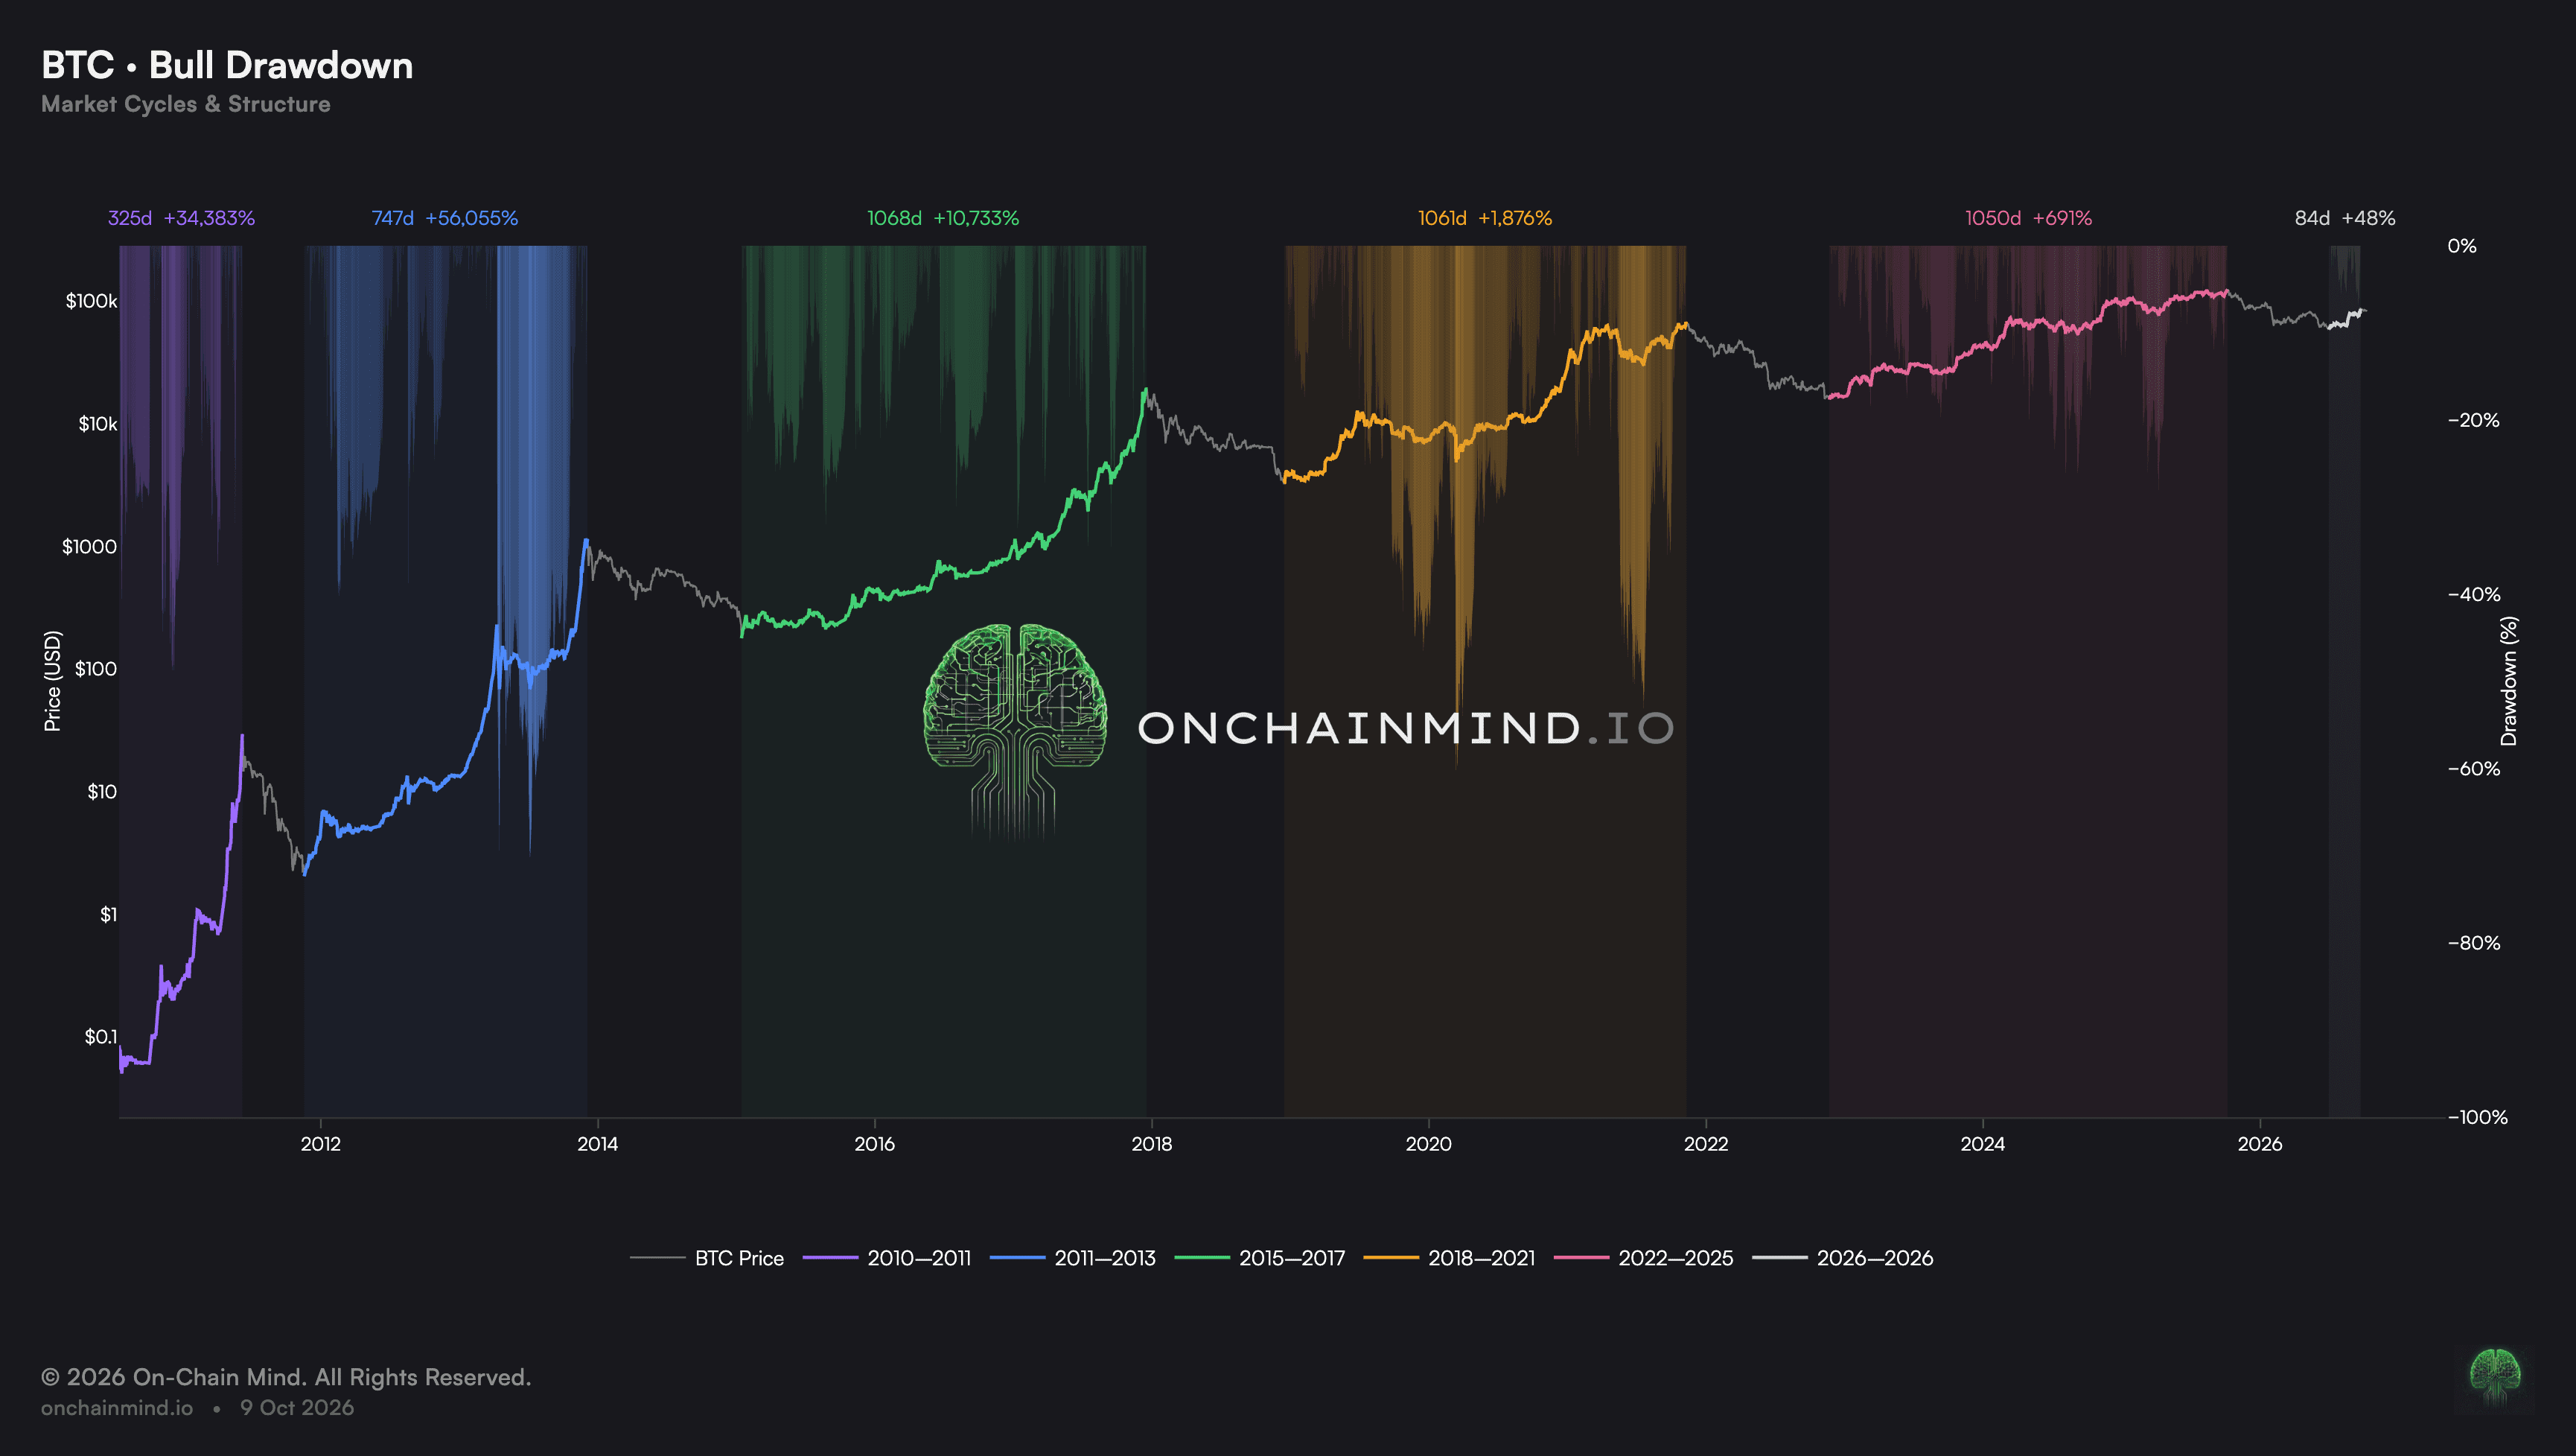
View live in OCM Studio: Bull Cycle Lengths
The June 2011 top doesn't sit in Q4 of any post-halving year, so it gets quietly dropped from most analysis. The defence is that "2011 predates the halving regime", and that's fair as far as it goes. But follow the logic through.
You're now left with 3 completed cycles. Lows in 2015, 2018 and 2022. Tops in Q4 of 2013, 2017, 2021 and 2025.
That is the entire evidence base behind a theory people are planning their savings around.
And any cycle theory that has to exclude its very first instance to work is one that finds its rhythm by only measuring where the rhythm already exists.
A pattern that only appears after you've chosen which data counts isn't a law. It's an edit.
Where Does the Cycle Actually Start?
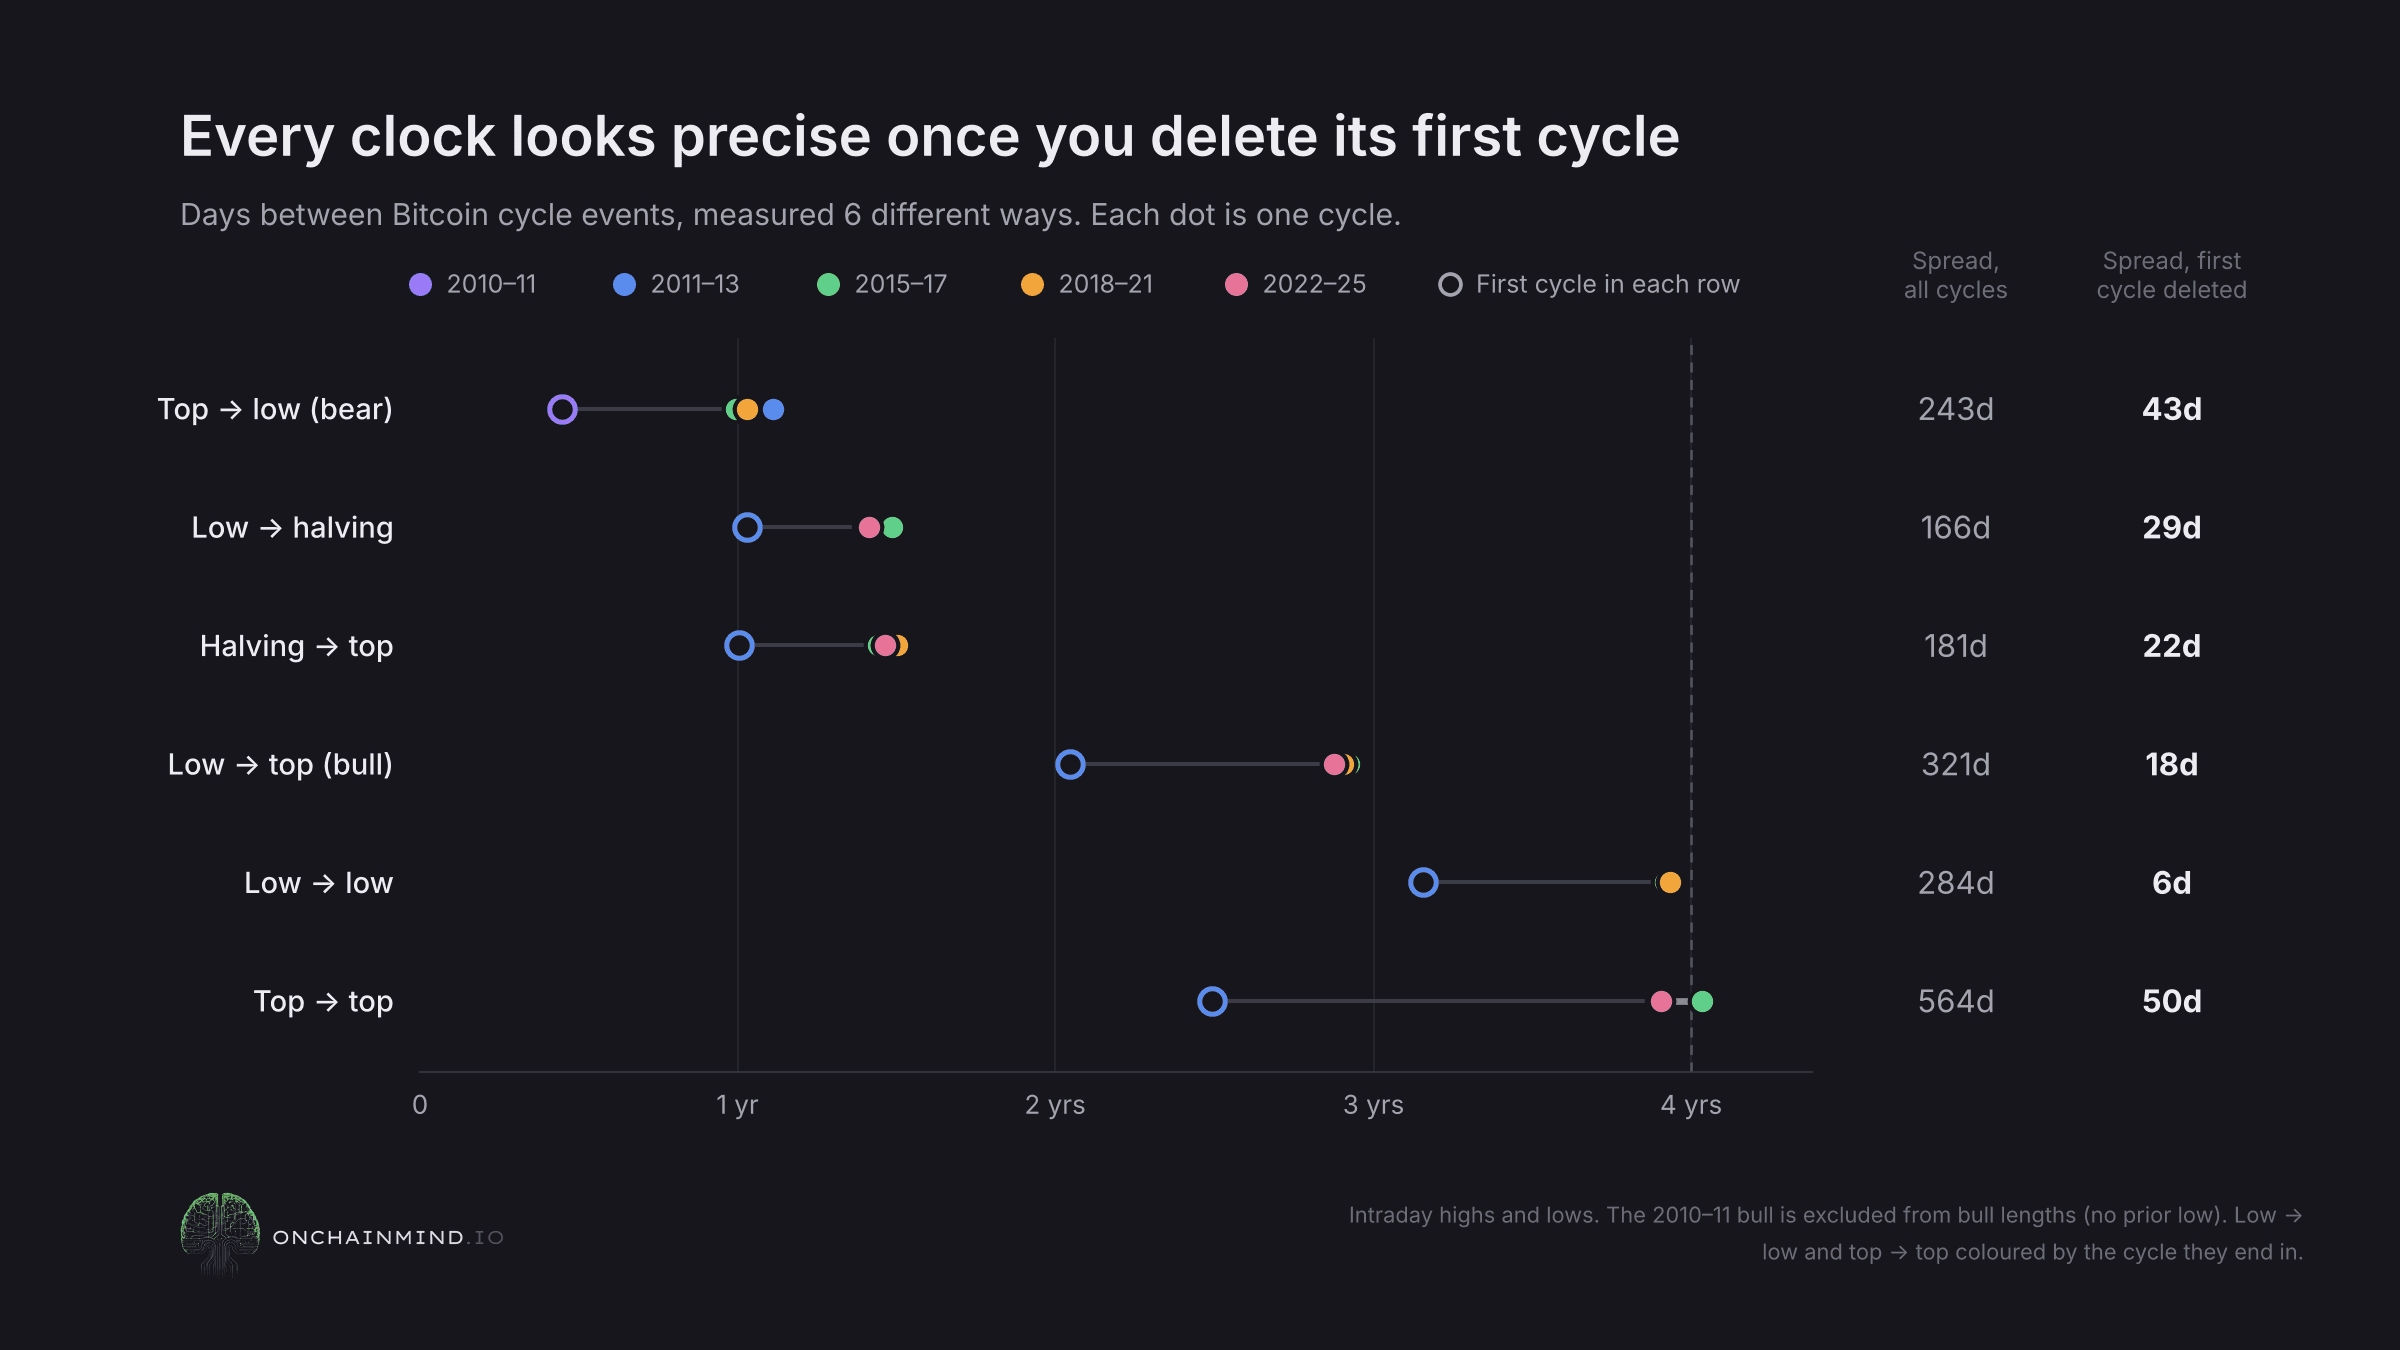
Here's the question I'd love every cycle analyst to answer before showing me a single chart: when does the cycle start?Because nobody agrees.
Spend a week watching cycle content and you'll find at least 5 different clocks in circulation:
The halving clock: the cycle begins at the halving, and the top arrives roughly 12 to 18 months later.
The bottom clock: the cycle begins at the bear market low. The top follows roughly 3 years later, and the next low roughly 4 years later.
The top-to-top clock: the cycle runs from one euphoric peak to the next.
The calendar clock: count from the yearly open. Post-halving years are for tops, the year after is red, and the low lands in Q4 (or "technically Q1").
The symmetry clock: the bottom arrives roughly 500 days before the halving, and the top roughly 500 days after.
Each arrives with total confidence and its own casualties. The symmetry clock only works from 2015 onwards, because in the first cycle the gaps either side of the halving were closer to 370 days. The bottom clock only works once 2011 is deleted. The halving clock, as you're about to see, only works if you delete 2013 instead.
Even 2 analysts using the same anchor rarely publish the same day counts, because one uses intraday wicks, another daily closes, and a third a different exchange's early prints.
That's 5 clocks, 3 cycles and several ways to read every date. Dozens of possible framings, and you only ever get shown the one that looks best.
Even the Halving Isn't 4 Years
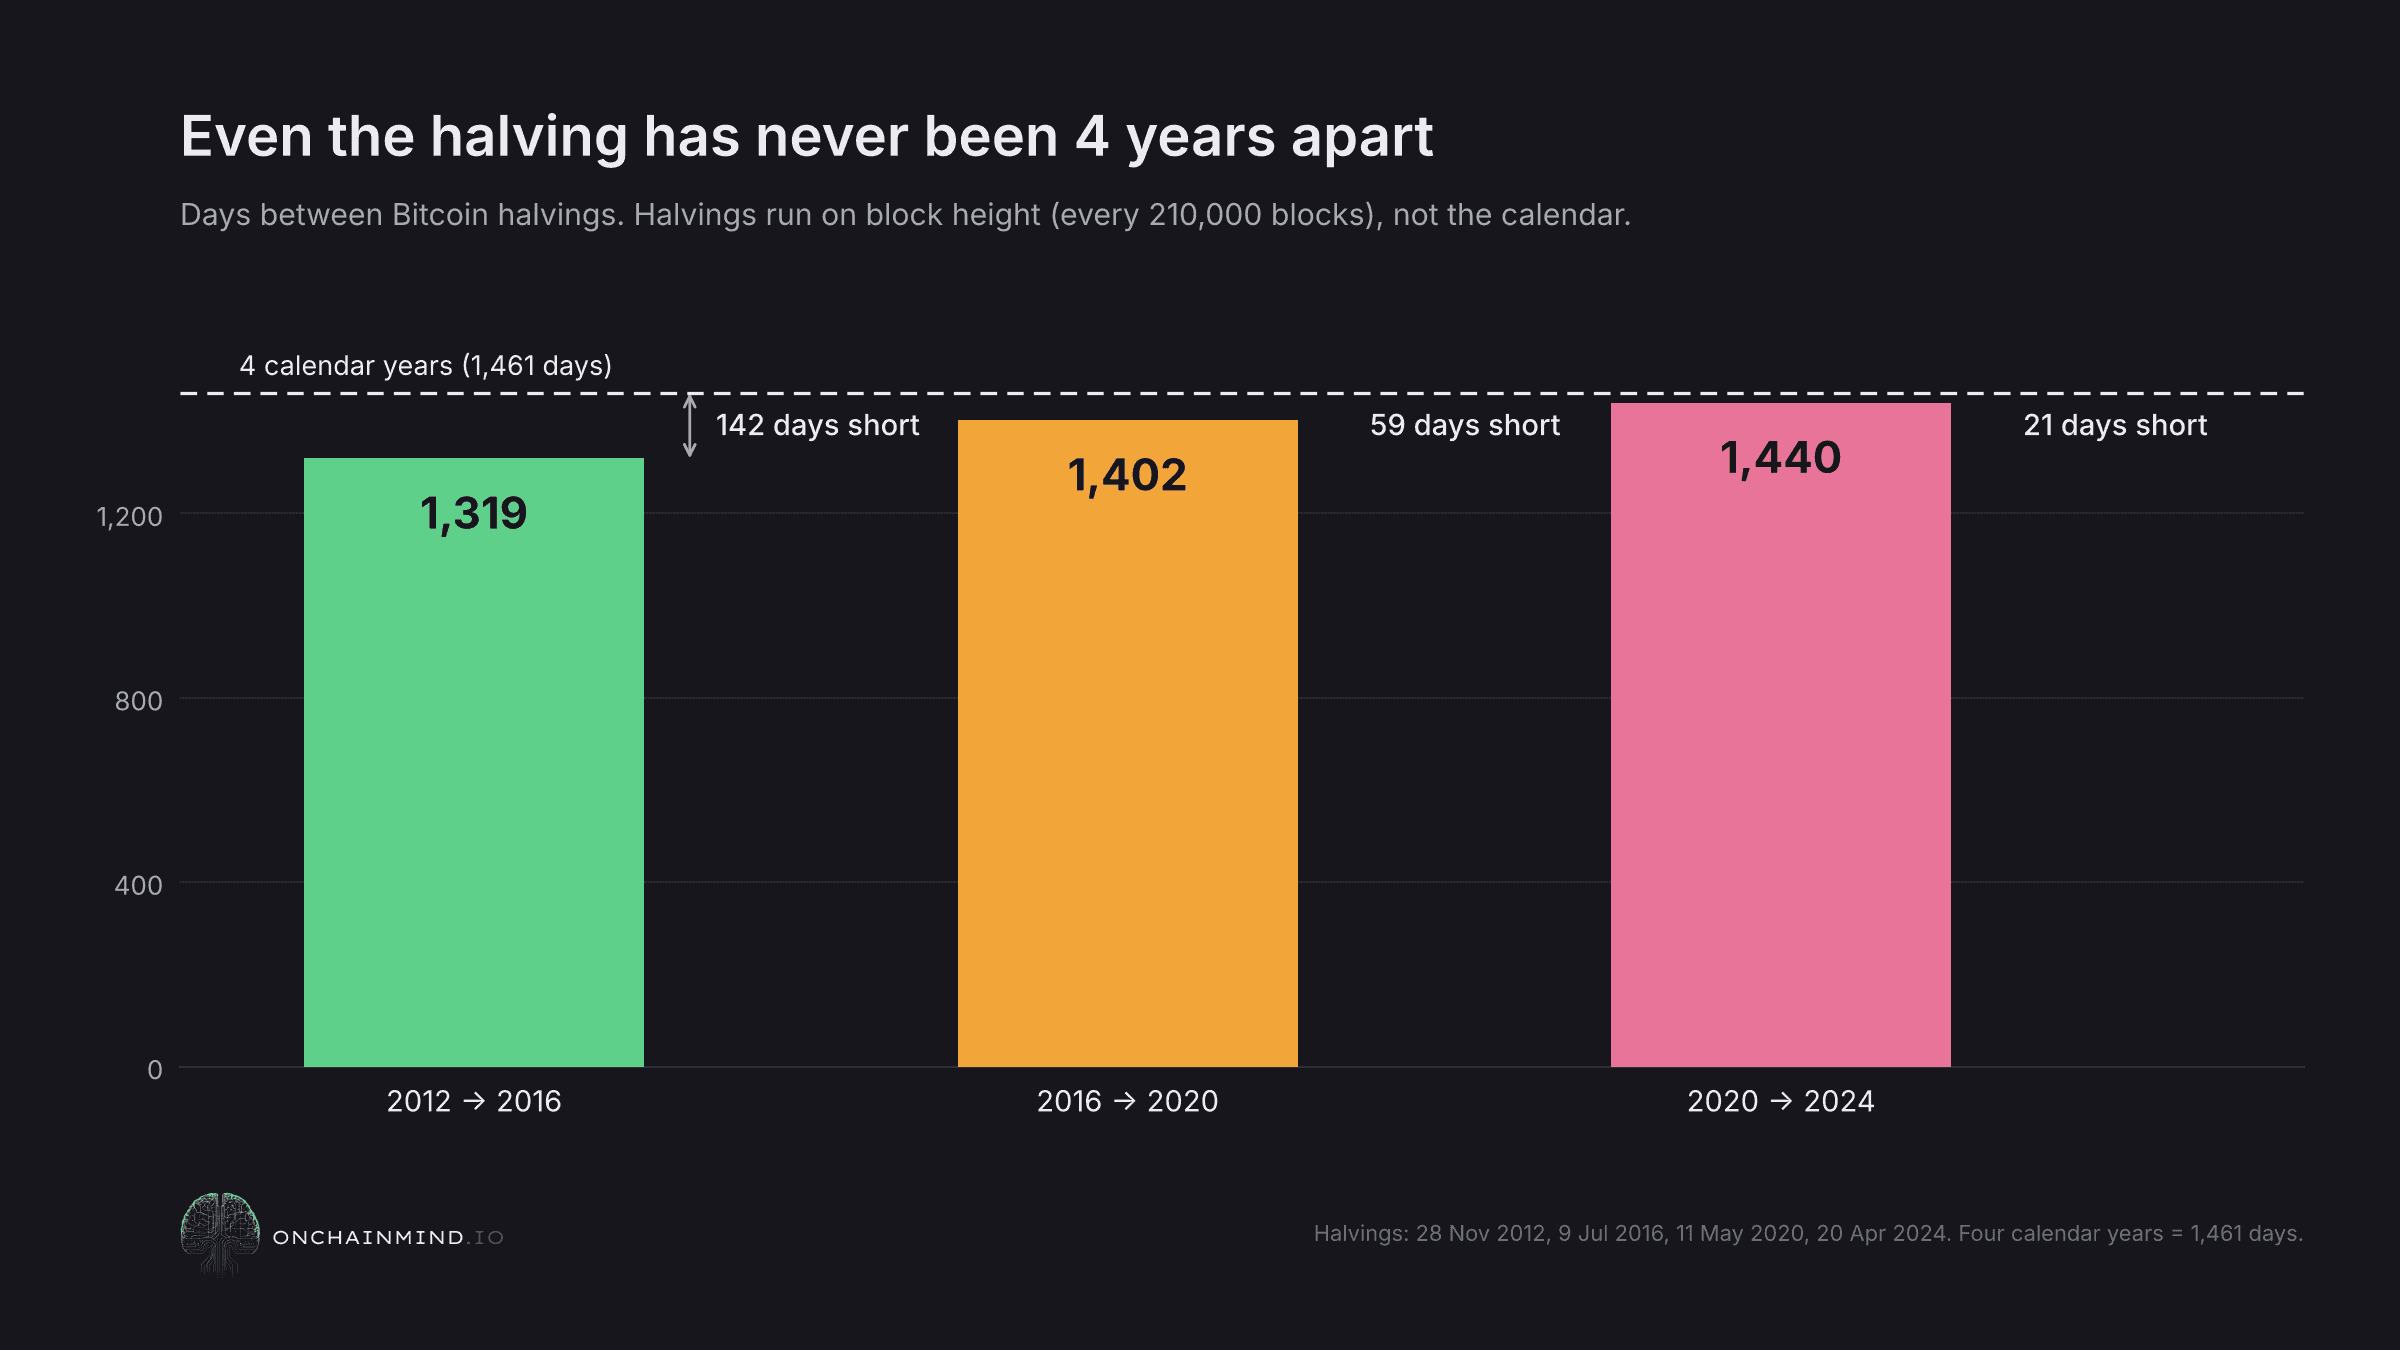
Here's the detail I find genuinely funny once you see it. The halving, the event the entire theory was built around, has never once arrived 4 years after the previous one.
The halving isn't scheduled by date. It's scheduled by block height, every 210,000 blocks. At the target of one block every 10 minutes, that works out at roughly 1,458 days.
In practice, hash rate has grown so relentlessly that blocks have tended to arrive faster than the target, because the difficulty adjustment only catches up every 2,016 blocks. The result:
2012 to 2016: 1,319 days
2016 to 2020: 1,402 days
2020 to 2024: 1,440 days
The first gap came in almost 5 months short of 4 calendar years. So if the halving truly drives the cycle, the cycle runs on blocks, not months. And I can promise you that nobody telling me they're "buying in October" is counting blocks.
That's what makes the calendar version of this theory so strange. It takes an event defined by computation, rounds it to the nearest year, and then treats the rounding as the law.
When You Change the Anchor, the Pattern Vanishes
Now let's test the clock the whole theory was originally built on. Here are the halving-to-top intervals:
371 days from the 2012 halving to the 2013 top
526 days from the 2016 halving to the 2017 top
548 days from the 2020 halving to the 2021 top
That's a 177-day spread between the shortest and the longest. Anchor from the halving, the event that was supposed to cause the cycle in the first place, and the much-advertised precision disappears.
I already know the reply, because I've heard it many times: "Drop 2013, it was a different era." Do that, add the April 2024 halving to the October 2025 top, and you get 526, 548 and 534 days. Suddenly it looks precise again.
That is exactly my point. Delete 2011 and the bottom clock looks neat. Delete 2013 and the halving clock looks neat. Every version of the clustering depends on which cycle you've decided doesn't count, and the cycle that doesn't count changes depending on which clock you're selling.
And where several clocks do appear to agree for the post-2015 cycles, don't mistake that for independent confirmation. If bull runs are similar lengths and bear markets are similar lengths, then top-to-top and bottom-to-bottom will look similar too. That isn't 5 clocks agreeing. It's the same 3 cycles measured 5 different ways, then counted as 5 pieces of evidence.
3 Engines, 1 Coincidence
The bigger problem is that each cycle had its own engine, and none of them was a clock.
2017 was a retail frenzy fuelled by the ICO boom, when tokens launched on little more than a whitepaper and money poured in from people buying crypto for the very first time. Its top lined up perfectly with the launch of CME futures, creating the bubbles of all bubbles.
2021 was a liquidity story. COVID stimulus, zero interest rates and a flood of cheap money lifted almost every risk asset at once, from tech stocks to NFTs, not just Bitcoin.
The 2022 crash wasn't a "scheduled bear year" either. It was an asset-wide shock from the fastest Fed hiking cycle in four decades, with Luna, Three Arrows Capital and FTX imploding on top. Who could have scheduled that?
Three completely different causes landing roughly 4 years apart is a coincidence of timing, not proof of a mechanism.
For context, the Super Bowl indicator called the stock market's direction correctly in the large majority of years for decades, across far more than 3 data points. Nobody thinks football moves markets. At least I hope not. And once it became famous, it became far less reliable. Hold that thought.
1 Million Simulations
I've watched a lot of 4-year cycle videos recently, and as someone with a degree in physics, I can't let the methodological problems in them slide. The scaffolding holding up the whole argument is, frankly, not sound.
Here's the test.
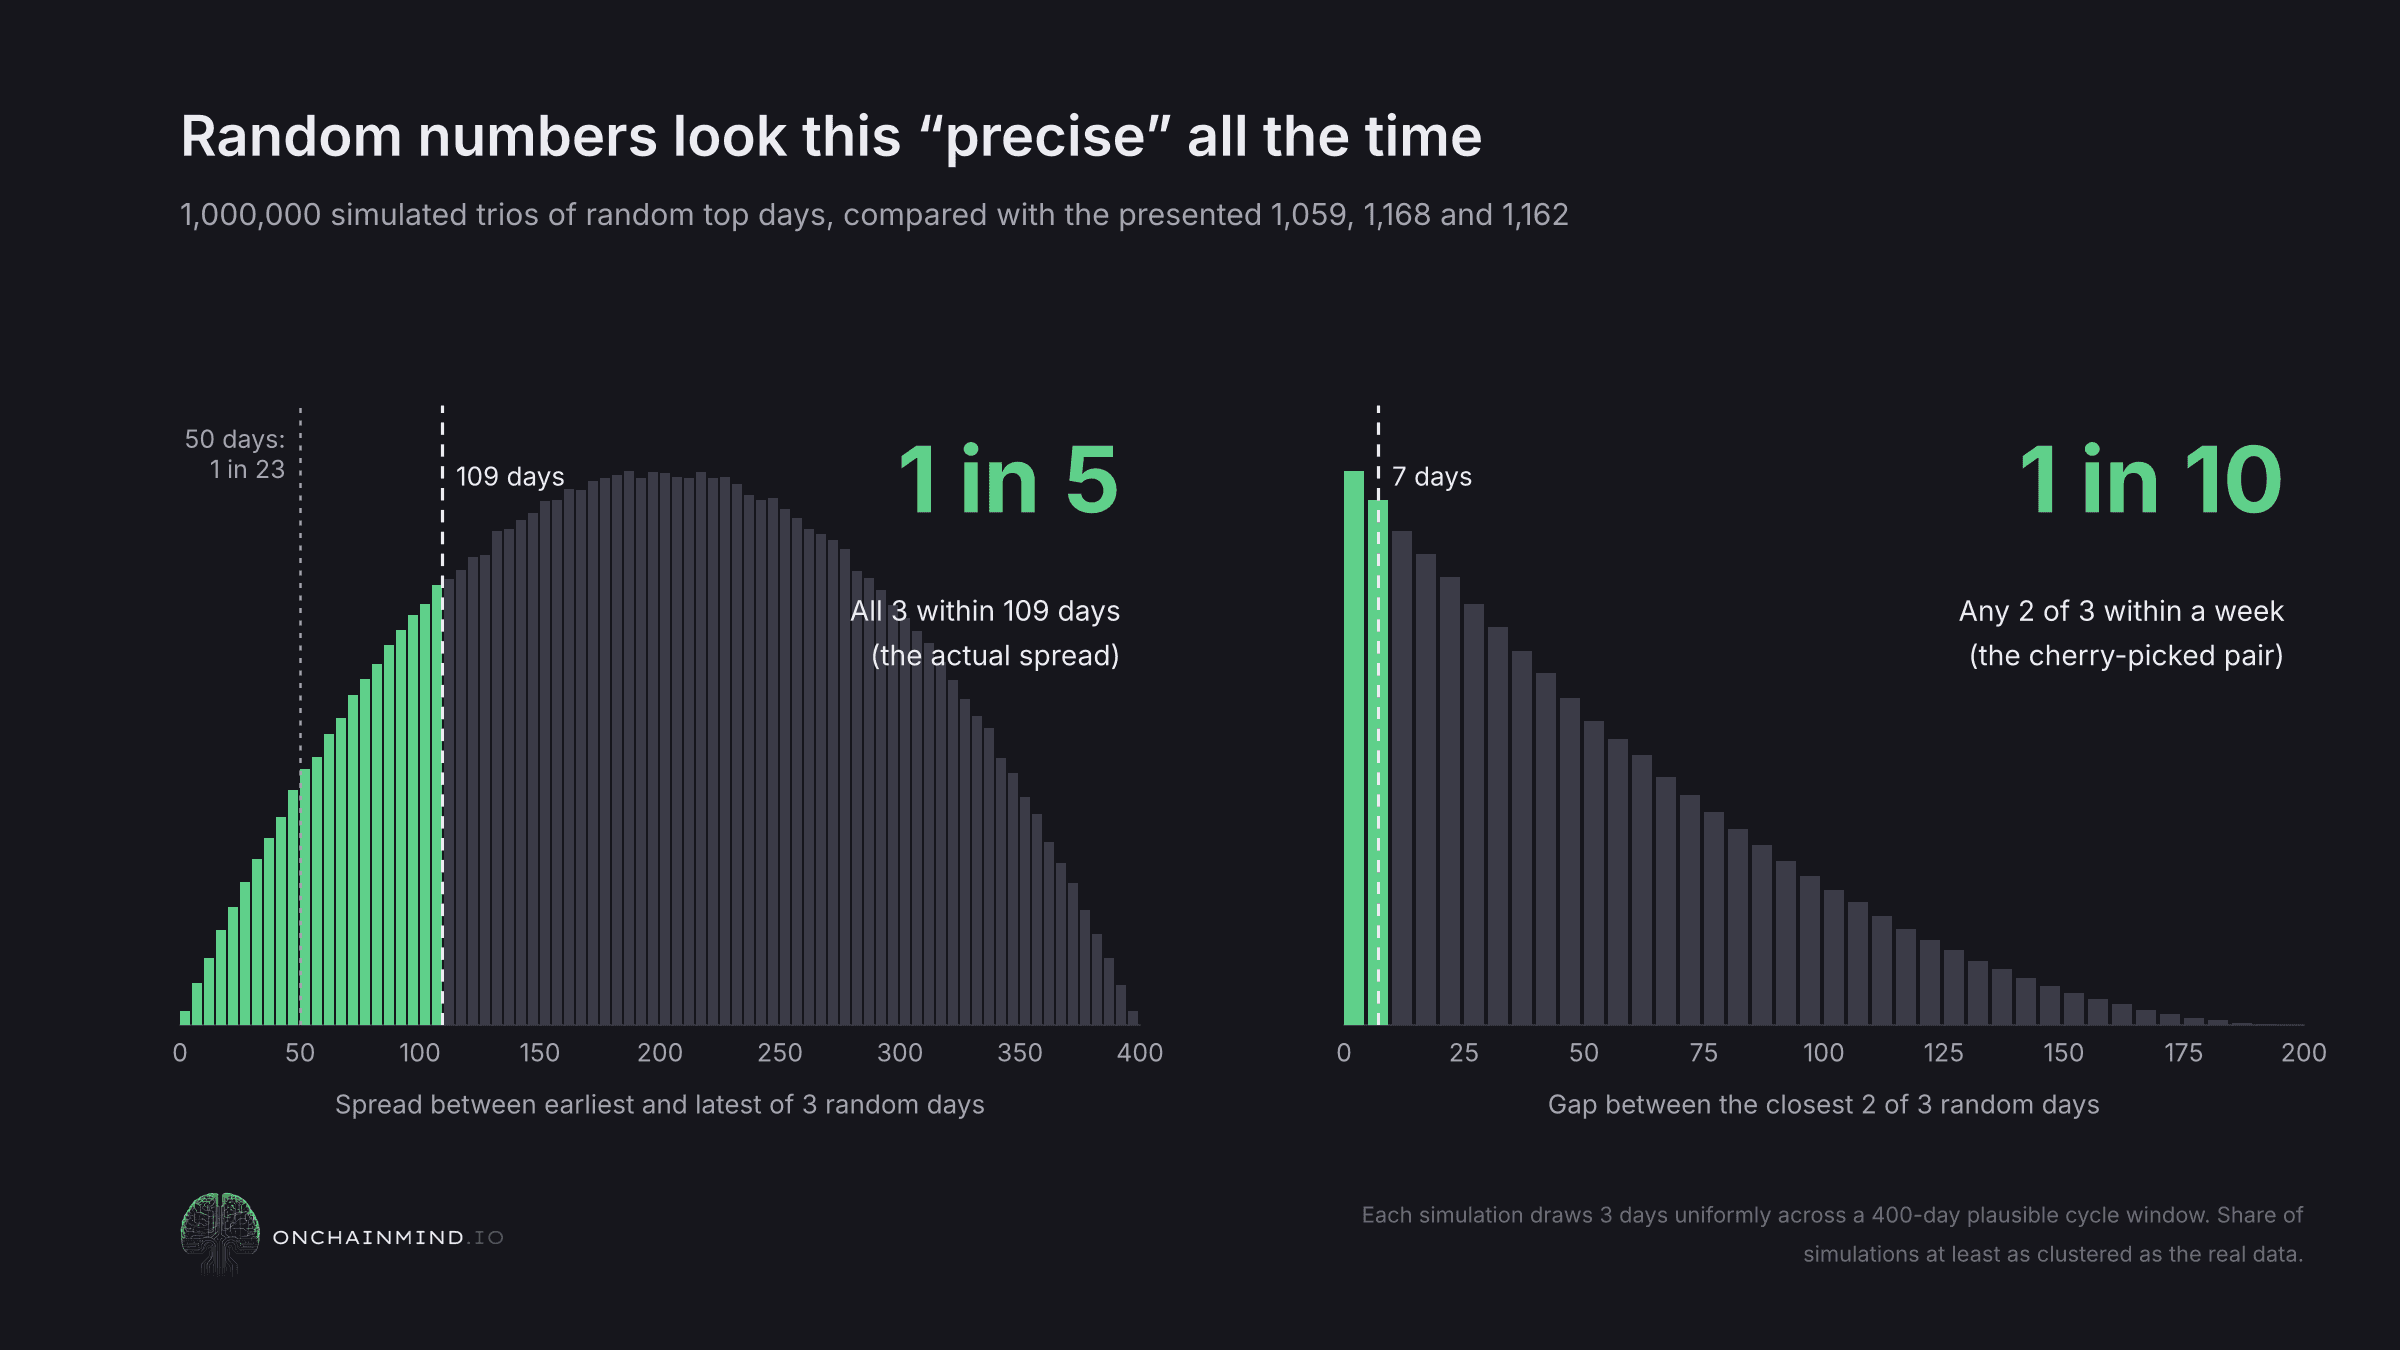
I took the 3 numbers being presented as evidence of a cycle (days 1,059, 1,168 and 1,162) and asked a simple question: if these numbers were entirely random, how often would they look this clustered by pure chance?
To find out, I ran a Monte Carlo test, the same brute-force approach physicists reach for when a problem is too messy to solve neatly on paper. I ran 1 million simulations, each drawing 3 random "top days" from a plausible cycle window of roughly 13 months, then checked how often the random results clustered as tightly as the real ones.
The results are hard to ignore:
All 3 landing within 109 days of each other (the actual observed spread): 1 in 5.
All 3 within 50 days: 1 in 23.
Any 2 of the 3 within a week (the 1,162 and 1,168 pair): 1 in 10.
That last line is the one doing the heavy lifting in the cycle videos, and it's the most misleading. The "within a week"framing only sounds impressive because it quietly drops the 1,059 outlier and zooms in on the closest pair. That's cherry-picking, and once you correct for it you're looking at a 1-in-10 result.
That isn't a signal. Hand me 10 sets of completely random numbers and, on average, one of them will look this "precise".
The Garden of Forking Paths
Now add the free parameters back in.
The cycle can be measured from the prior low, the halving, the prior top, the yearly open or the halving midpoint. None of these is a law of nature. Each is a choice, and every choice is another roll of the dice.
Try just 5 of them, and the odds that at least one shows all 3 cycles within 50 days rise to as much as 1 in 5. The clocks overlap, as we've seen, so treat that as a ceiling rather than an exact figure. But it's also before you add wicks versus closes, or one exchange's prints versus another's, and every one of those choices opens another path.
Statisticians call this the garden of forking paths. Nobody has to cheat. You simply spot the framing that looks neat and show that one. The paths you didn't take stay invisible.
There's an older name for it too: the Texas sharpshooter fallacy. Fire a load of bullets at the side of a barn, then paint the target around the tightest cluster of holes.
That's the 4-year cycle in a nutshell. The numbers are real, but the precision is illusory, because the analyst chose the parameters that produced it after seeing the data.
Unfalsifiable by Design
Watch how the cycle gets defined by different analysts, and the goalposts start to look like they're on wheels:
It's about lows, not tops, except when the tops also fit.
Cycles can be "left-translated" or "right-translated", meaning they can top early or late, at your convenience.
The low can be in Q4, or Q1 of the following year.
And the explicit hedge: "Will the 4-year cycle last forever? Probably not."
With left and right translation each allowing several months of slippage, plus the Q4-or-Q1 elasticity, the effective prediction window ends up roughly 12 months wide. At that point the forecast is that Bitcoin will make a low at some point during a 12-month stretch, which is trivially true for an asset this volatile.
The escape hatches don't stop there. A long cycle becomes "lengthening cycles". A short one is "front-running". An all-time high before the halving is "the ETF effect". If Bitcoin bottoms in October, believers claim vindication. If it doesn't, the cycle was "left-translated", macro overrode it, and it resumes next time.
A theory with an explanation ready for every outcome isn't explaining anything.

What Actually Drives the Cycle
If the calendar isn't driving this, what is? The same few things that drive every market: liquidity, leverage and who holds the coins.
Liquidity sets the tide. Bitcoin is highly correlated with it, and ever-expanding liquidity is basically the trade we are making. Cheap money lifted almost everything at once in 2021, and tightening drained it in 2022. Leverage amplifies the move in both directions. Then holders decide how long it lasts: long-term holders sell into strength, new buyers arrive late, and forced sellers mark the low. That loop of greed, leverage, euphoria, fear and exhaustion is the cycle, and it runs on what people do, not on a timer.
Even the strongest version of the cycle argument has moved here. It says: "Bitcoin cycles aren't really halving cycles, they're macro liquidity cycles that happen to run on a similar cadence." That deserves real engagement, because it's the only version with a substantial mechanism behind it. But global liquidity cycles are not 4 years long. M2 growth, real yields and credit conditions move on highly variable timescales, driven by central bank reaction functions, fiscal policy and geopolitical shocks. The 2020 stimulus was a regime shock, not a periodic event. The 2022 tightening ran on the Fed's reaction to inflation, not on a 4-year timer.
Notice, too, that this quietly concedes the whole argument. If the cycle lines up with liquidity and Fed policy, then macro is the real driver. Forecasting Bitcoin's cyclicality (which I think is partly true) then means forecasting liquidity, not counting months on a calendar. The 4-year frame is doing no work.
And unlike almost any other market, Bitcoin lets you watch the people doing it. The ledger is public, so on-chain data shows what the old money is up to, how long coins have sat still and when they finally move. It shows who is in profit and who is underwater, which tells you who is incentivised to spend, who is incentivised to take profits and who is being pushed towards capitulation. And it shows who actually does it.
Incentives are a theory. The spending is the receipt.
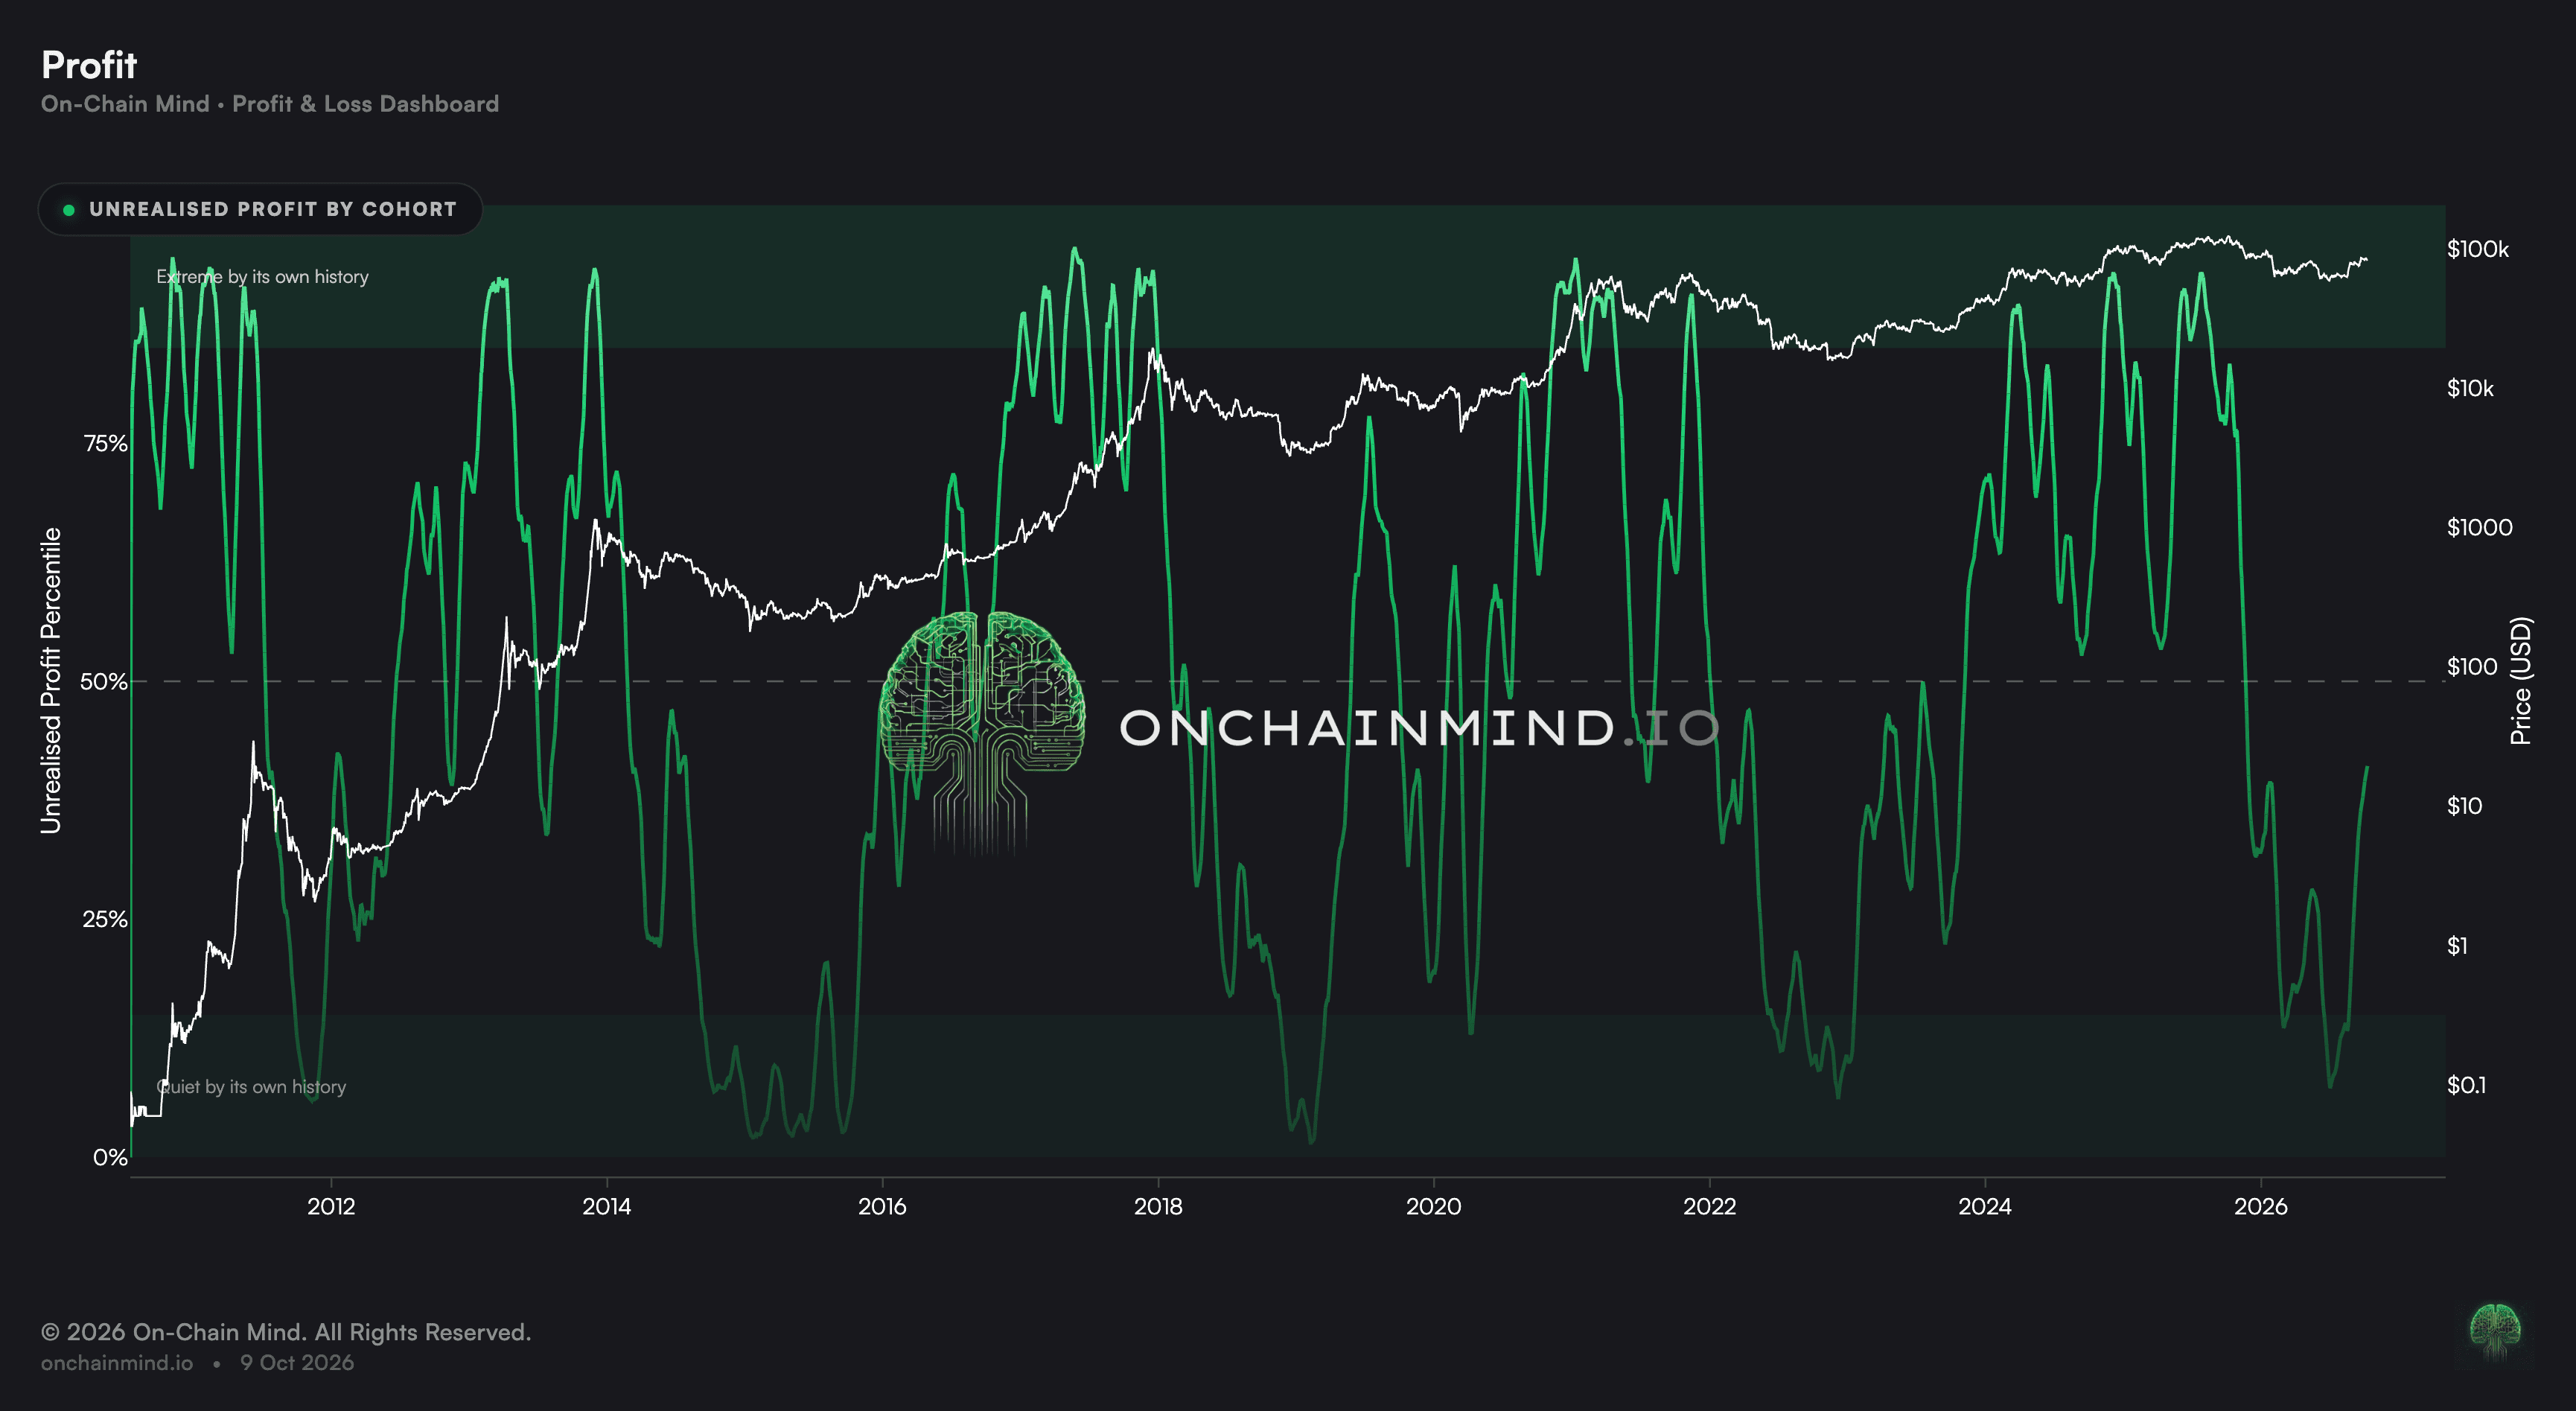
The unrealised profit of the total Bitcoin supply. The largest records of paper gains lines up with market tops. The largest degree of pain lines up with market bottoms.
"But Don't Stocks Have a 4-Year Cycle?"
This one comes up constantly.
What equities have isn't a 4-year cycle. It's ordinary business cycle variation that happens to average somewhere around the 4-year zone. Economists call the shortest of these rhythms the Kitchin cycle, after Joseph Kitchin, who identified it in the 1920s. It averages roughly 40 months, and it's driven by something real: businesses over-ordering inventory, then cutting back, with credit conditions amplifying both swings.
The crucial word there is average. Individual Kitchin cycles vary widely in length, and nobody serious uses them to pick the month they buy.
It's documented economics, not numerology, and borrowing its name doesn't transfer its mechanism to Bitcoin. Pointing at a 4-ish-year rhythm in stocks and declaring Bitcoin's cycle validated is a false analogy in textbook form: two things look alike on the surface, so we assume they share a cause.
Every Consensus Cycle Decays
Bitcoin isn't the first market where pattern-watchers have been confident about periodicity, and history has a very consistent message for them.
The US presidential cycle in equities: the 4-year pattern linking stock returns to the political calendar was a celebrated statistical finding for decades. Since the turn of the century it has become far less reliable, as Fed policy and global capital flows overwhelmed the original signal. It still gets quoted. It no longer predicts.
The January effect: the tendency for small caps to outperform in January was so well documented that it made it into finance textbooks. Once it became consensus and tradeable, it began to decay, arbitraged away by the very people who'd learnt about it.
The academic graveyard: researchers David McLean and Jeffrey Pontiff tracked 97 published stock market patterns that had predicted returns. In a 2016 paper in the Journal of Finance, they found that once the original research on each pattern was published, its returns fell by 58% on average. They attribute about 32 percentage points of that decline purely to investors trading on what they'd read.
The lesson is consistent. Cycles work until they become consensus, and then they don't.
The mechanism is reflexivity. Once everyone expects a top in year 4, traders sell earlier to beat the crowd, the top arrives earlier, and the timing breaks.
The same applies to bottoms, and this is where it gets a little awkward. Plenty of people were planning to buy "in October regardless of price". If enough of them had done it, they would have manufactured the very low they were predicting. Instead, the low turned up on nobody's schedule.
That's the problem with a coordination game: it has an expiry date. It works while the crowd is small, and it breaks the instant positioning gets crowded. This one broke before the date even arrived.

The Clock Doesn't Make You Hungry
I don't want anyone walking away thinking I've dismissed cycles altogether. I haven't.
Bitcoin absolutely moves in cycles. Greed builds into leverage, leverage into euphoria, euphoria collapses into fear, and fear eventually exhausts itself into the quiet, miserable accumulation that births the next run. That rhythm is as old as markets themselves.
But it comes from people, not from a calendar. The clock doesn't predict lunchtime. Hunger does, and hunger doesn't check what the time is.
The 4-year cycle isn't dead. It was never really alive. It was a good story told about 3 data points.
Every number in this piece can be checked, rerun and challenged. That's the standard I'm asking cycle analysts to meet. Pick one anchor in advance. State one window, no wider than a quarter, with no translations and no "technically Q1". Then stand by it.
An untestable framework, even one that occasionally lands on the right answer, is indistinguishable from astrology. The difference between analysis and astrology is whether you'd stake your prediction on falsifiable criteria.
And we don't need the astrology. Bitcoin is the first asset in history where the fundamentals aren't a matter of opinion. Every coin, every holder cohort and every flow of supply and demand sits on a public ledger, in plain sight. You can't argue with a transaction.
So stop counting months. Study what the network is actually doing: who is buying, who is selling, and how much pain they're prepared to sit through.
That is the only cycle worth tracking.