
10 Subscriber Questions on the ETH/BTC, Spot ETF Options, SUI, and the $100k ‘Line in the Sand’
Today, we’re diving into 10 great questions submitted by you, ranging from the structural shift in Ethereum’s dominance and the impact of the new spot options market to managing leveraged MSTR positions and my latest technical outlook on SUI.
There’s a lot of great questions again, so let’s dive straight in!
1. ETH/BTC Ratio: Is the "Flippening" Narrative Finally Dead?
Question: Ethereum has lagged Bitcoin for years now for the most part. With the ETH/BTC ratio showing signs of life in 2025, do you think ETH will finally outperform this year, or is BTC the only safe macro play?
My Thoughts: The ETH/BTC ratio has been a painful trade for many, but we are finally seeing a structural shift. The rotation from "stable" Bitcoin into the high-beta plays like Ethereum typically happens when Bitcoin dominance hits a ceiling, which we are seeing right now around current levels.
On-chain, we see Ethereum's network fees and L2 activity hitting record highs. While Bitcoin remains the pristine collateral, I do believe Ethereum could be the liquidity vacuum. I expect ETH to outperform on a percentage basis in the latter half of 2026 as the regulatory path for DeFi becomes even clearer.
According to the Logarithmic Risk, we’re basically at fair value (55% risk) for ETH/BTC at the current levels of 0.035. The maximum 100% risk scenario currently stands at 0.072. So if we start heading up to that sort of territory on this ratio, I would begin to consider a safe rotation strategy back to BTC.
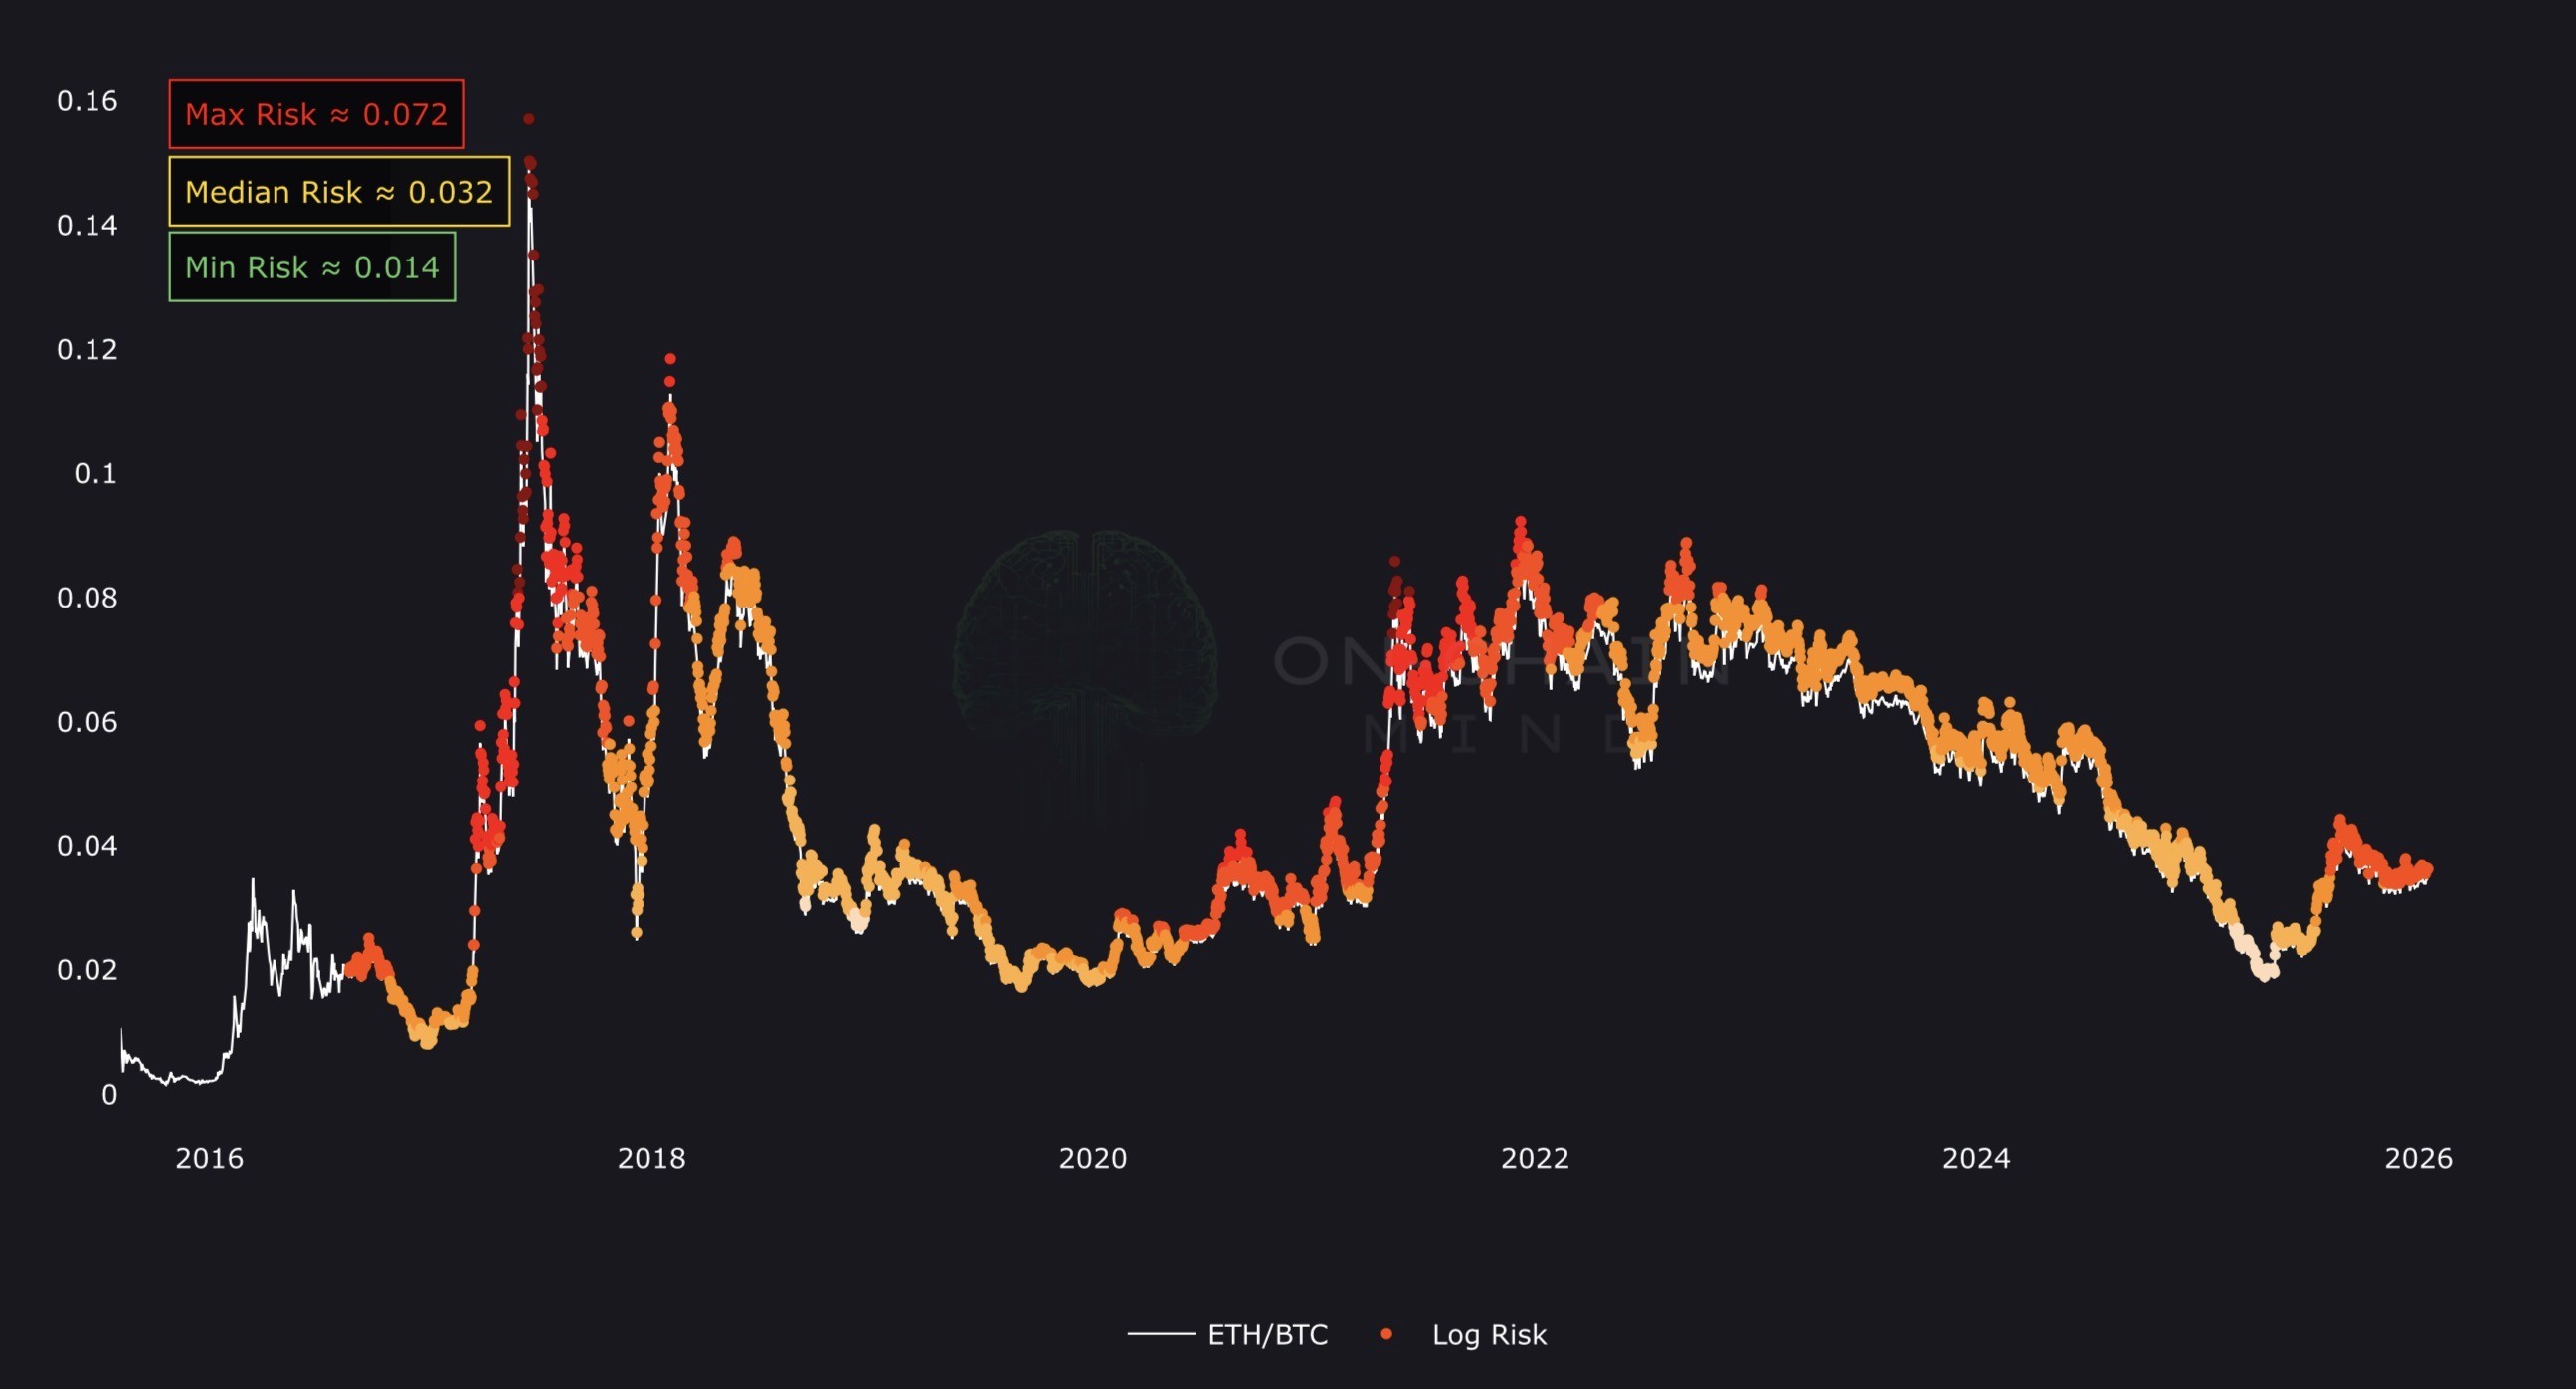
ETH/BTC Logarithmic Risk
2. Why is the $85k-$97k Price Range is So Sticky?
Question: We’ve been stuck in this sideways range for a while now. Why can't we just break $100k and stay there?
My Thoughts: This is classic re-accumulation event. When you have massive entities like the ETFs and Strategy buying, you also have legacy LTHs from 10+ years ago who see $100k as a psychological life-goal to take profits. This creates a massive wall of supply that the market must chew through.
As I highlighted in a recent piece A Violent Move Is Coming for Bitcoin we correctly foresaw the rally toward $100k, but I defined this specific region as the "ultimate line in the sand". This is because we have three of the most critical technical and on-chain levels all converging at once: the Short-Term Holder Realised Price, the 365-Day MA, and the 200-Day MA.
When these high-confluence levels cluster together, they act like a magnetic ceiling. Breaking through them requires a massive catalyst of liquidity. However, there is a silver lining: the longer we spend consolidating below $100k, the more coiled the spring becomes. This sideways price action is building a formidable base of support, and once we finally clear the $100k hurdle, the subsequent move is likely to be far more explosive than if we had just wicked through it on the first attempt.
3. Impact of the Federal Reserve Leadership Change
Question: Jerome Powell’s term as Fed Chair ends in May 2026. How do you expect the market to react to a potential Trump-appointed successor, and will it affect any metrics you track?
My Thoughts: Markets hate uncertainty, so the lead-up to May might bring some volatility. However, the macro trajectory is larger than one individual. Whether it’s Powell or a new appointee, the mandate remains the same: manage the debt and maintain liquidity. If we see a more dovish appointment, the M2 expansion could accelerate, which would be like throwing jet fuel on Bitcoin's price (with a certain lag, of course). The trend is already leaning toward easing, and Bitcoin is priced for that reality.
As always, I’ll be watching my usual probabilistic models, especially ones like the Z-Score Probability Waves, to see how statistically overstretched we are, if price starts to go a bit wacky.
5. Dealing with "Information Overload"
Question: With so many metrics out there, how do you stay focused? I find myself looking at 20 different charts and getting conflicted signals.
My Thoughts: This is the classic "analyst's trap”. While it’s okay for guys like me to plough through hundreds of different indicators per week, I would advise anyone feeling this sense of information overload to stick to a core group that you trust.
I have marked my personal favourites with a ⭐️ symbol. If you simply type that “⭐️” into the search bar of each section, you can see all my favourite metrics to track. This should narrow it down a lot. There is also my Top 10 metrics in the OCM Essentials section which narrows it down even further.
I’m looking to build out a function that allows you to select and save your own personal favourite indicators on the platform. So stay tuned for that!
6. On-Chain vs. Off-Chain: Does the Data Still Mirror the Market?
Question: I have been following your great work on YouTube. I’m new to Bitcoin and just joined Premium. Since so much trading now happens "off-chain" (ETFs, CEXs, Futures), is your on-chain analysis still a close proxy for the overall ecosystem, or is there an adjustment we should make for the off-chain volume?
My Thoughts: This is a classic Orange Pill question. You’re correct that on a pure volume basis, significantly more capital moves off-chain via centralised exchanges and the relatively new spot ETFs. However, on-chain data remains our "Source of Truth" because it tracks the settlement of finality.
Sometimes off-chain signals can really bring a lot noise. While a high-frequency bot can trade 1,000 BTC back and forth on an exchange without it ever touching the blockchain, the moment a whale or an ETF provider moves coins into cold storage, it creates a permanent on-chain footprint. That is where we see true investor psychology. Whether it’s an ETF buyer or a retail HODLer, their conviction is measured by how long those coins stay put. The off-chain markets eventually have to reconcile with the on-chain reality of supply and demand. On-chain is where we see the smart money prepare for the next move before the dumb money on the exchanges even realises what’s happening.
The presence of these additional data sources (e.g. ETFs and derviatives) doesn’t diminish the value of on-chain metrics; rather, it enhances the analysis by providing complementary perspectives, enabling better cross-verification, and highlighting any meaningful divergences when they arise.
7. Bitcoin as a "Risk-Off" vs "Risk-On" Asset
Question: In 2026, is Bitcoin still a risk-on asset like tech stocks, or has it finally become risk-off like Gold?
My Thoughts: It’s transitioning, but it’s still risk-on in the eyes of most fund managers. And that’s really what matters now. When the S&P 500 dumps, Bitcoin usually follows… at first. But notice how quickly Bitcoin recovers compared to small-cap tech.
In my eyes, it’s becoming risk-off in terms of its fundamental properties, and that’s certainly how I view it. But it’s still risk-on in its price behaviour, for now. Until it’s a $100T asset held by every central bank, it will likely stay high-beta for the foreseeable.
8. Spot IBIT Options and Volatility
Question: Now that Bitcoin ETF options are fully liquid, has the volatility of Bitcoin been suppressed?
My Thoughts: In the short term, yes. The introduction of deep liquidity in spot options, like IBIT, allows market makers to hedge their exposure with serious precision. This often leads to price pinning near Max Pain levels during major monthly expiry weeks, contributing to the "crab" markets we’ve seen lately. Market makers essentially act as a dampening force, absorbing volatility to maintain delta-neutral positions, which keeps the price range-bound.
However, this is a double-edged sword. While it suppresses daily noise, it also creates the potential for gamma squeezes. This occurs when a sudden price move forces market makers to buy or sell the underlying spot Bitcoin to re-hedge their options books. For example, if Bitcoin starts rallying substantially above $100k, market makers who sold call options must buy spot BTC to stay neutral; as the price rises, they must buy more BTC, creating a feedback loop of forced buying.
In 2026, volatility definitely isn't gone; it’s being structurally coiled, and the eventual release could easily be as violent as the organic moves of previous cycles.
9. Analysis: The Case for SUI in 2026
Question: I am really enjoying your analysis write-ups and videos. Can you please run your analysis on SUI?
My Thoughts: SUI has emerged as one of the few legitimate "Solana challengers" in this cycle, primarily due to its Move-based architecture which allows for massive parallelisation. From a technical standpoint, it’s a powerhouse. However, we have to look at the cycle dynamics. SUI had a massive run into early 2025, hitting an ATH above $5, but it has since entered a heavy re-accumulation phase, currently hovering in the $1.70-$1.90 range.
Its Sharpe Ratio is currently in one of its most favourable levels ever. So if you’re a net accumulator of this asset, then these are pretty compelling levels.
For me, SUI is a high-beta play. When my Momentum & Technical Risk tools flip positively on the ETH/BTC ratio, that’s usually the signal that capital is ready to flow into ecosystems like SUI. Until then, I treat it as a momentum trade rather than a "set and forget" macro hold like Bitcoin.
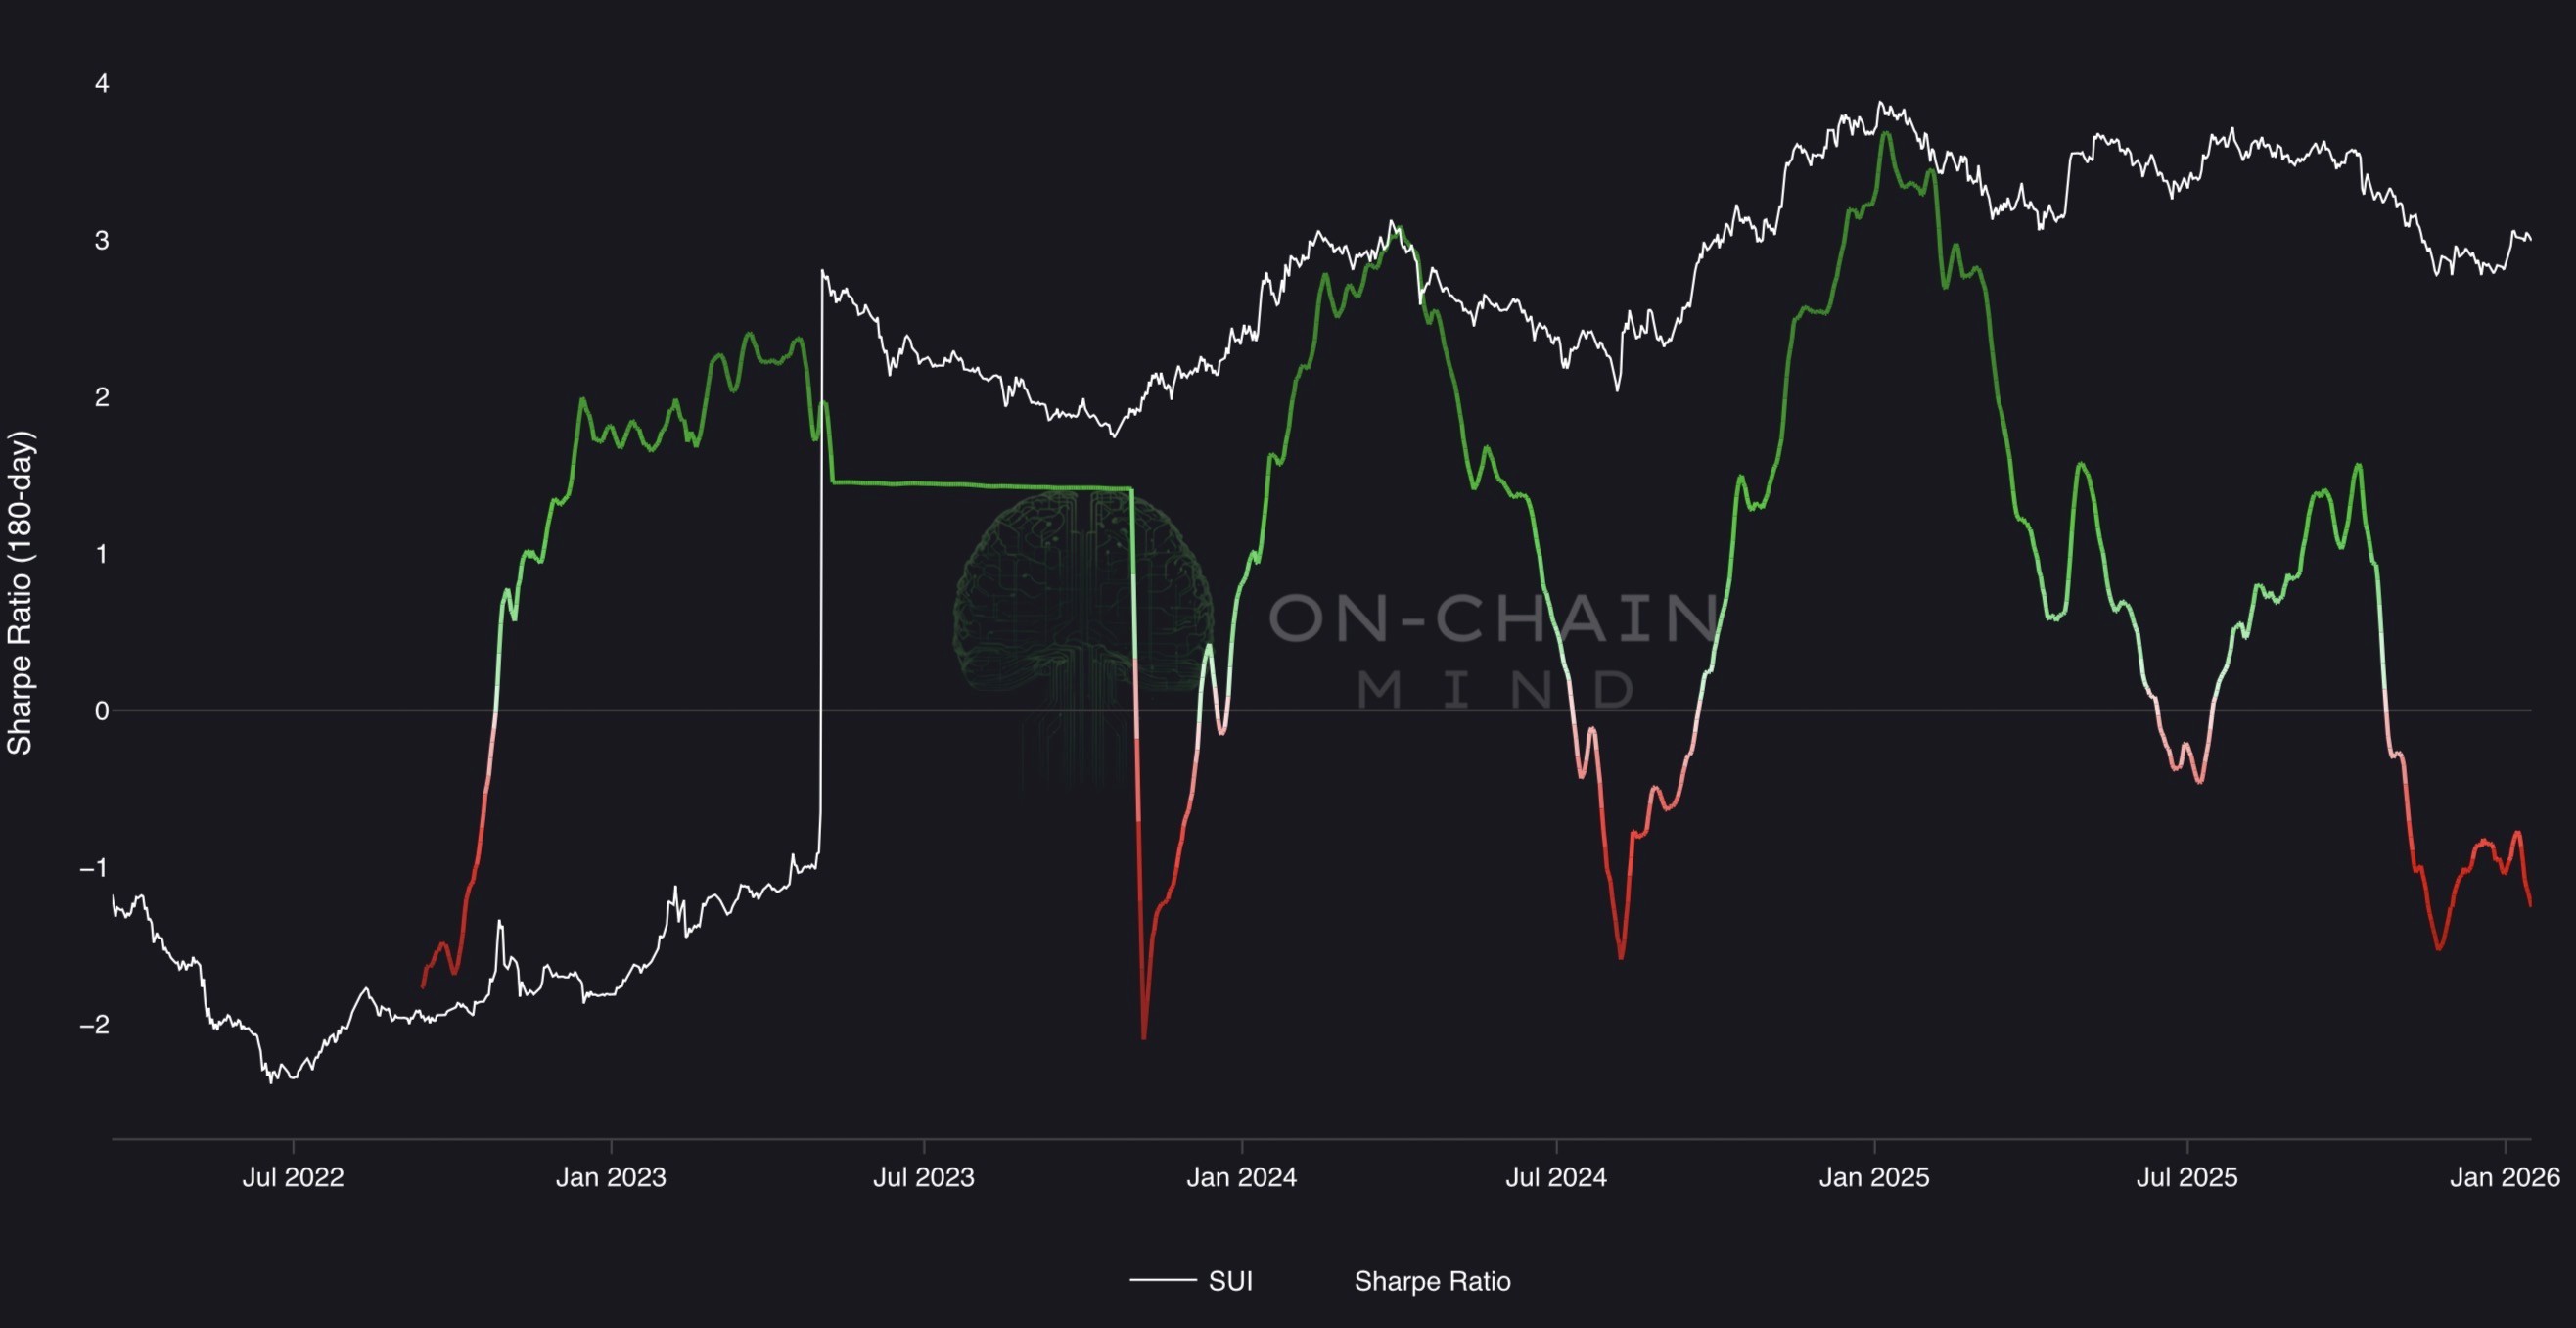
SUI Sharpe Ratio
10. The 50% Drawdown in 2026
Question: You mentioned a 50% drawdown is possible/probable. If the ETFs are buying every dip, is a 50% drop even possible anymore?
My Thoughts: Absolutely. Never underestimate the market's ability to punish the over-leveraged. While ETFs provide a spot floor, the perpetual and futures markets are where the danger lies. As we saw in October of last year, if we get a de-leveraging event, we can easily see a 30-40% drop in a single month.
The ETFs can't stop a panic; they can only provide the liquidity to recover from it. I keep my Z-Score Probability Waves chart up and look for the -2 SD (yellow) level on the weekly timeframe level noted at all times.
Currently, it is sitting at $77k. That’s where I’d be a huge buyer in a crash.
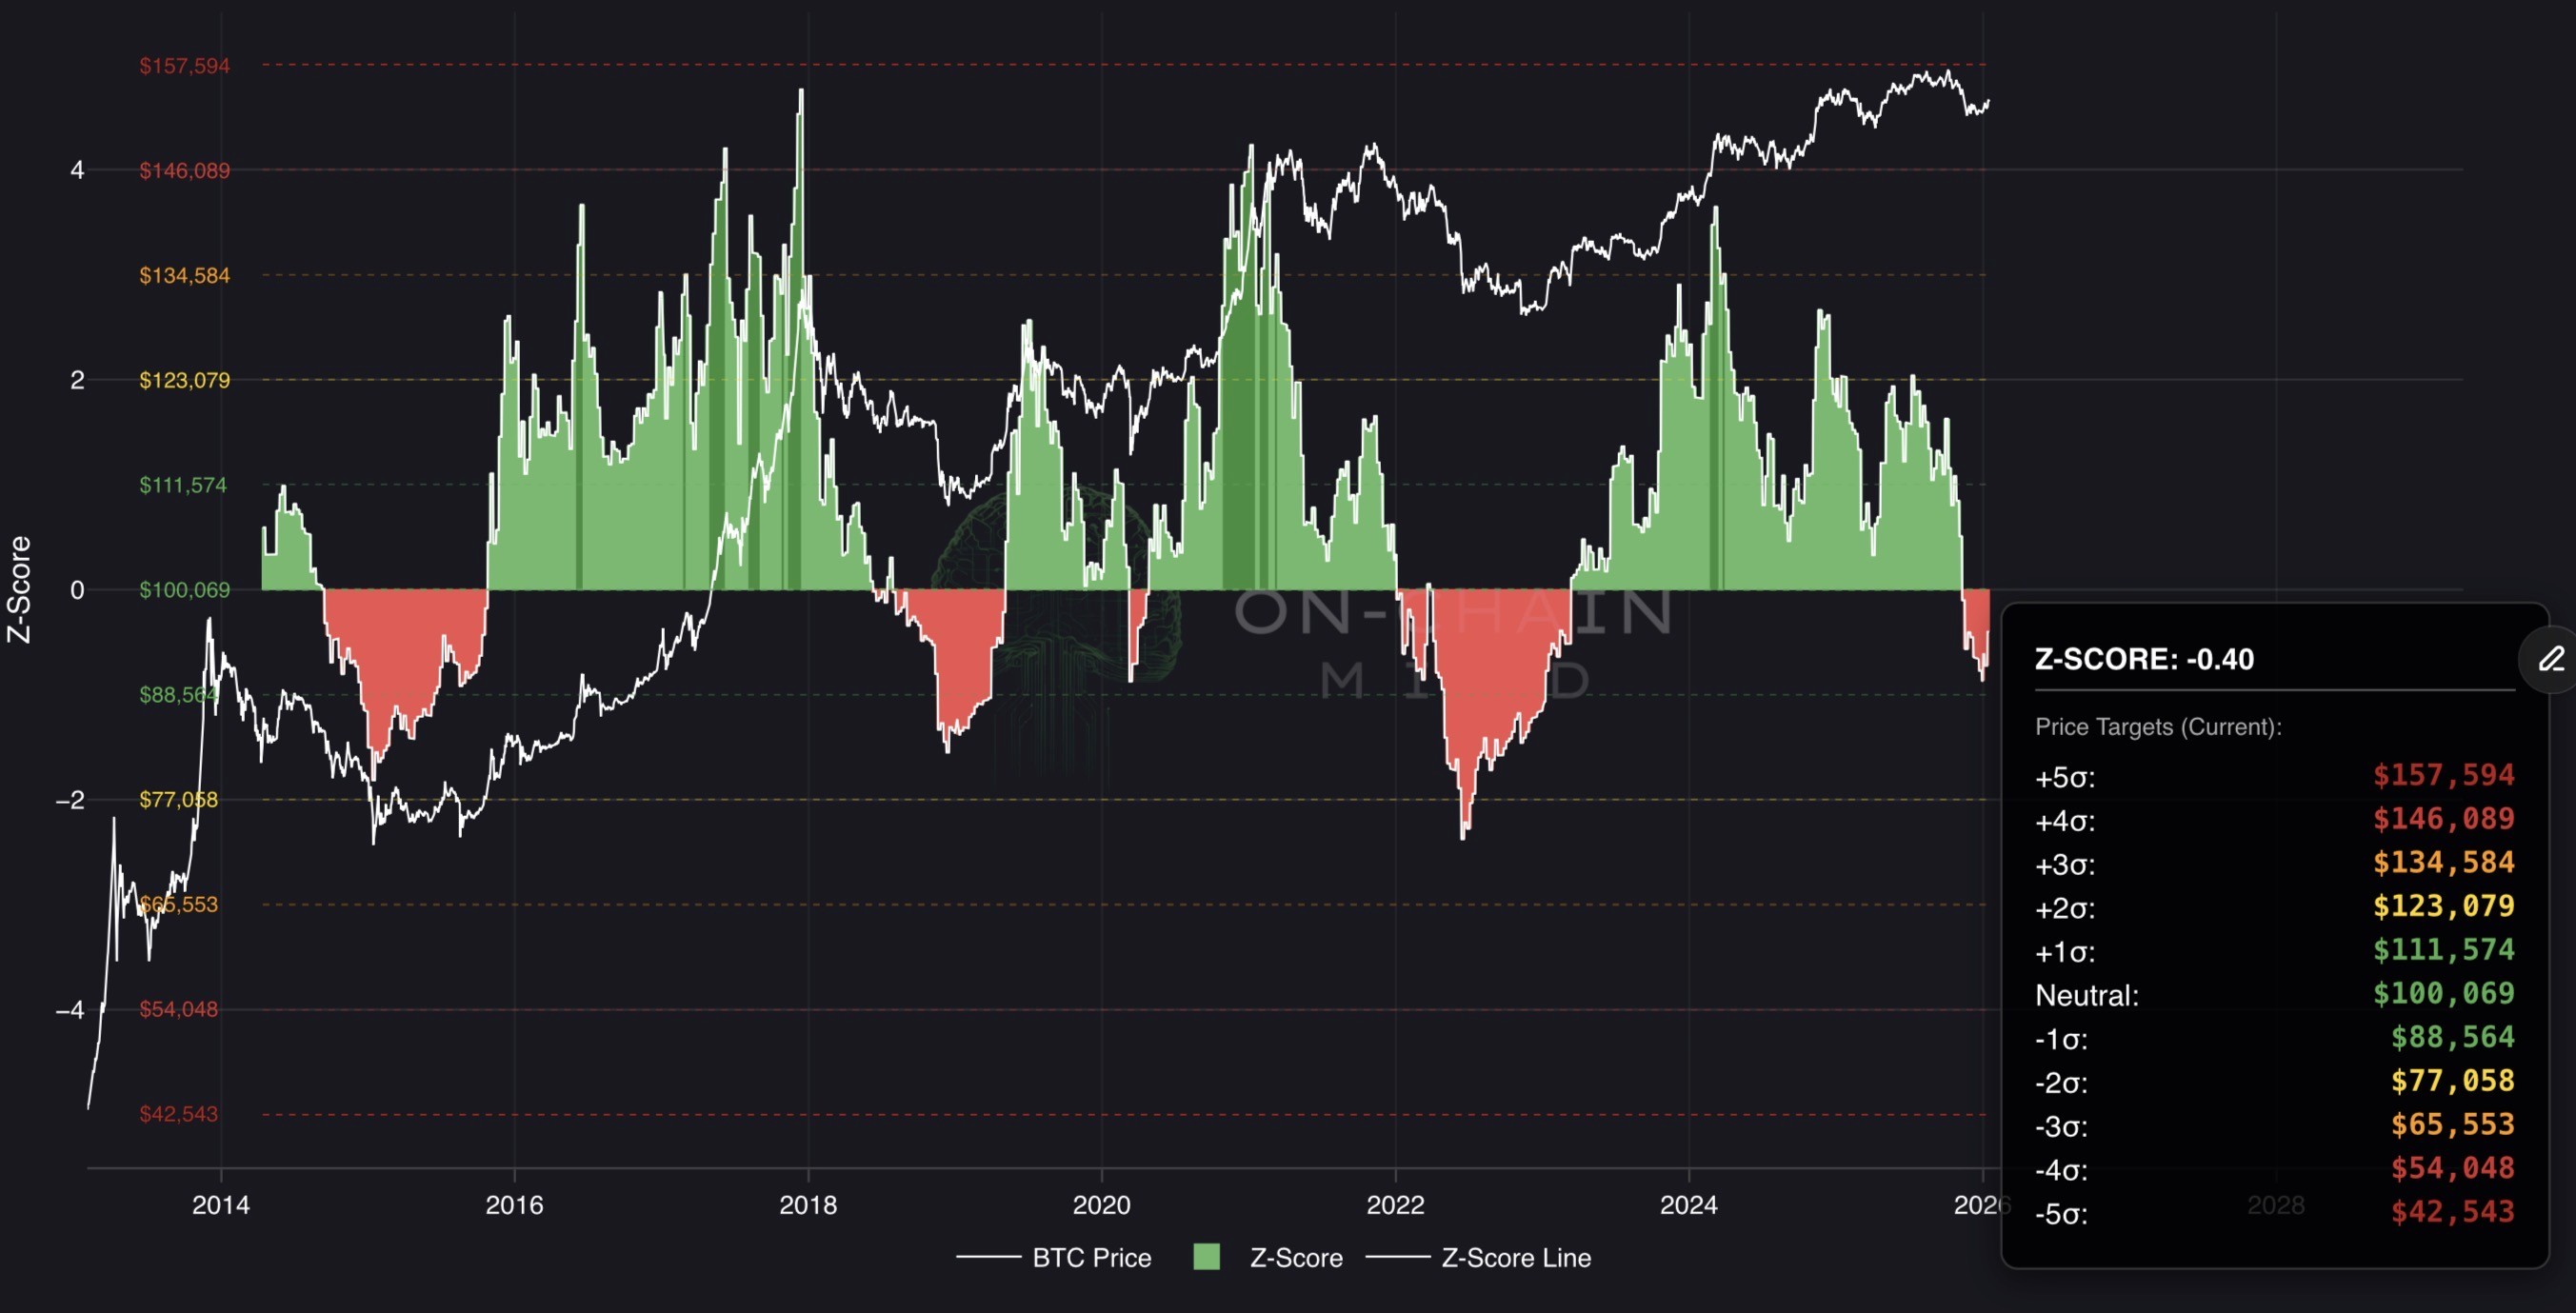
Bitcoin Z-Score Probability Waves
I’ll catch you in the next one.
Cheers,
