
ON-CHAIN METRIC
HODL Waves
How is Bitcoin’s current UTXO supply distributed by age, and what changes when old outputs are spent?
Open the Supply Distribution dashboard
Bitcoin HODL Waves group the current UTXO supply by the time since each output was created, then display every age band as a share of circulating supply.
The chart shows the age distribution of outputs, not verified owners or holding intentions. When an output is spent, it disappears and new outputs begin at age zero, including any change returned to the sender.
How HODL Waves are calculated
Every current unspent output is assigned to an age band such as under 1 day, 1 week to 1 month or more than 10 years. The BTC value in each band is divided by total supply, and the shares are stacked.
Providers can use slightly different bands or entity adjustments, so check the ranges before comparing charts.
Why bands age and reset
Unspent outputs move into older bands as time passes. When they are spent, their value returns to the youngest band as newly created outputs.
That reset does not prove a sale or a new owner. Self-transfers, exchange operations and change outputs can all make old supply appear young again.
What different phases show
Older bands often expand when more supply remains unspent long enough to mature. Younger bands expand when more previously older outputs are spent.
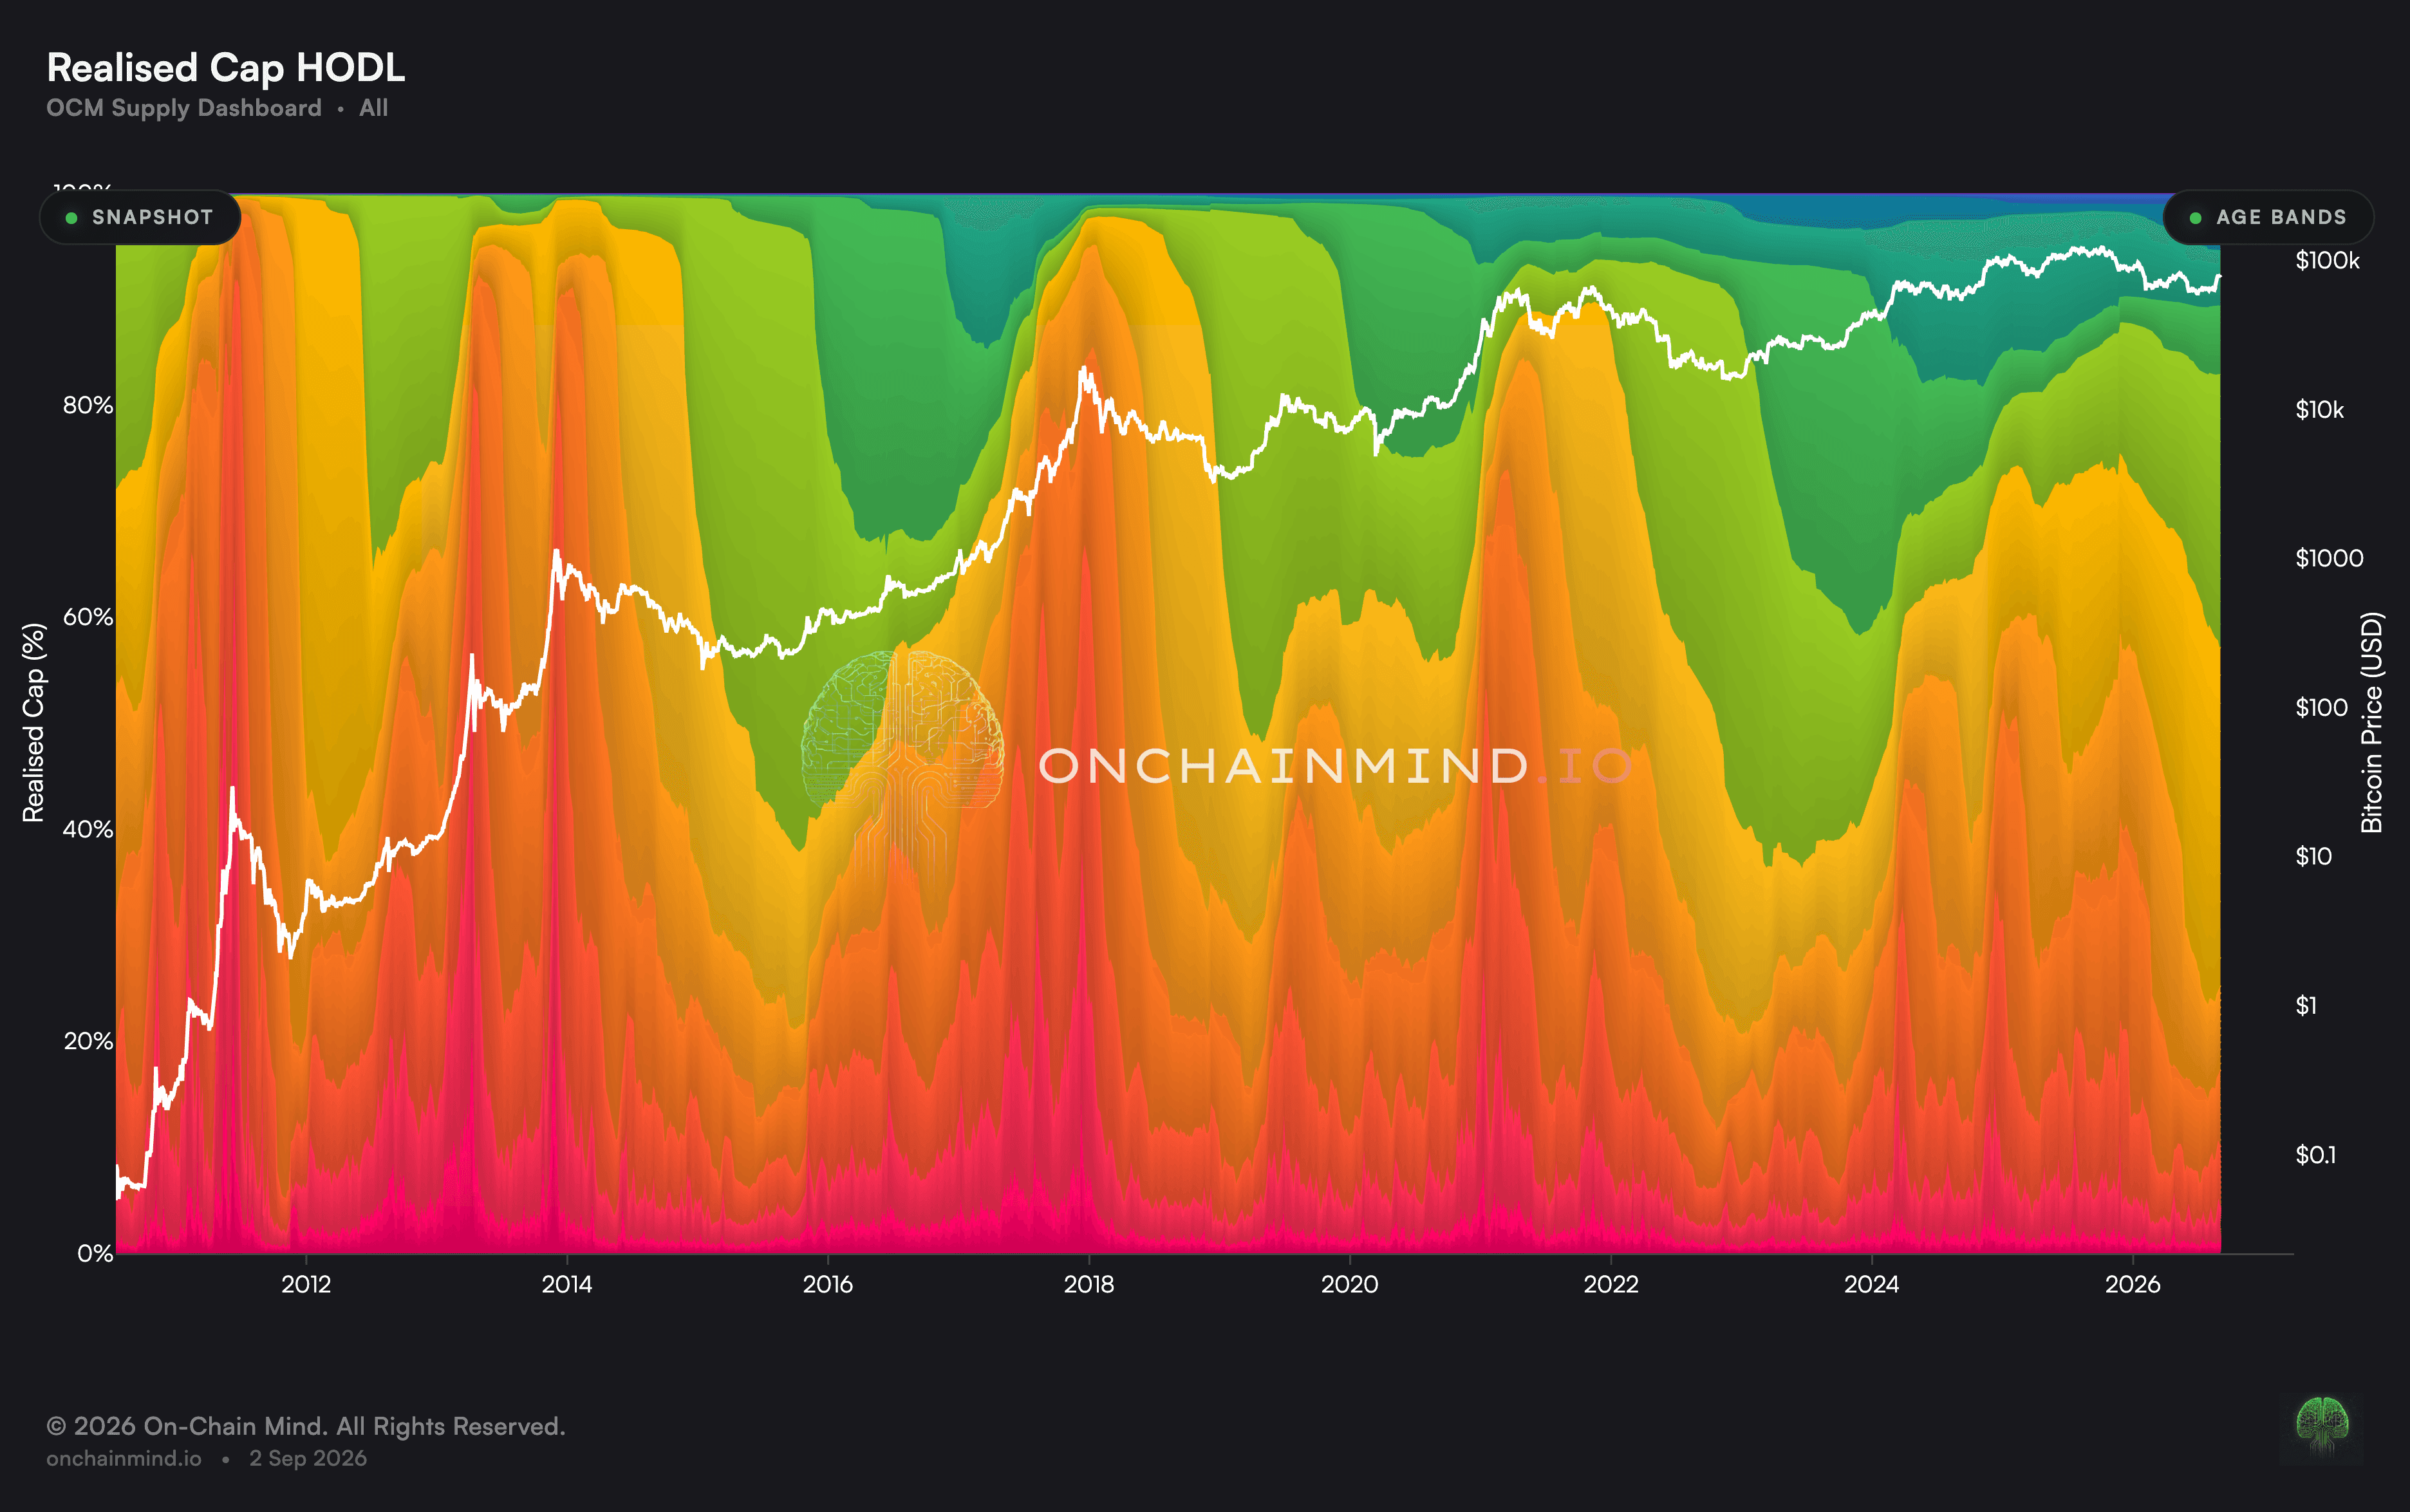
Those changes are consistent with accumulation and distribution regimes, but the chart measures age and spending, not motive. Realised Cap HODL Waves add economic weighting by last-moved value.
How to read it
Older bands expanding. A larger share of supply is remaining unspent and ageing.
Younger bands expanding. More existing supply has recently been spent and reset.
Broadly stable. The age distribution is changing slowly.
Single-band jump. Check large transactions, custody changes and band boundaries before inferring a regime shift.
HODL Waves update inside the Supply Distribution dashboard, alongside the age pyramid and Realised Cap HODL Waves.
Related metrics: Realised Cap HODL Waves, Supply by Vintage Year and LTH Supply.
Common questions
Does an old band prove long-term conviction?
No. It proves only that those UTXOs have remained unspent. Lost coins and operational cold storage can look the same.
What happens when an old output moves?
It is spent and replaced by new outputs in the youngest band, including any change output.
Do young bands mean new buyers?
Not necessarily. They mean outputs were recently created; ownership may or may not have changed.
Can HODL Waves identify holders?
No. They classify UTXO age, not legal or beneficial ownership.
How quickly should I read the chart?
Mostly over months and quarters. Short moves can be dominated by large transactions or operational wallet activity.
ON-CHAIN METRIC
HODL Waves
How is Bitcoin’s current UTXO supply distributed by age, and what changes when old outputs are spent?
Open the Supply Distribution dashboard
Bitcoin HODL Waves group the current UTXO supply by the time since each output was created, then display every age band as a share of circulating supply.
The chart shows the age distribution of outputs, not verified owners or holding intentions. When an output is spent, it disappears and new outputs begin at age zero, including any change returned to the sender.
How HODL Waves are calculated
Every current unspent output is assigned to an age band such as under 1 day, 1 week to 1 month or more than 10 years. The BTC value in each band is divided by total supply, and the shares are stacked.
Providers can use slightly different bands or entity adjustments, so check the ranges before comparing charts.
Why bands age and reset
Unspent outputs move into older bands as time passes. When they are spent, their value returns to the youngest band as newly created outputs.
That reset does not prove a sale or a new owner. Self-transfers, exchange operations and change outputs can all make old supply appear young again.
What different phases show
Older bands often expand when more supply remains unspent long enough to mature. Younger bands expand when more previously older outputs are spent.
Those changes are consistent with accumulation and distribution regimes, but the chart measures age and spending, not motive. Realised Cap HODL Waves add economic weighting by last-moved value.
How to read it
Older bands expanding. A larger share of supply is remaining unspent and ageing.
Younger bands expanding. More existing supply has recently been spent and reset.
Broadly stable. The age distribution is changing slowly.
Single-band jump. Check large transactions, custody changes and band boundaries before inferring a regime shift.
HODL Waves update inside the Supply Distribution dashboard, alongside the age pyramid and Realised Cap HODL Waves.
Related metrics: Realised Cap HODL Waves, Supply by Vintage Year and LTH Supply.
Common questions
Does an old band prove long-term conviction?
No. It proves only that those UTXOs have remained unspent. Lost coins and operational cold storage can look the same.
What happens when an old output moves?
It is spent and replaced by new outputs in the youngest band, including any change output.
Do young bands mean new buyers?
Not necessarily. They mean outputs were recently created; ownership may or may not have changed.
Can HODL Waves identify holders?
No. They classify UTXO age, not legal or beneficial ownership.
How quickly should I read the chart?
Mostly over months and quarters. Short moves can be dominated by large transactions or operational wallet activity.