
ON-CHAIN METRIC
SOPR by Coin Age
Which ages of Bitcoin supply are spending in profit or loss, and how broad is the move across neighbouring bands?
Open the Profit & Loss dashboard
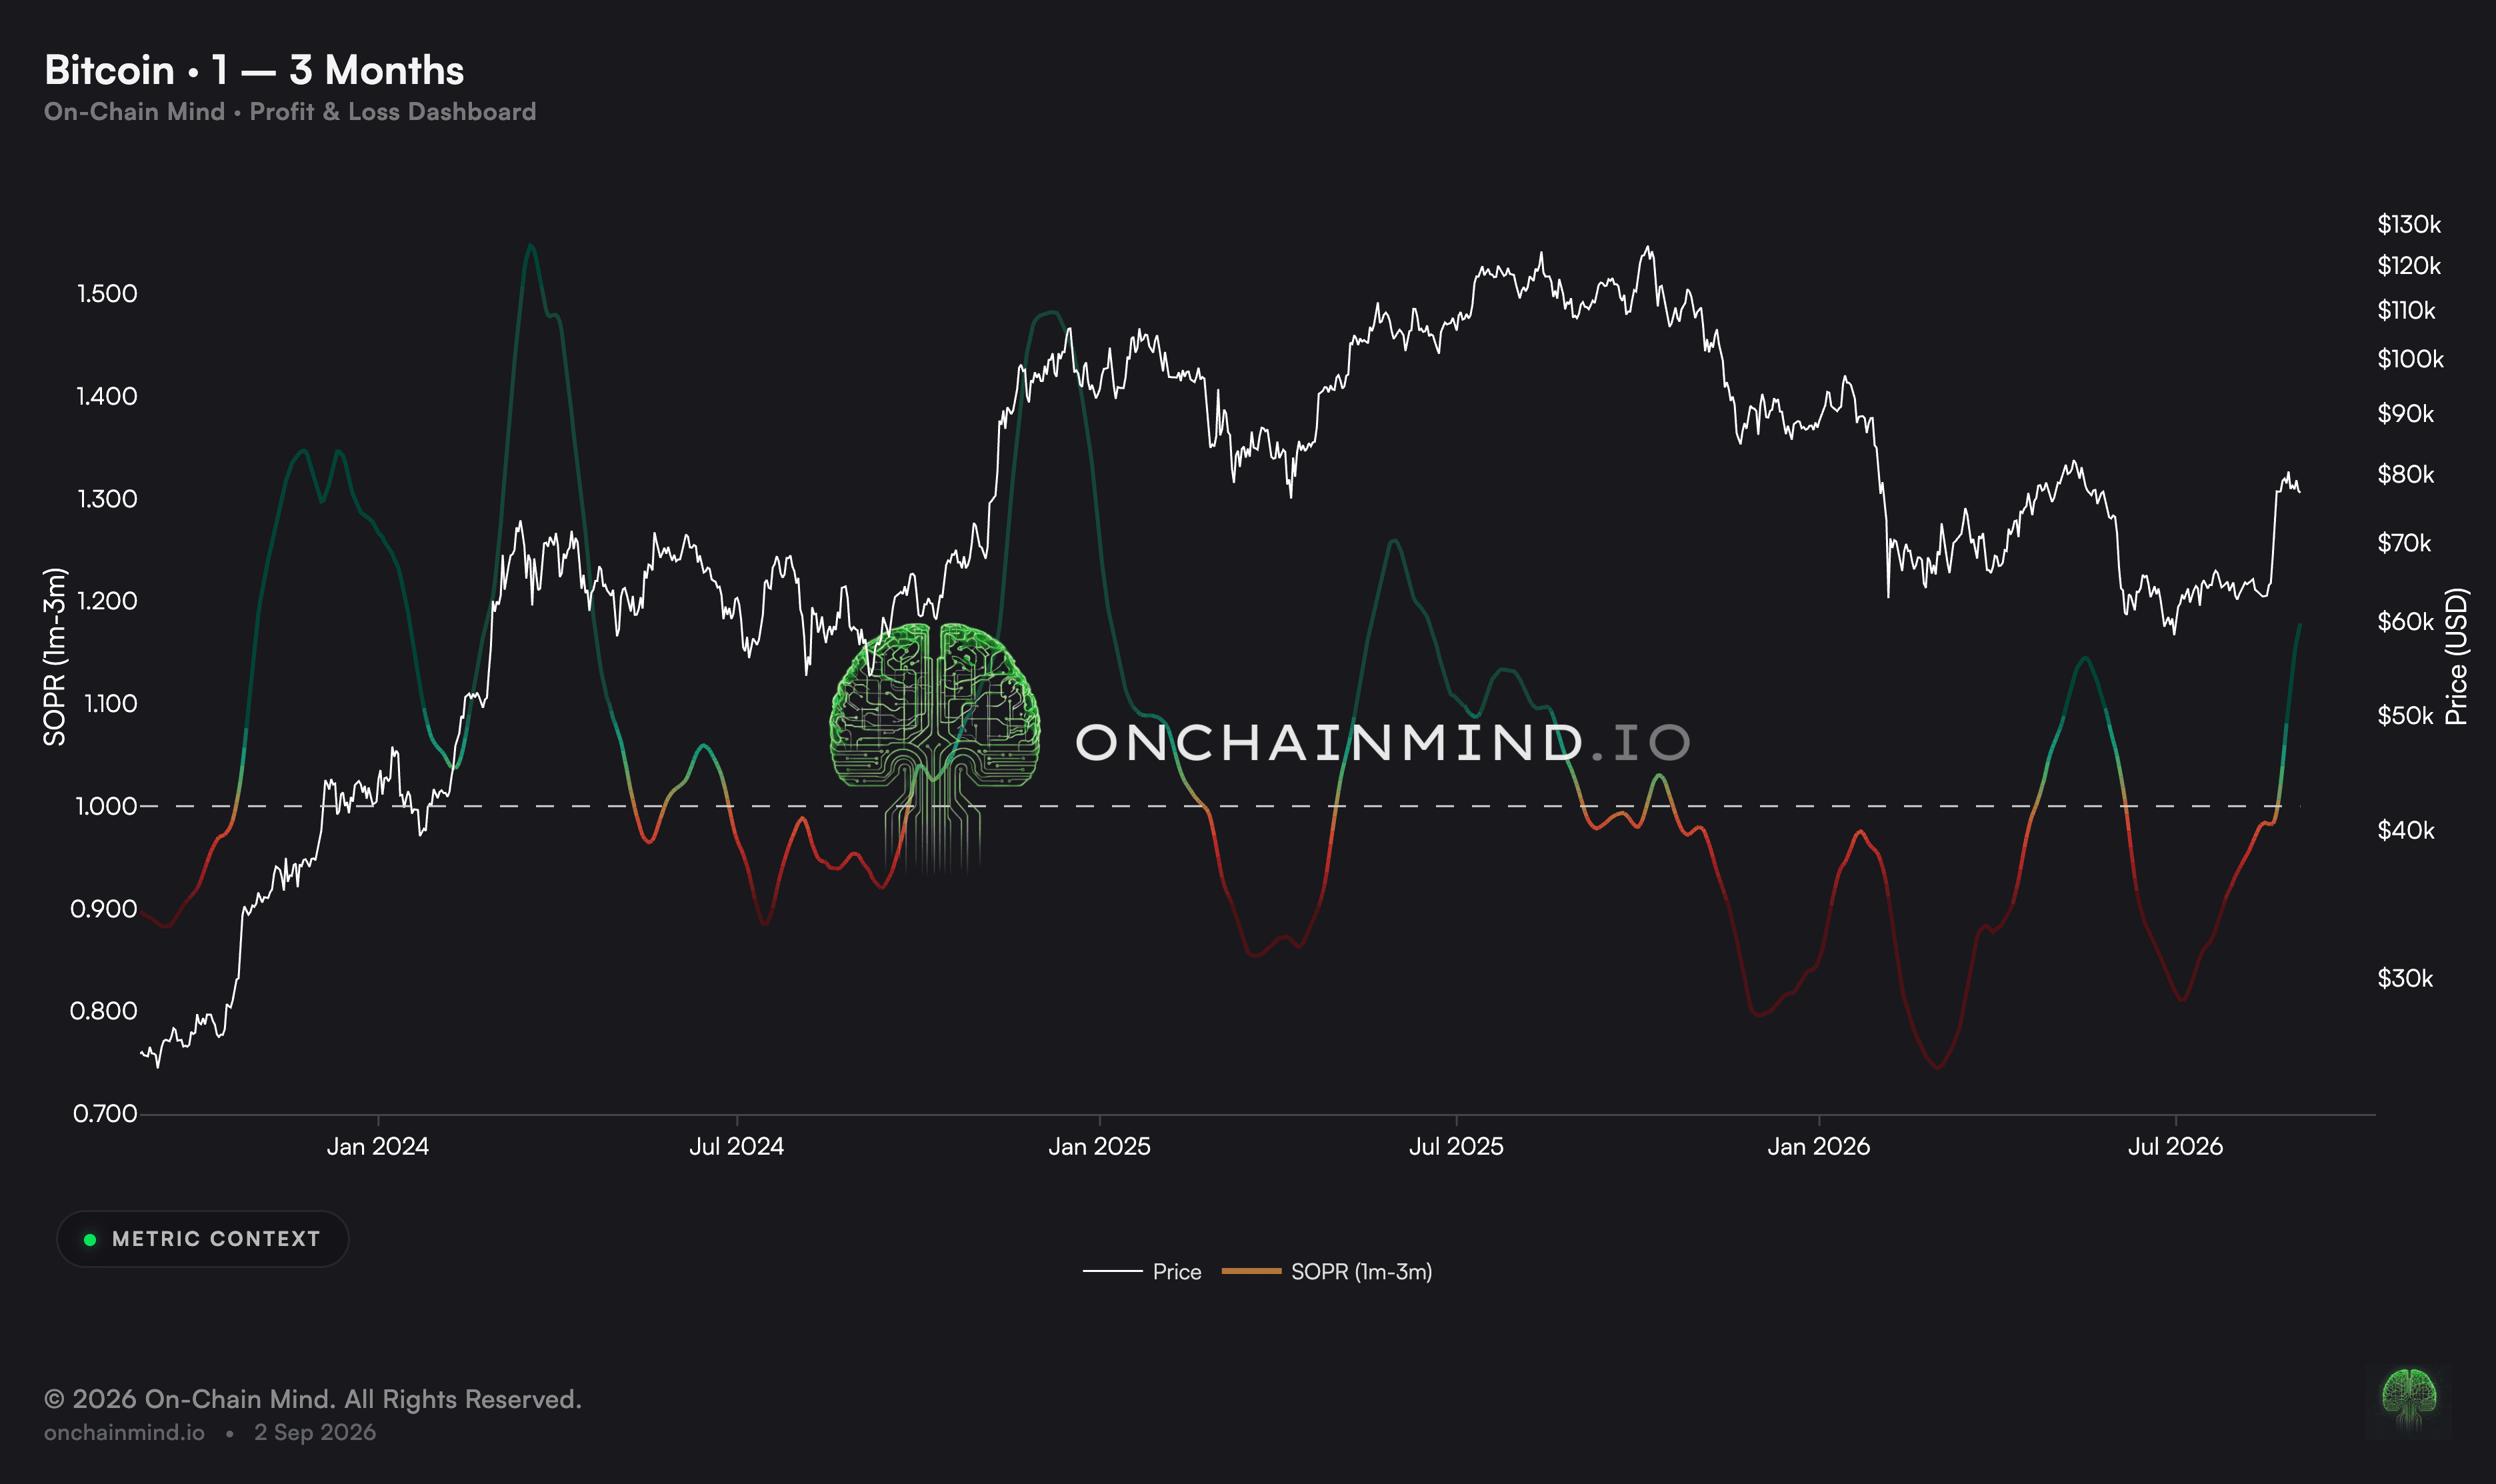
SOPR by Coin Age applies the same spent-output profit-and-loss ratio to separate age bands. It shows which ages of Bitcoin supply are moving above or below their previous on-chain reference value.
The split adds detail the aggregate can hide. It still identifies output age, not a named investor, fund or wallet owner.
How the age split is calculated
Spent outputs are grouped by lifespan, then SOPR is calculated inside each band. The ratio is value-weighted: a large output contributes more than a small one, so coins do not each get one equal vote.
Age-band boundaries depend on the chart provider, so check the exact ranges before comparing one source with another.
What young and old bands mean
Younger bands tend to move around 1 more often because their last-moved prices are usually closer to spot. A move below 1 can therefore be routine.
Older bands move less frequently. A sharp reading can be meaningful, but it can also come from thin volume or one large old output. Pair every ratio with the amount of supply spent in that band.
Where the useful signal sits
Look for breadth across neighbouring bands and persistence over several observations. A single band can reflect an isolated transaction; several bands changing together is stronger evidence that the spending regime is broadening.
Even then, the chart cannot tell you why outputs moved. Price, entity adjustment and cohort spent volume provide the missing context.
How to read it
Above 1 across several bands. Realised profit is broad across the age distribution of spent supply.
Mixed. Some age bands realise gains while others realise losses.
Near 1. Spent outputs in the selected band are close to their last-moved value.
Below 1 across several bands. Realised loss is broadening across spent supply.
Single-band extreme. Check volume and large transactions before treating it as a regime signal.
The full age split updates daily inside the Profit & Loss dashboard.
Related metrics: SOPR, LTH SOPR and STH SOPR.
Common questions
Why split SOPR by output age?
Aggregate SOPR can blend very different spending histories. Age bands show whether realised profit or loss is concentrated in recently moved or long-dormant supply.
Does every coin count once?
No. SOPR is value-weighted, so larger spent outputs have more influence on the ratio.
What does a band below 1 mean?
The outputs spent from that age band moved at an aggregate loss relative to their previous on-chain reference value.
How should neighbouring bands be read?
Broad, persistent moves across several bands usually carry more information than one isolated extreme. Always check spent volume.
How does this relate to LTH and STH SOPR?
LTH and STH SOPR use a two-cohort split around 155 days. The full age view offers more detail but is easier to overread when volume is thin.
ON-CHAIN METRIC
SOPR by Coin Age
Which ages of Bitcoin supply are spending in profit or loss, and how broad is the move across neighbouring bands?
Open the Profit & Loss dashboard
SOPR by Coin Age applies the same spent-output profit-and-loss ratio to separate age bands. It shows which ages of Bitcoin supply are moving above or below their previous on-chain reference value.
The split adds detail the aggregate can hide. It still identifies output age, not a named investor, fund or wallet owner.
How the age split is calculated
Spent outputs are grouped by lifespan, then SOPR is calculated inside each band. The ratio is value-weighted: a large output contributes more than a small one, so coins do not each get one equal vote.
Age-band boundaries depend on the chart provider, so check the exact ranges before comparing one source with another.
What young and old bands mean
Younger bands tend to move around 1 more often because their last-moved prices are usually closer to spot. A move below 1 can therefore be routine.
Older bands move less frequently. A sharp reading can be meaningful, but it can also come from thin volume or one large old output. Pair every ratio with the amount of supply spent in that band.
Where the useful signal sits
Look for breadth across neighbouring bands and persistence over several observations. A single band can reflect an isolated transaction; several bands changing together is stronger evidence that the spending regime is broadening.
Even then, the chart cannot tell you why outputs moved. Price, entity adjustment and cohort spent volume provide the missing context.
How to read it
Above 1 across several bands. Realised profit is broad across the age distribution of spent supply.
Mixed. Some age bands realise gains while others realise losses.
Near 1. Spent outputs in the selected band are close to their last-moved value.
Below 1 across several bands. Realised loss is broadening across spent supply.
Single-band extreme. Check volume and large transactions before treating it as a regime signal.
The full age split updates daily inside the Profit & Loss dashboard.
Related metrics: SOPR, LTH SOPR and STH SOPR.
Common questions
Why split SOPR by output age?
Aggregate SOPR can blend very different spending histories. Age bands show whether realised profit or loss is concentrated in recently moved or long-dormant supply.
Does every coin count once?
No. SOPR is value-weighted, so larger spent outputs have more influence on the ratio.
What does a band below 1 mean?
The outputs spent from that age band moved at an aggregate loss relative to their previous on-chain reference value.
How should neighbouring bands be read?
Broad, persistent moves across several bands usually carry more information than one isolated extreme. Always check spent volume.
How does this relate to LTH and STH SOPR?
LTH and STH SOPR use a two-cohort split around 155 days. The full age view offers more detail but is easier to overread when volume is thin.