
ON-CHAIN METRIC
Supply in Loss
How much Bitcoin currently sits below the market price recorded when its UTXOs were created?
Open the Profit & Loss dashboard
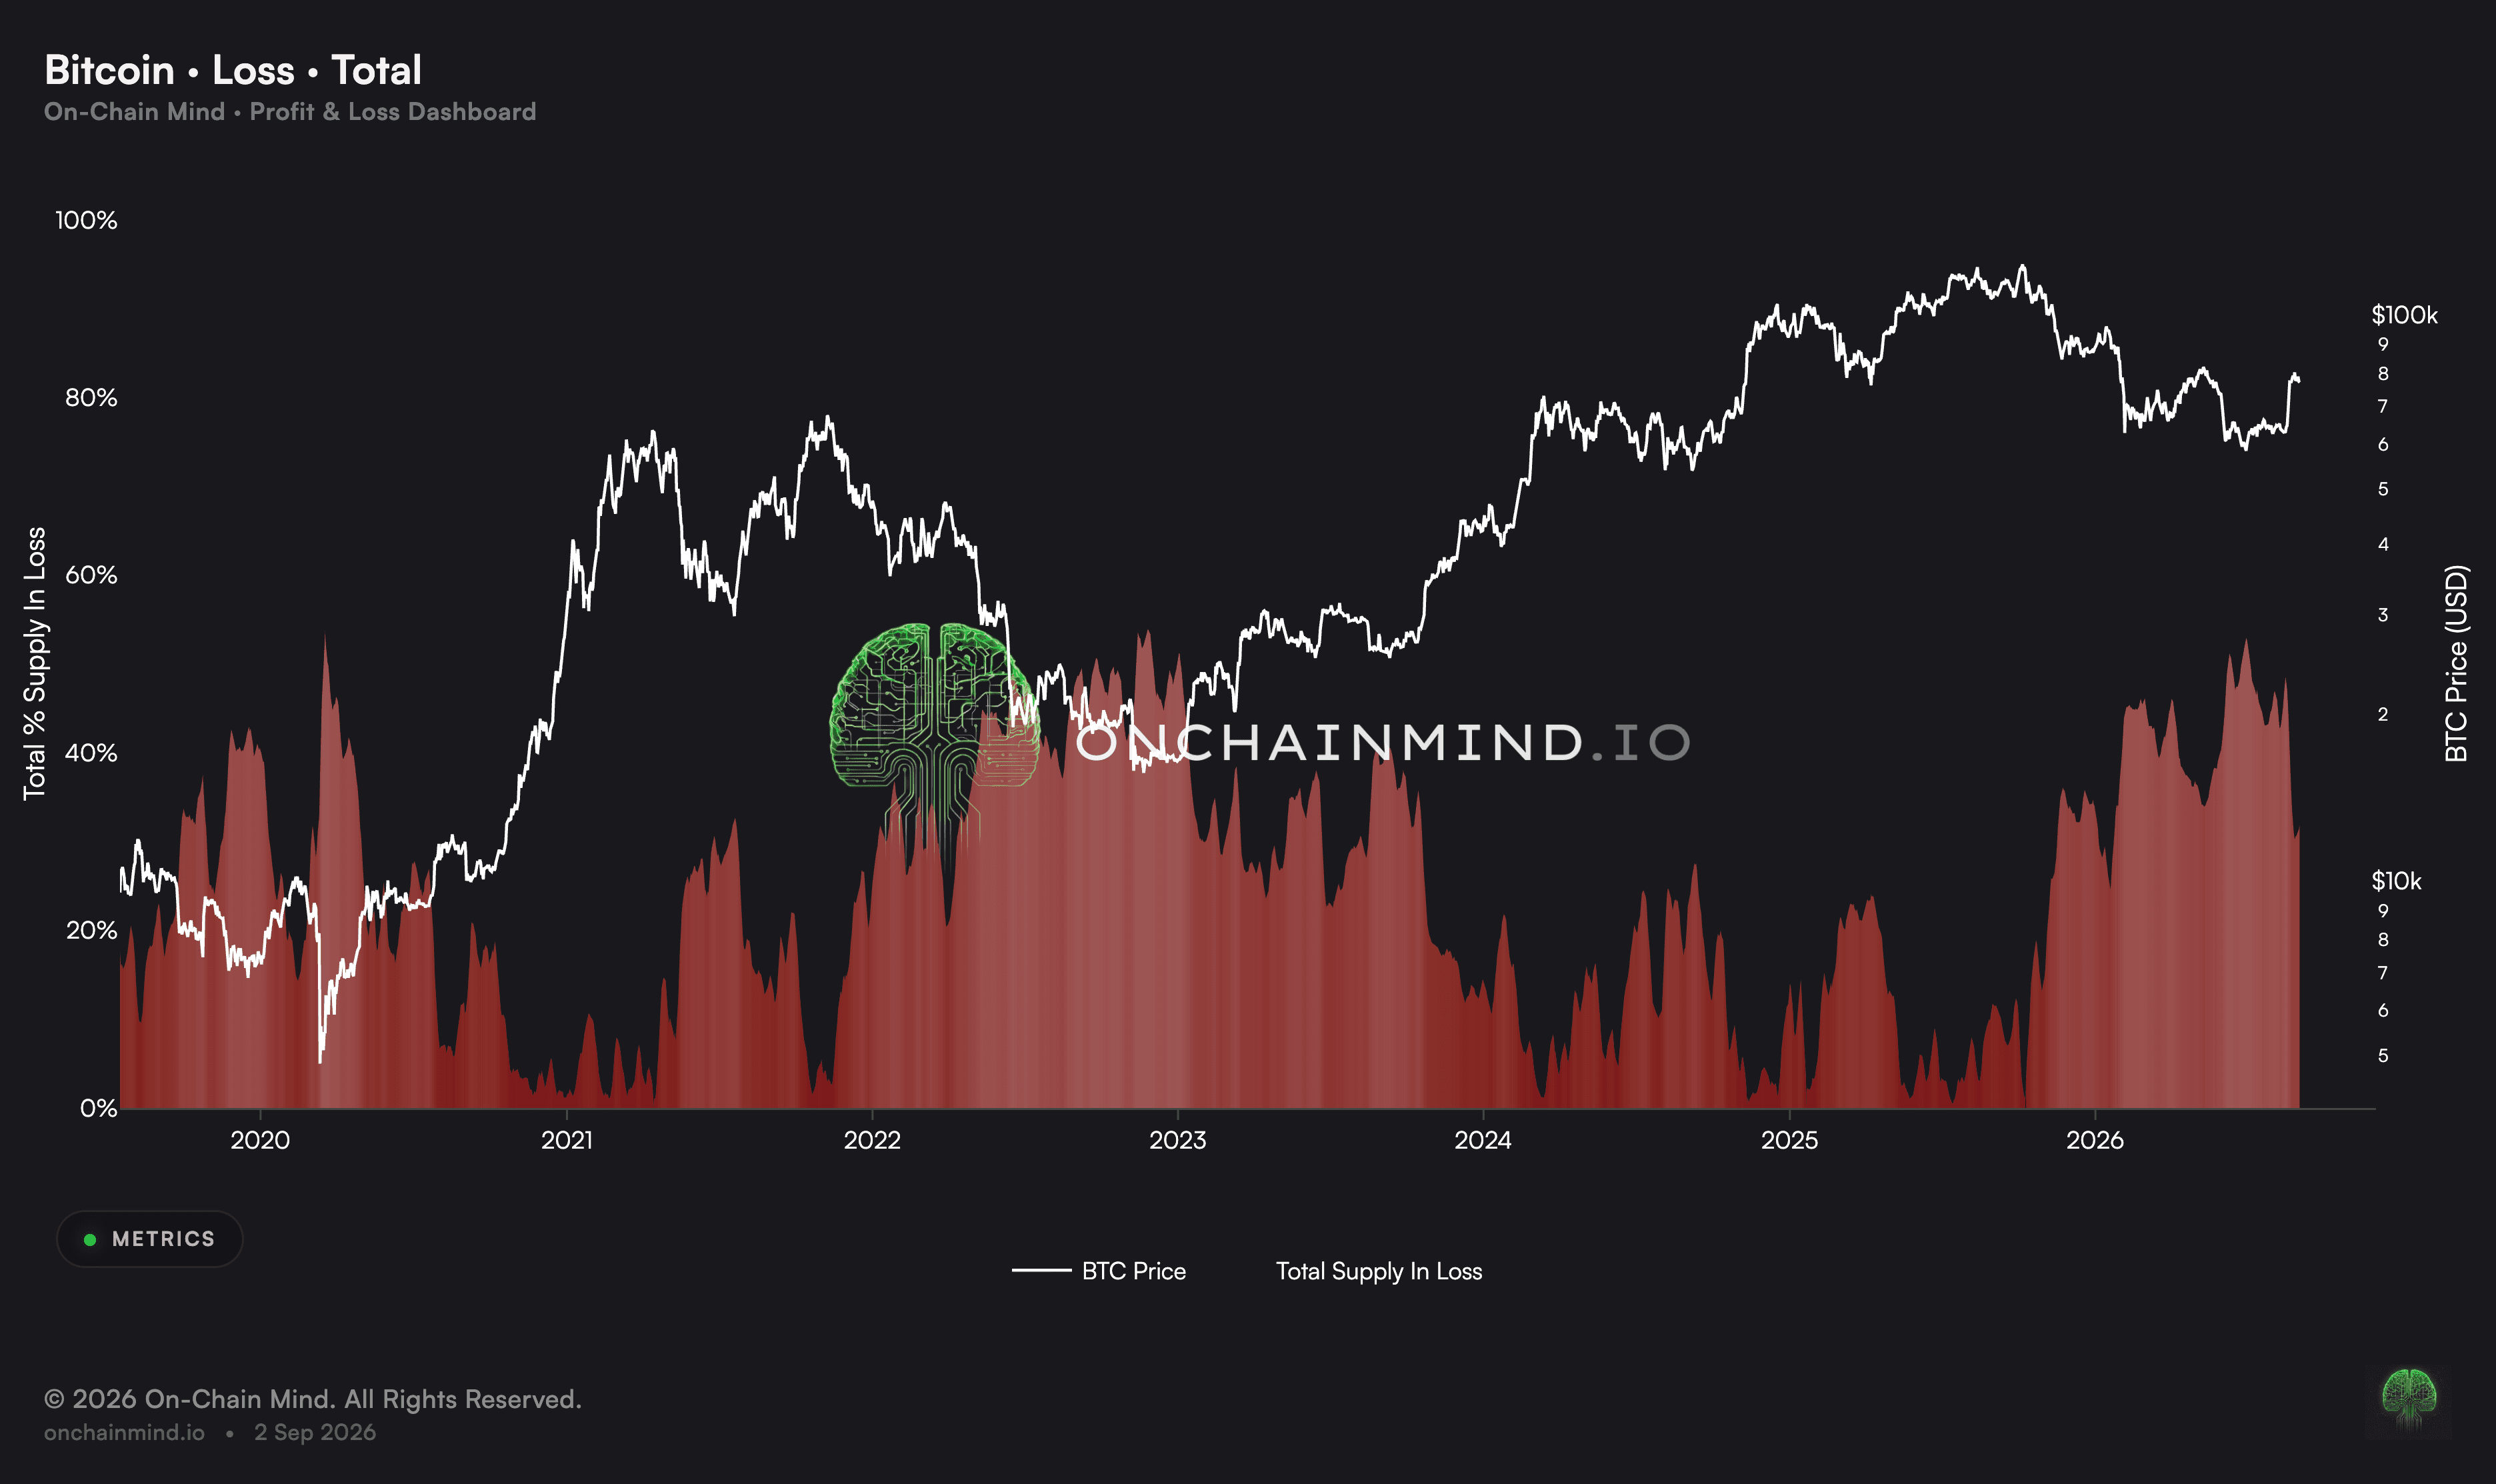
Supply in Loss estimates the absolute amount of Bitcoin whose current market price is below the price at which each coin’s UTXO was created. The standard chart is measured in BTC, not as a percentage.
It describes an unrealised condition across the current supply. A coin can sit in Supply in Loss for months or years without moving, and no loss is recorded by the realised metrics until that output is spent.
How Supply in Loss is calculated
Formula. Sum of the BTC value of all current UTXOs whose creation price is higher than the current market price.
Each qualifying coin contributes its BTC amount, regardless of whether it is 1% or 80% below its reference price. If the chart is expressed as Percent Supply in Loss, the absolute balance is divided by circulating supply and multiplied by 100.
Why the balance changes
Price can move coins into or out of loss without any on-chain transaction. A sharp fall through a dense cost-basis band can produce a sudden increase; a recovery through that band can remove the same supply from loss.
Transactions matter too. Spending removes old UTXOs and creates new ones at the current market price, resetting their reference point. Supply growth and provider treatment of newly issued coins can also affect the absolute total.
What Supply in Loss does not tell you
It is not the number of holders who are underwater and it does not measure how many dollars they have lost. The metric counts BTC on the loss side of a proxy, not people, addresses or the depth of each loss.
The last-moved price is not always a purchase price. Self-transfers, change outputs, exchange activity, custody reorganisations and lost coins can all shape the series. Entity-adjusted data can reduce some noise but cannot identify every beneficial owner.
How to read it
Historically high. A large BTC balance sits below its last-moved-price proxy, showing broad unrealised stress.
Rising quickly. Price is falling through cost-basis clusters, outputs are being repriced above spot or both.
High but falling. Price is reclaiming reference-price bands or underwater outputs are being spent and reset.
Low. Most measured supply sits at or above its on-chain reference price.
Sudden jump. Price may have crossed a dense supply cluster; the move does not require holders to have transacted.
Supply in Loss updates daily inside the Profit & Loss dashboard, alongside Percent Supply in Profit, NUPL and Realised Loss.
Related metrics: Percent Supply in Profit, Realised Loss and NUPL.
Common questions
Is Supply in Loss the same as Percent Supply in Loss?
No. Supply in Loss is normally an absolute BTC balance. Percent Supply in Loss divides that balance by circulating supply.
How is it different from Realised Loss?
Supply in Loss counts underwater BTC whether it moves or not. Realised Loss measures the dollar loss only when qualifying outputs are spent.
Does a high reading mean holders will sell?
No. It shows the extent of the underwater supply under the model, not its owners’ intentions or liquidity needs.
Can Supply in Loss fall while price is flat?
Yes. Underwater outputs can be spent and recreated near the current price, and changes in the measured supply or entity adjustments can alter the balance.
What should I pair it with?
Use Percent Supply in Profit for breadth, NUPL for the net size of unrealised value, Realised Loss for actual spending outcomes and price-distribution data for the cost-basis bands involved.
ON-CHAIN METRIC
Supply in Loss
How much Bitcoin currently sits below the market price recorded when its UTXOs were created?
Open the Profit & Loss dashboard
Supply in Loss estimates the absolute amount of Bitcoin whose current market price is below the price at which each coin’s UTXO was created. The standard chart is measured in BTC, not as a percentage.
It describes an unrealised condition across the current supply. A coin can sit in Supply in Loss for months or years without moving, and no loss is recorded by the realised metrics until that output is spent.
How Supply in Loss is calculated
Formula. Sum of the BTC value of all current UTXOs whose creation price is higher than the current market price.
Each qualifying coin contributes its BTC amount, regardless of whether it is 1% or 80% below its reference price. If the chart is expressed as Percent Supply in Loss, the absolute balance is divided by circulating supply and multiplied by 100.
Why the balance changes
Price can move coins into or out of loss without any on-chain transaction. A sharp fall through a dense cost-basis band can produce a sudden increase; a recovery through that band can remove the same supply from loss.
Transactions matter too. Spending removes old UTXOs and creates new ones at the current market price, resetting their reference point. Supply growth and provider treatment of newly issued coins can also affect the absolute total.
What Supply in Loss does not tell you
It is not the number of holders who are underwater and it does not measure how many dollars they have lost. The metric counts BTC on the loss side of a proxy, not people, addresses or the depth of each loss.
The last-moved price is not always a purchase price. Self-transfers, change outputs, exchange activity, custody reorganisations and lost coins can all shape the series. Entity-adjusted data can reduce some noise but cannot identify every beneficial owner.
How to read it
Historically high. A large BTC balance sits below its last-moved-price proxy, showing broad unrealised stress.
Rising quickly. Price is falling through cost-basis clusters, outputs are being repriced above spot or both.
High but falling. Price is reclaiming reference-price bands or underwater outputs are being spent and reset.
Low. Most measured supply sits at or above its on-chain reference price.
Sudden jump. Price may have crossed a dense supply cluster; the move does not require holders to have transacted.
Supply in Loss updates daily inside the Profit & Loss dashboard, alongside Percent Supply in Profit, NUPL and Realised Loss.
Related metrics: Percent Supply in Profit, Realised Loss and NUPL.
Common questions
Is Supply in Loss the same as Percent Supply in Loss?
No. Supply in Loss is normally an absolute BTC balance. Percent Supply in Loss divides that balance by circulating supply.
How is it different from Realised Loss?
Supply in Loss counts underwater BTC whether it moves or not. Realised Loss measures the dollar loss only when qualifying outputs are spent.
Does a high reading mean holders will sell?
No. It shows the extent of the underwater supply under the model, not its owners’ intentions or liquidity needs.
Can Supply in Loss fall while price is flat?
Yes. Underwater outputs can be spent and recreated near the current price, and changes in the measured supply or entity adjustments can alter the balance.
What should I pair it with?
Use Percent Supply in Profit for breadth, NUPL for the net size of unrealised value, Realised Loss for actual spending outcomes and price-distribution data for the cost-basis bands involved.