

At the June low, only 4% of days had seen a lower share of Bitcoin holders sitting in a loss.
That was textbook capitulation, and nobody wants to call it until price has already left.
Well, price has left. We've just produced a +45% surge, roughly a year into this drawdown, at the exact point in the cycle where bounces are supposed to be weakest.
Bear market bounces decay as exhaustion sets in; they don't accelerate into their final months.
So let me walk you through the bull case from four angles: holder profitability, momentum, capital flows and risk, and tell you honestly where I think the weight of the evidence lands.
Let's get into it.
Key insights
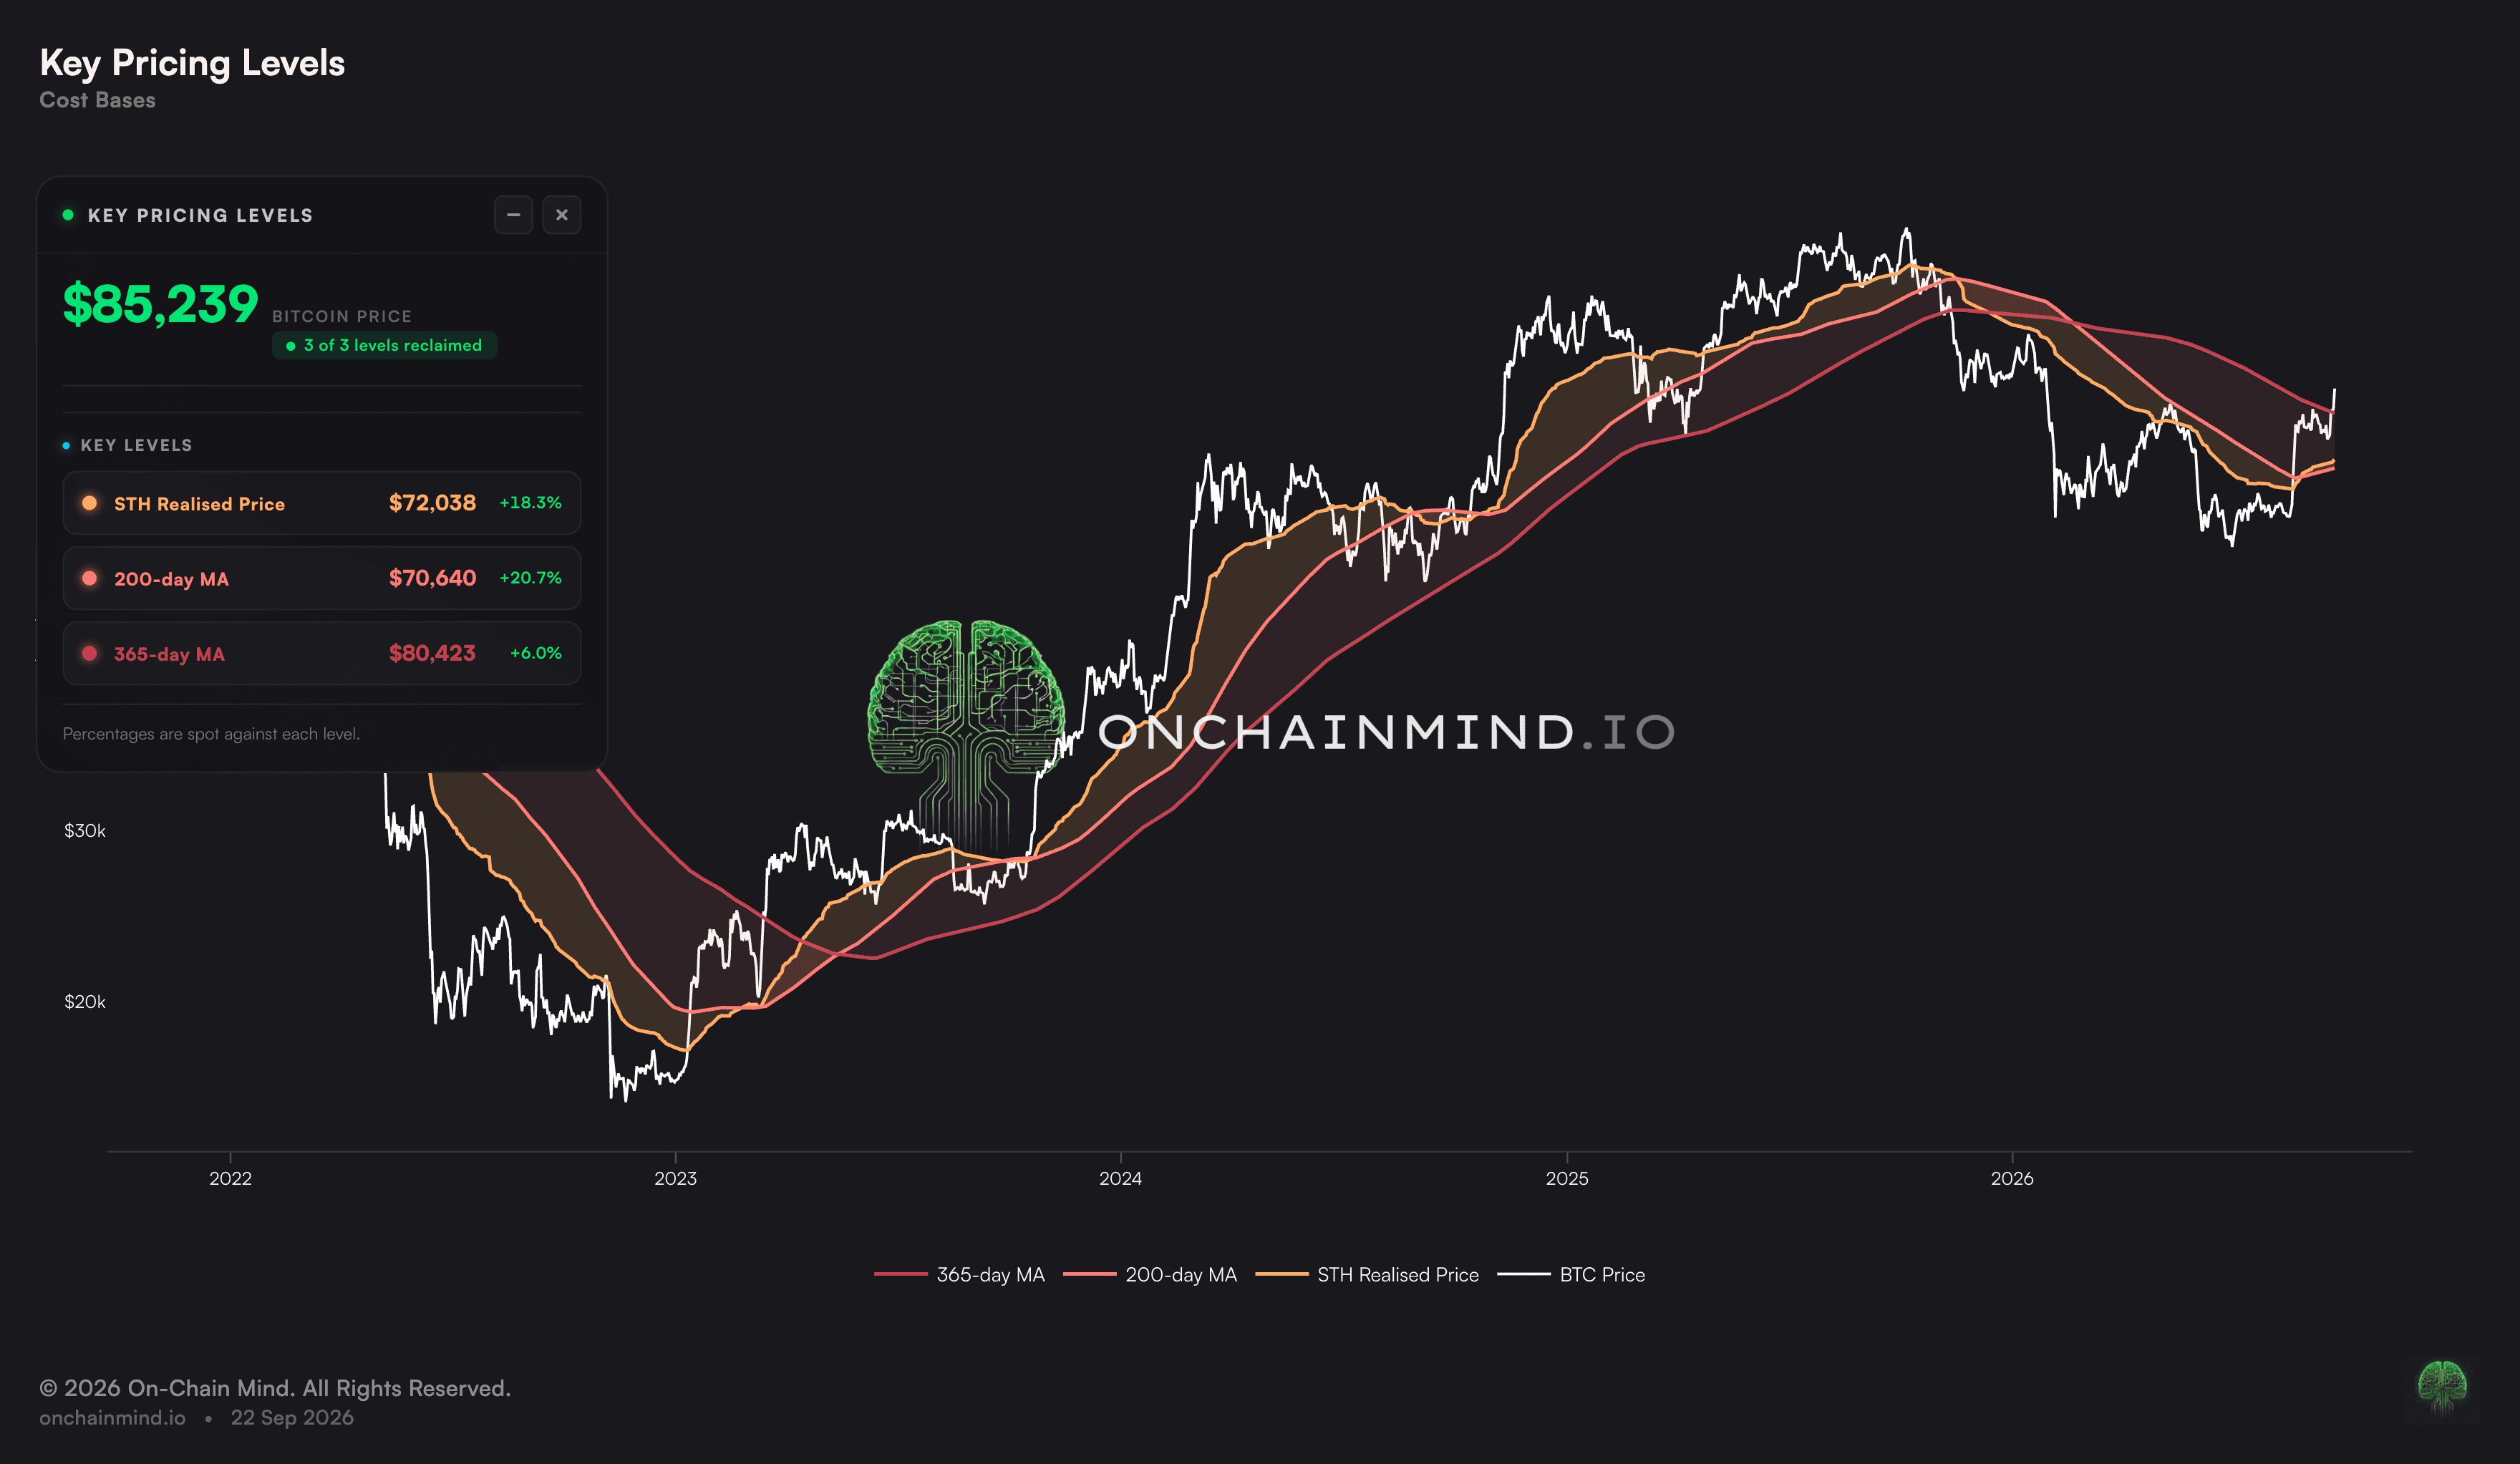
Regime Reclaimed: Bitcoin has closed back above all three of my key pricing levels for the first time this cycle.
The Rally Is Too Violent: A 45% surge late in a bear market contradicts every previous counter-trend bounce on record.
The Bottom Was Textbook: Half of all supply underwater, a 96th percentile reading, and a single-digit Ω-Score.
Institutions Own This Move: ETFs and Strategy account for roughly a third of the network's capital inflow from the rally off the bottom.
Three Lines, One Direction
For years I've anchored my regime read to three levels:
200-day MA
STH cost basis
365-day MA
I try to keep the logic for this deliberately simple. Below all three, the bear market is confirmed and the burden of proof sits with buyers. Above all three, history says you're in the bull regime, and that regime usually runs for years rather than weeks.
We rocketed through the 200-day moving average and the short-term holder cost basis, both sat in the low $70,000s. The yearly moving average at ~$80,000 was the line that actually mattered to me, because without it this was just another fake-out on the way to lower prices.
We broke it. And my base case has flipped with it.
View live in OCM Studio: Key Pricing Levels
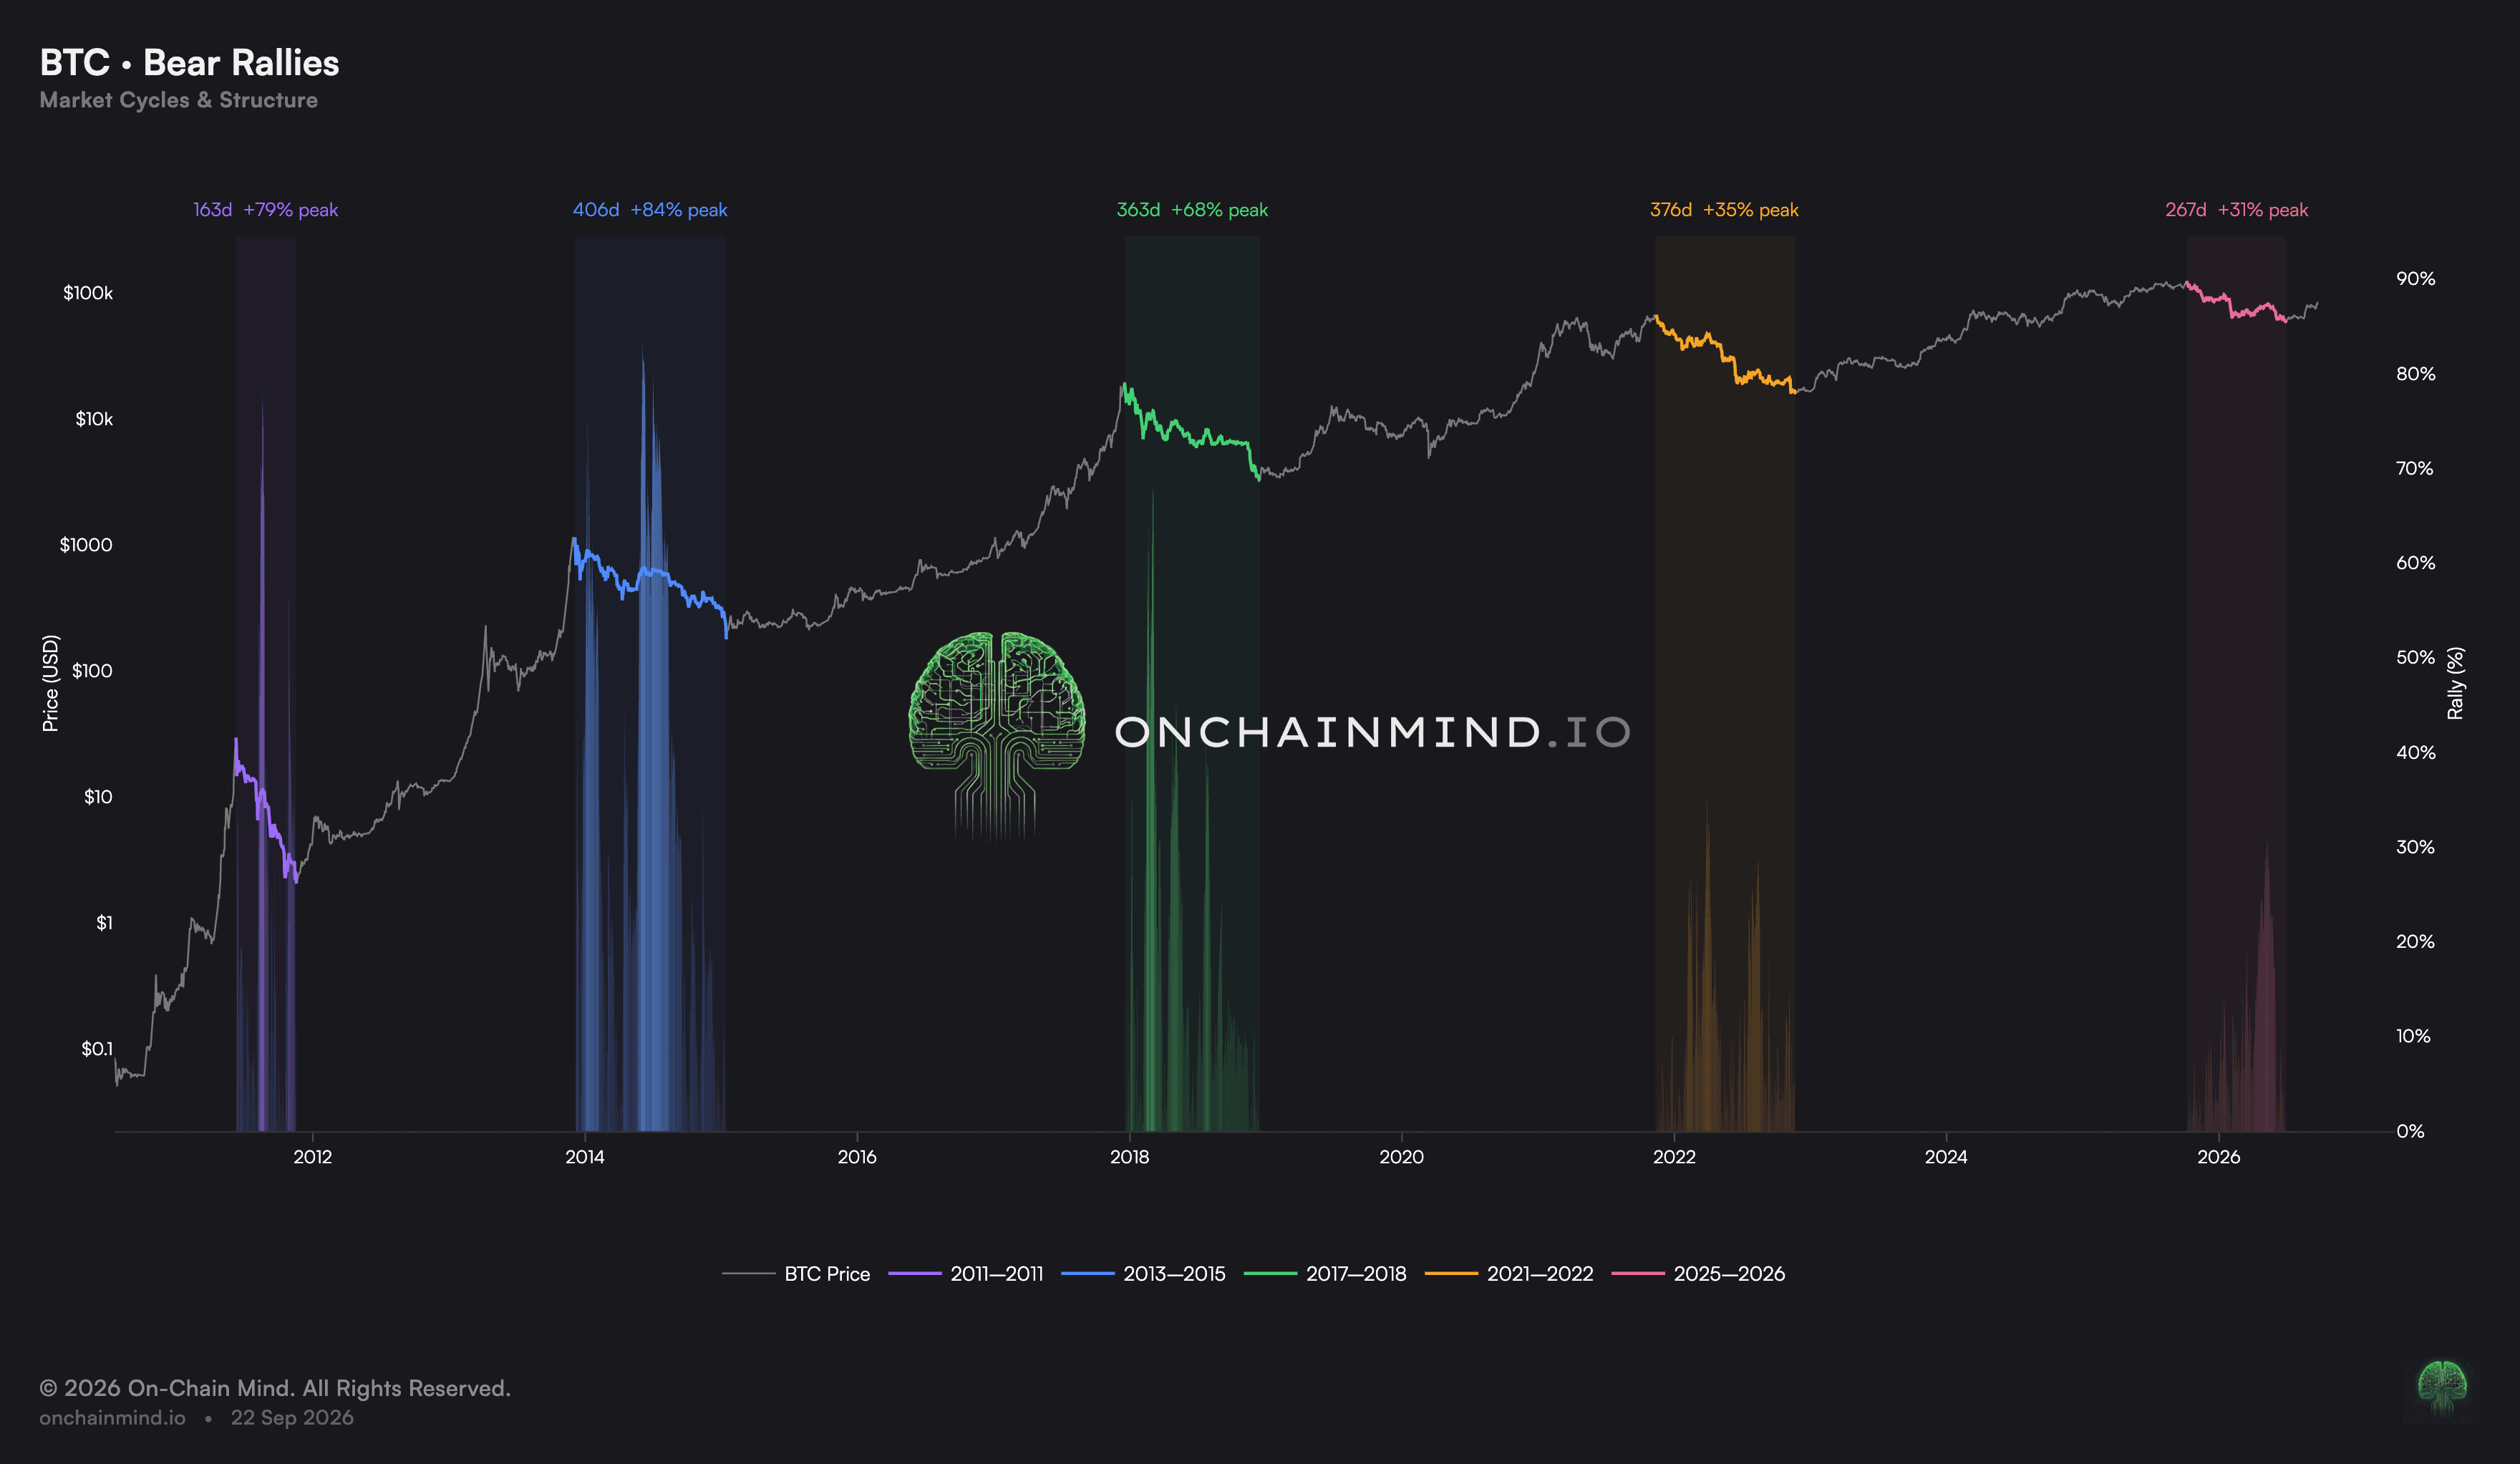
Now we can also look at the shape of the move as well as the level. When you map every bear market's counter-trend rallies, a clear pattern emerges. The biggest bounces cluster early in the drawdown, while belief is still alive, and they get progressively weaker as exhaustion sets in.
By the end of a bear, the market barely has the energy to rally at all.
This latest rally did the exact opposite. The strongest counter-trend rally of the entire 2022 bear was +35%. We have just produced a +45% surge roughly a year into this one, at precisely the point where bounces are supposed to be at their feeblest.
That's not how bear market rallies behave. That's how bull markets begin.
So while this isn't irrefutable evidence that the bear market is over, it does make the probabilistic case for it far harder to ignore.
View live in OCM Studio: Bear Rallies
A Textbook Bottom
If June was the low, the on-chain evidence should look like every other low. And it does.
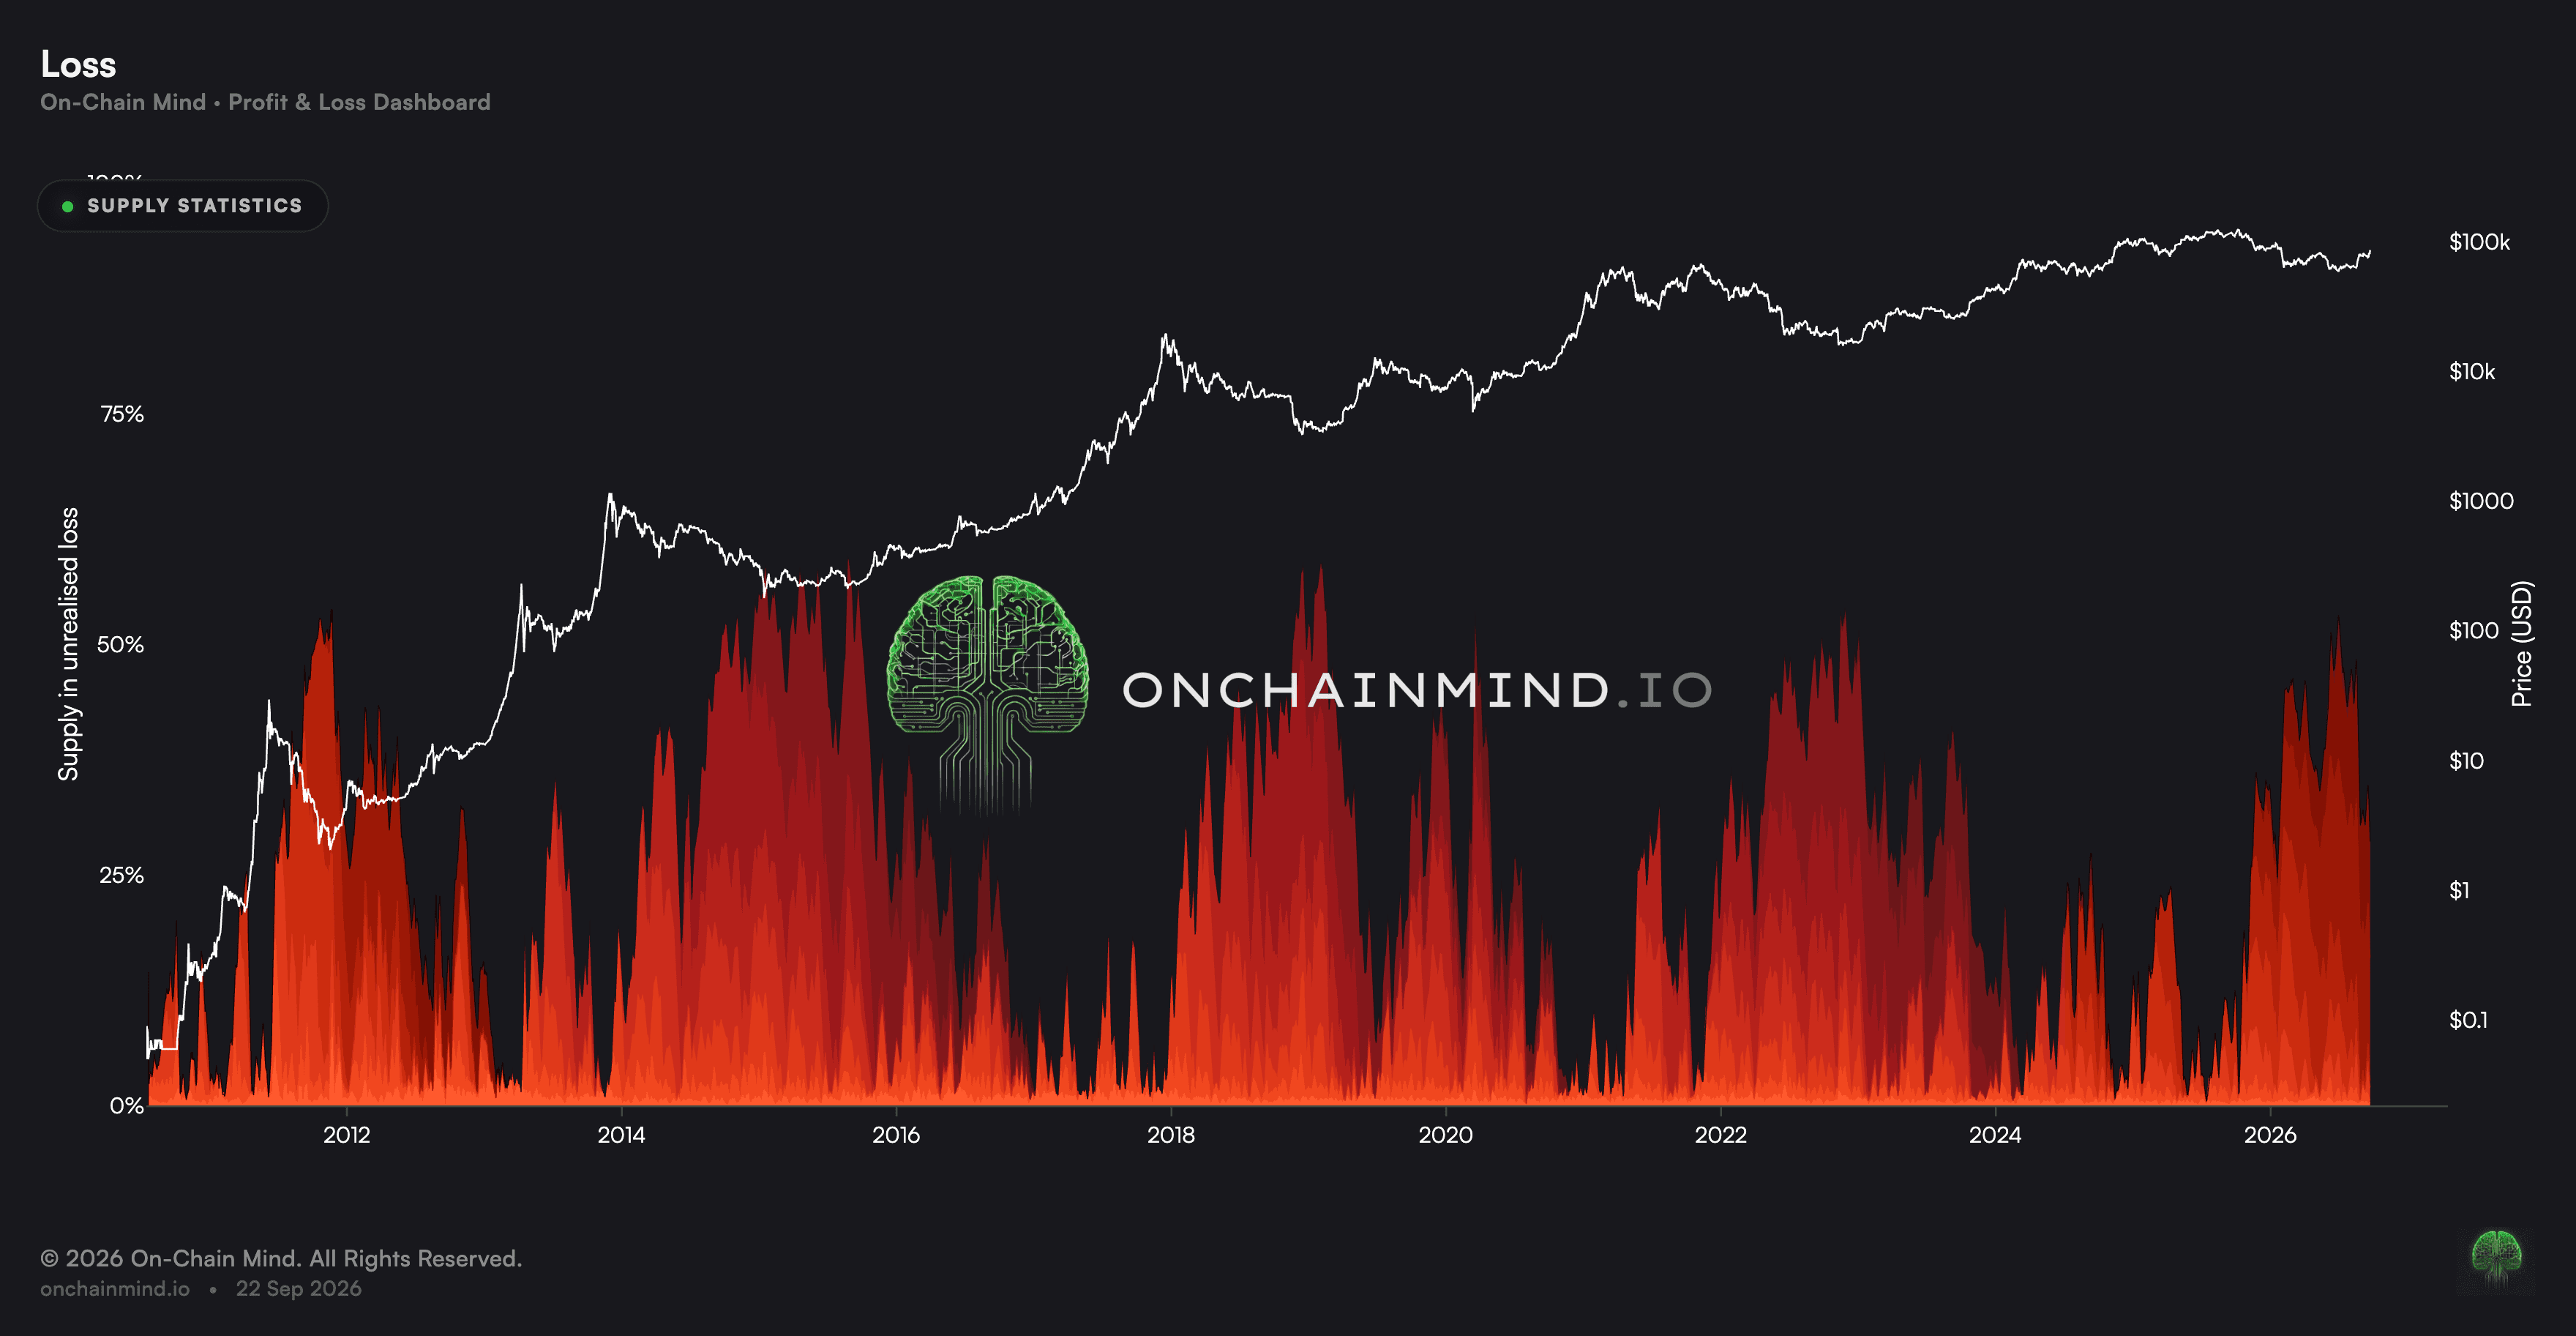
Start with the percentage of supply held at a loss. Take every coin, compare its last on-chain movement price to spot, and you get a clean read on how much of the network is drowning. Across every cycle, from 2011 to now, roughly 50% of supply underwater has marked the bottom with uncomfortable precision.
Why should a fixed threshold hold as the network grows tenfold? Because the composition of that pain never changes.
The dominant cohort inside that loss figure, every single time, is the 6 months to 1 year band. The people who bought the top are the ones hurting most at the bottom. That is exactly what capitulation is supposed to look like.
At the low around $60,000 we hit the 96th percentile of that metric. Which in plain English, means that only 4% of days in Bitcoin's entire history had more holders underwater than we did at the low a few months ago.
View live in OCM Studio: % Supply in Loss
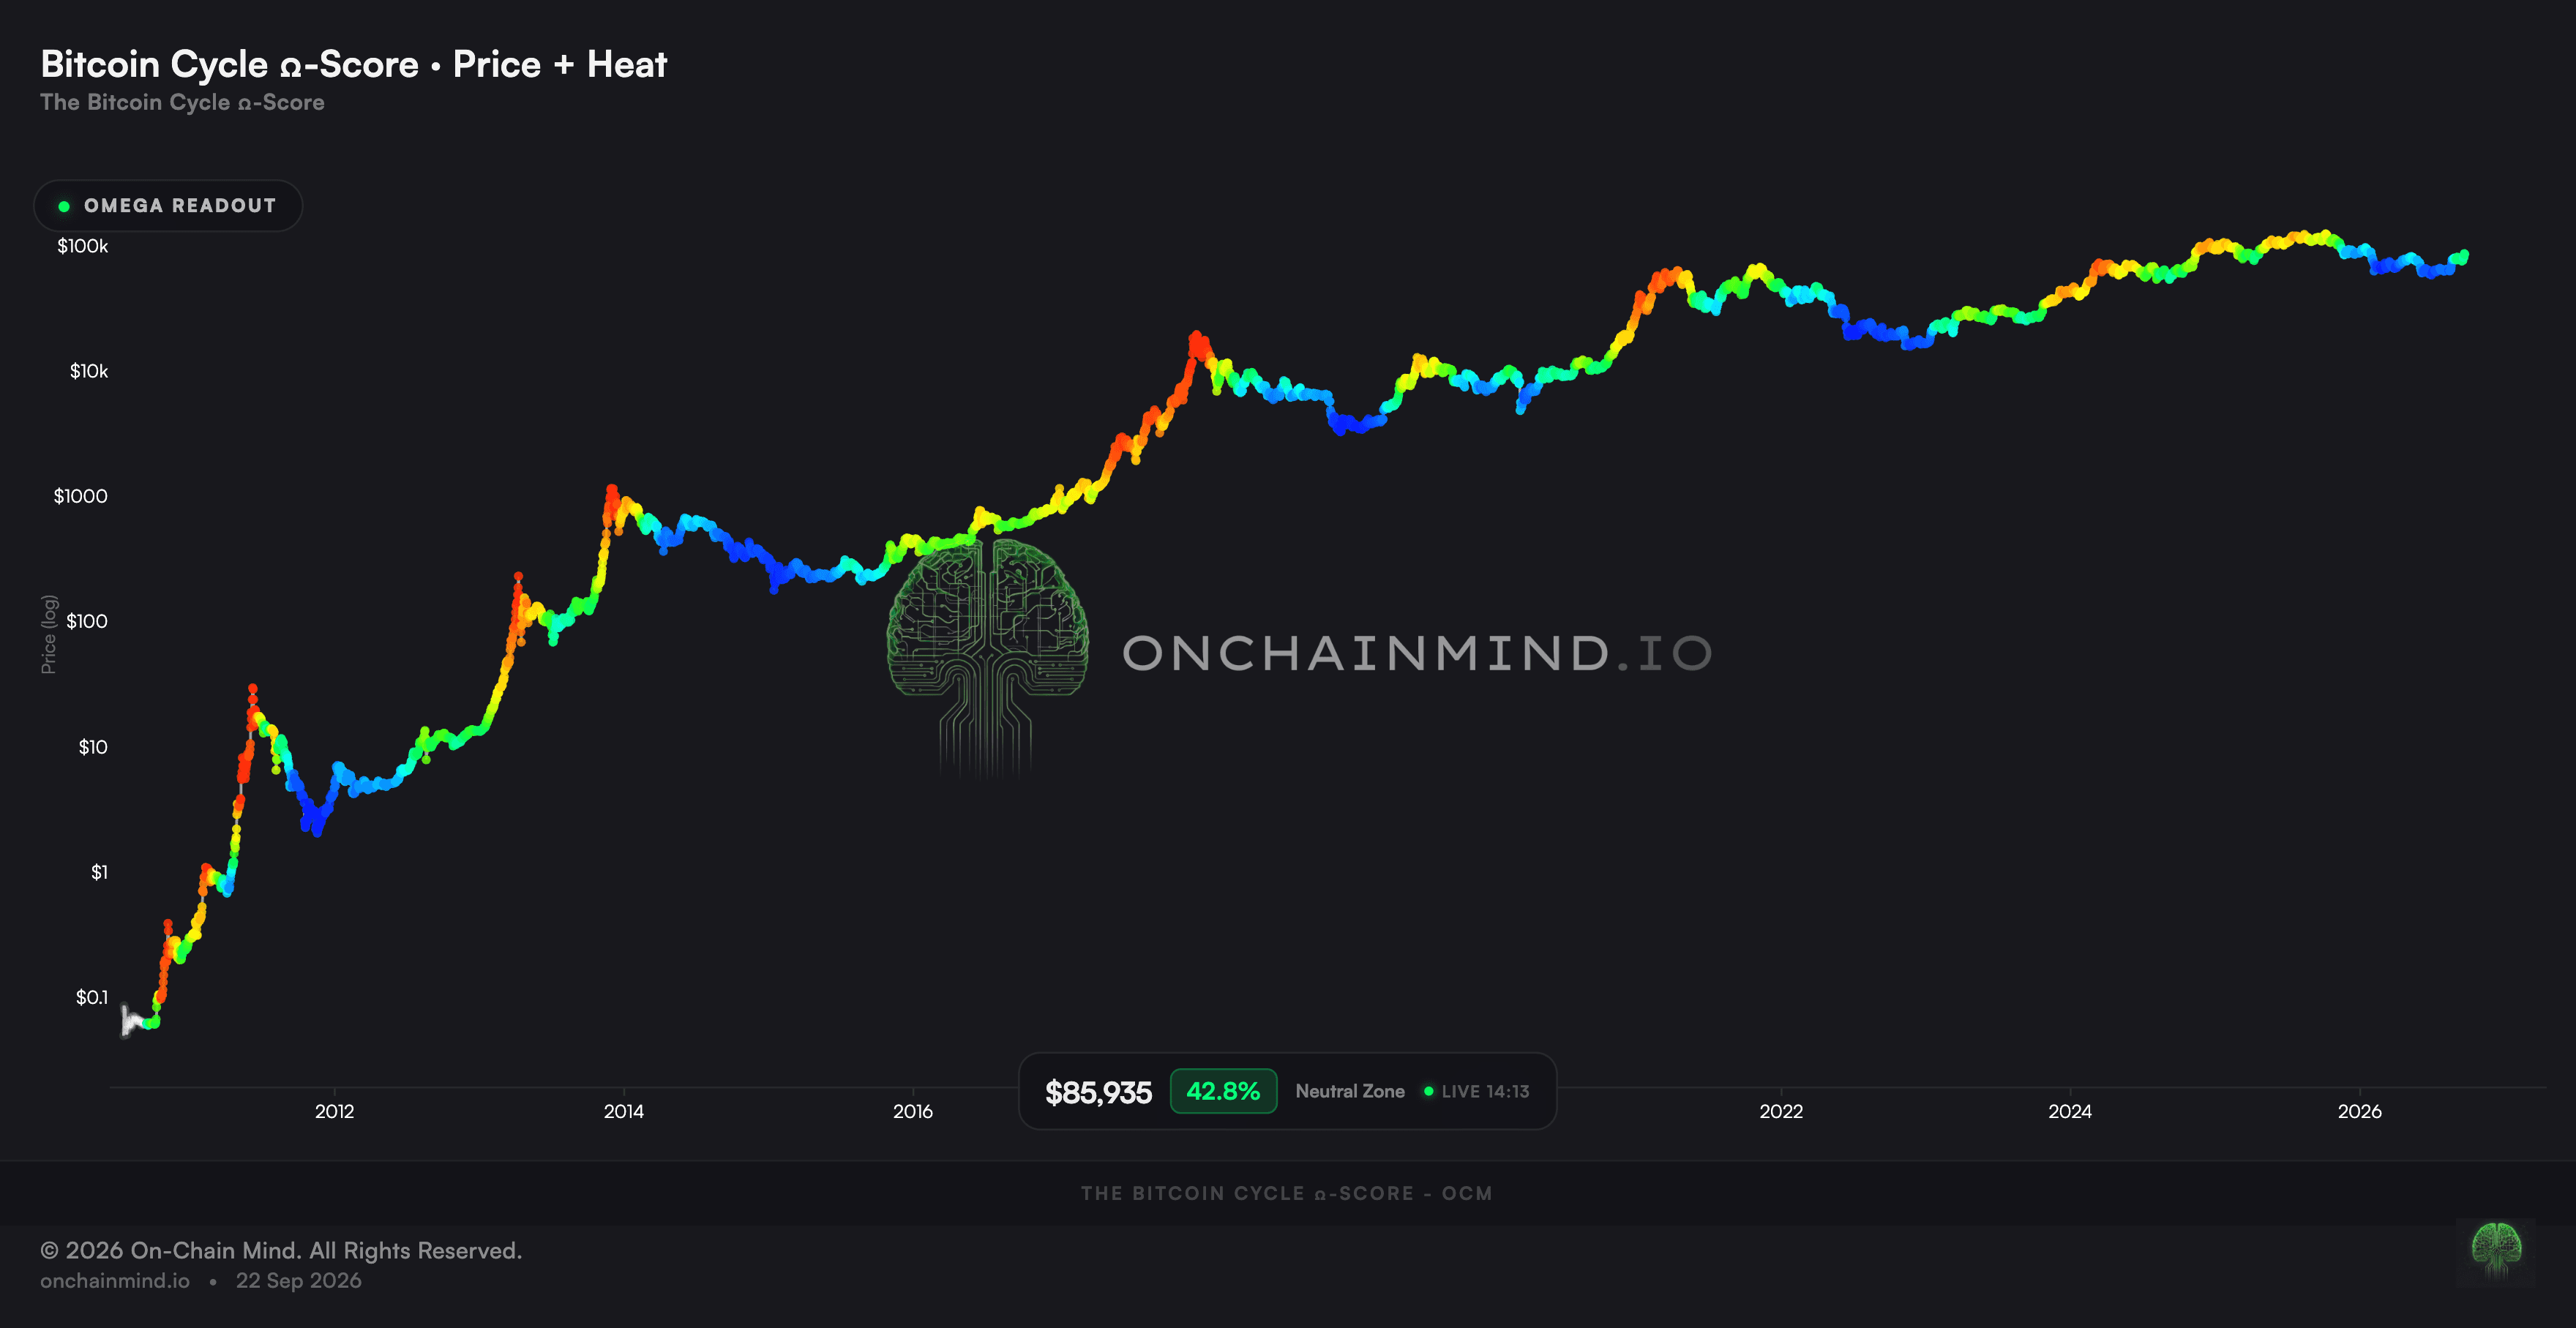
Our Ω-score told the same story from a completely different direction.
It blends dozens of on-chain and technical inputs into a single 0-100% risk reading, and during February's wash-out and the June low it printed deep into the single digits. Those are the moments you close Twitter and just buy mechanically, because the forward risk profile has rarely been any better.
Today that score reads 42%. So completely neutral. Still reasonable territory by my rules, anything under 50% is, but you should be clear-eyed that the bargain basement pricing we were flagging earlier in the year is gone.
View live in OCM Studio: The Bitcoin Ω-Score (cycle view)
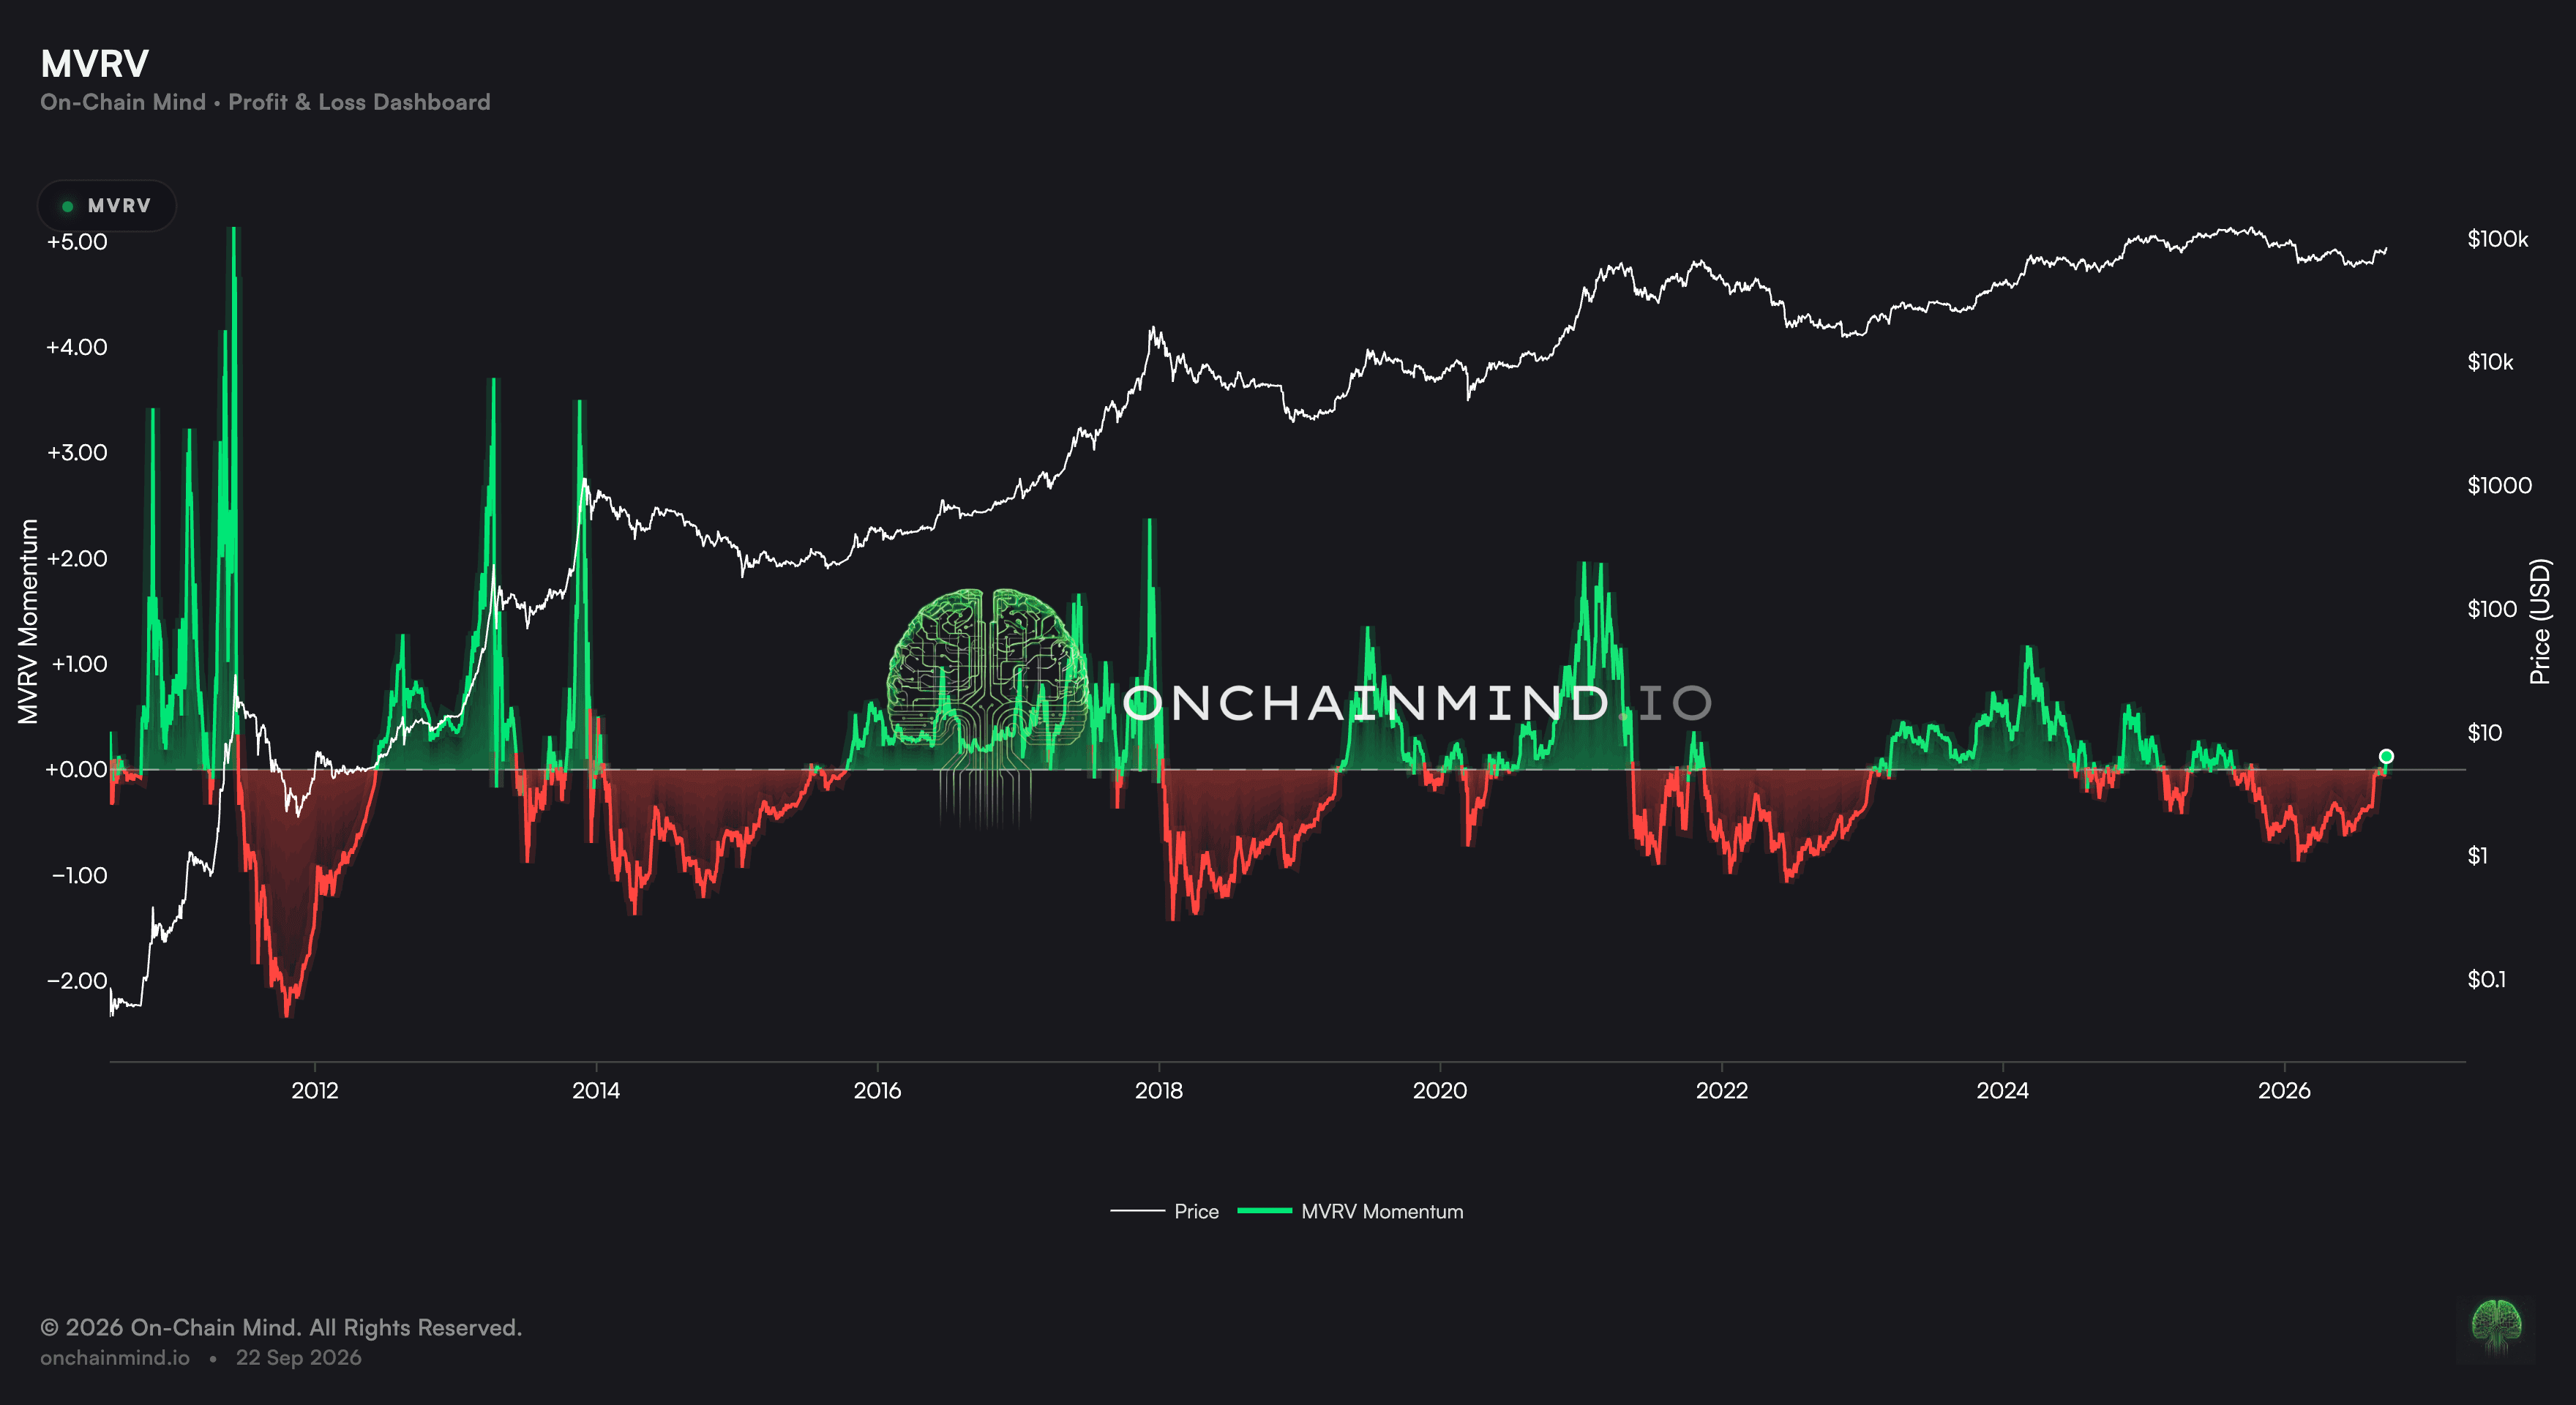
The final piece is MVRV Momentum.
As we discussed in our piece last week, raw MVRV tells you the unrealised profit of the average holder, which on its own is fairly blunt; it tells you where profitability sits, not where it's heading.
Compare its short-term average against its long-term average and you get something far sharper: a read on whether investor profitability is accelerating or decaying, the second derivative rather than the first.
Bear markets are defined by deeply negative momentum, holders sinking further underwater on average even as price chops sideways. Every bull market resumption in history has begun the same way, with that measure flipping positive before the broader recovery becomes obvious to everyone else.
It flipped positive last week, for the first time in well over a year. Momentum doesn't turn on a headline, it turns on holders quietly deciding the worst is behind them, and that's exactly what this measure just caught.
View live in OCM Studio: MVRV Momentum
Who Is Actually Doing The Buying
This is the part of the picture that has changed most since the last cycle, and I don't think enough people have updated for it.
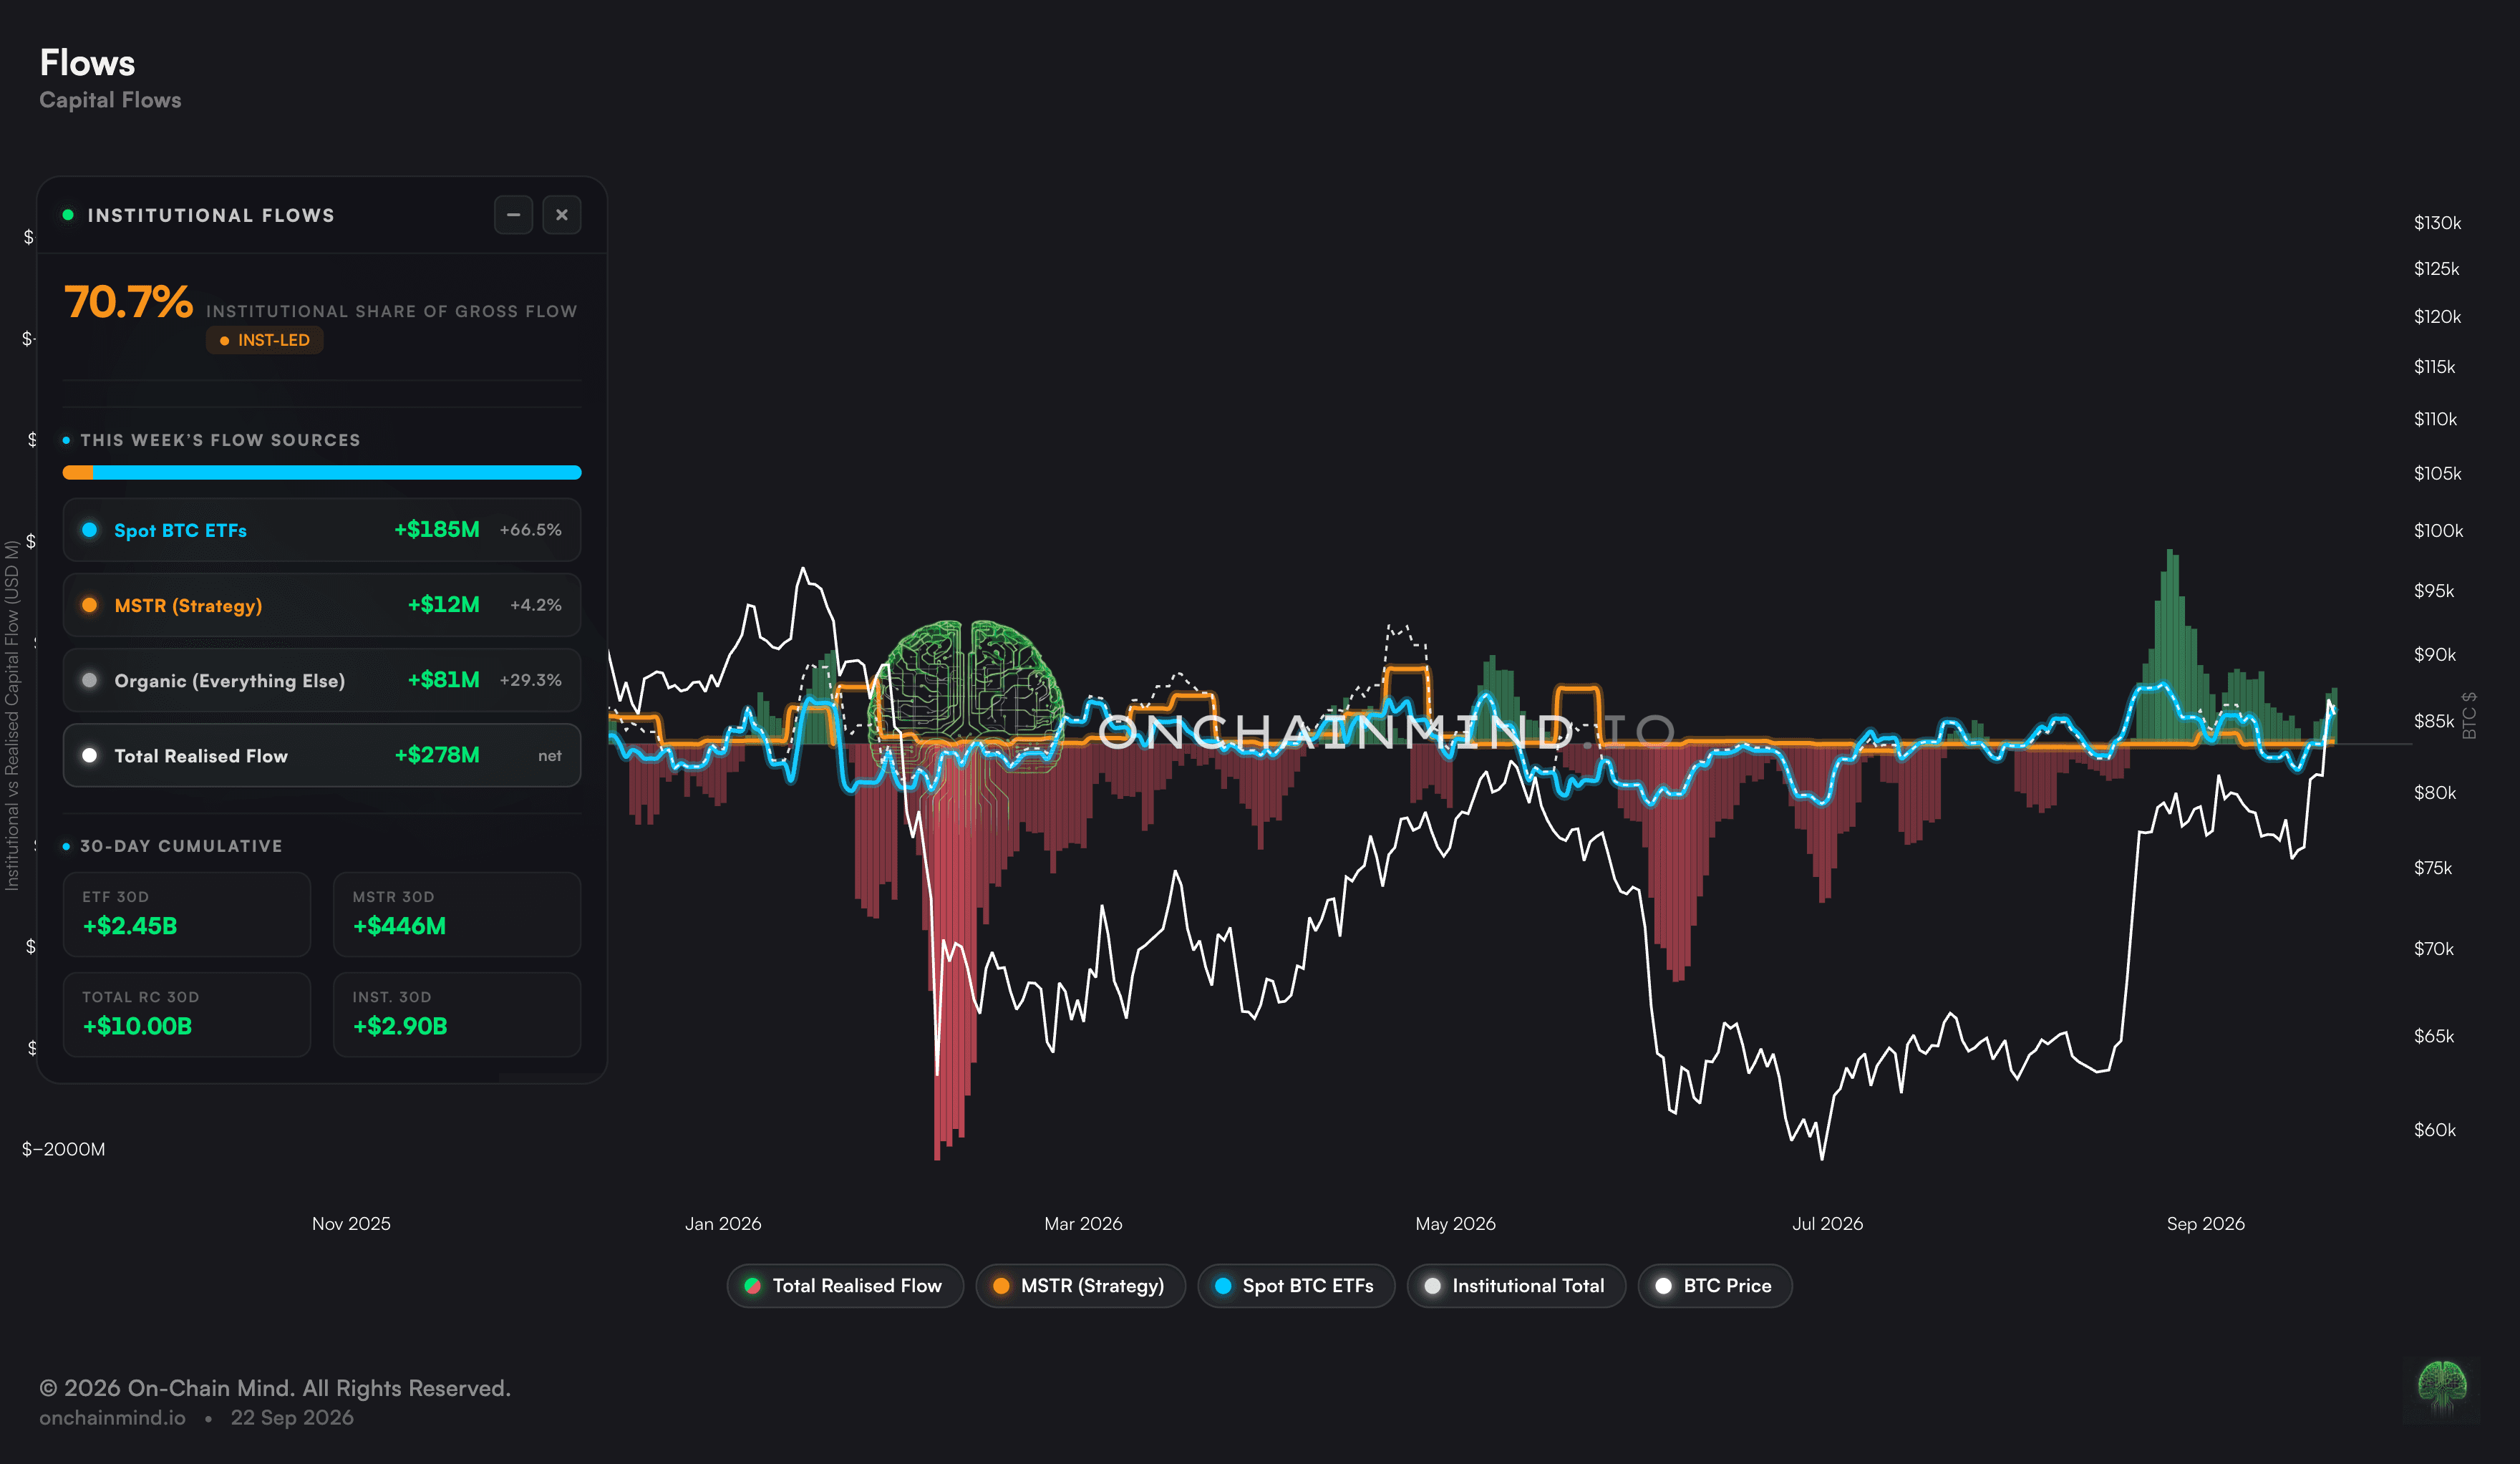
Our Capital Flows dashboard tracks the real dollars entering and leaving the network on a rolling 30-day basis, not paper valuations. Overlay the ETF complex and Strategy's purchases on top and you can attribute a meaningful share of that recent flow to identifiable institutional wrappers.
Over the past 30 days, since the move up from $63,000, roughly $10 billion of realised capital has flowed into the network. Around $2.9 billion of that came through the ETFs and Strategy. That's nearly a third of the entire move, funded by vehicles that didn't exist two cycles ago.
Dismissing these wrappers as a sideshow simply doesn't hold up anymore.
View live in OCM Studio: Realised Capital Flows
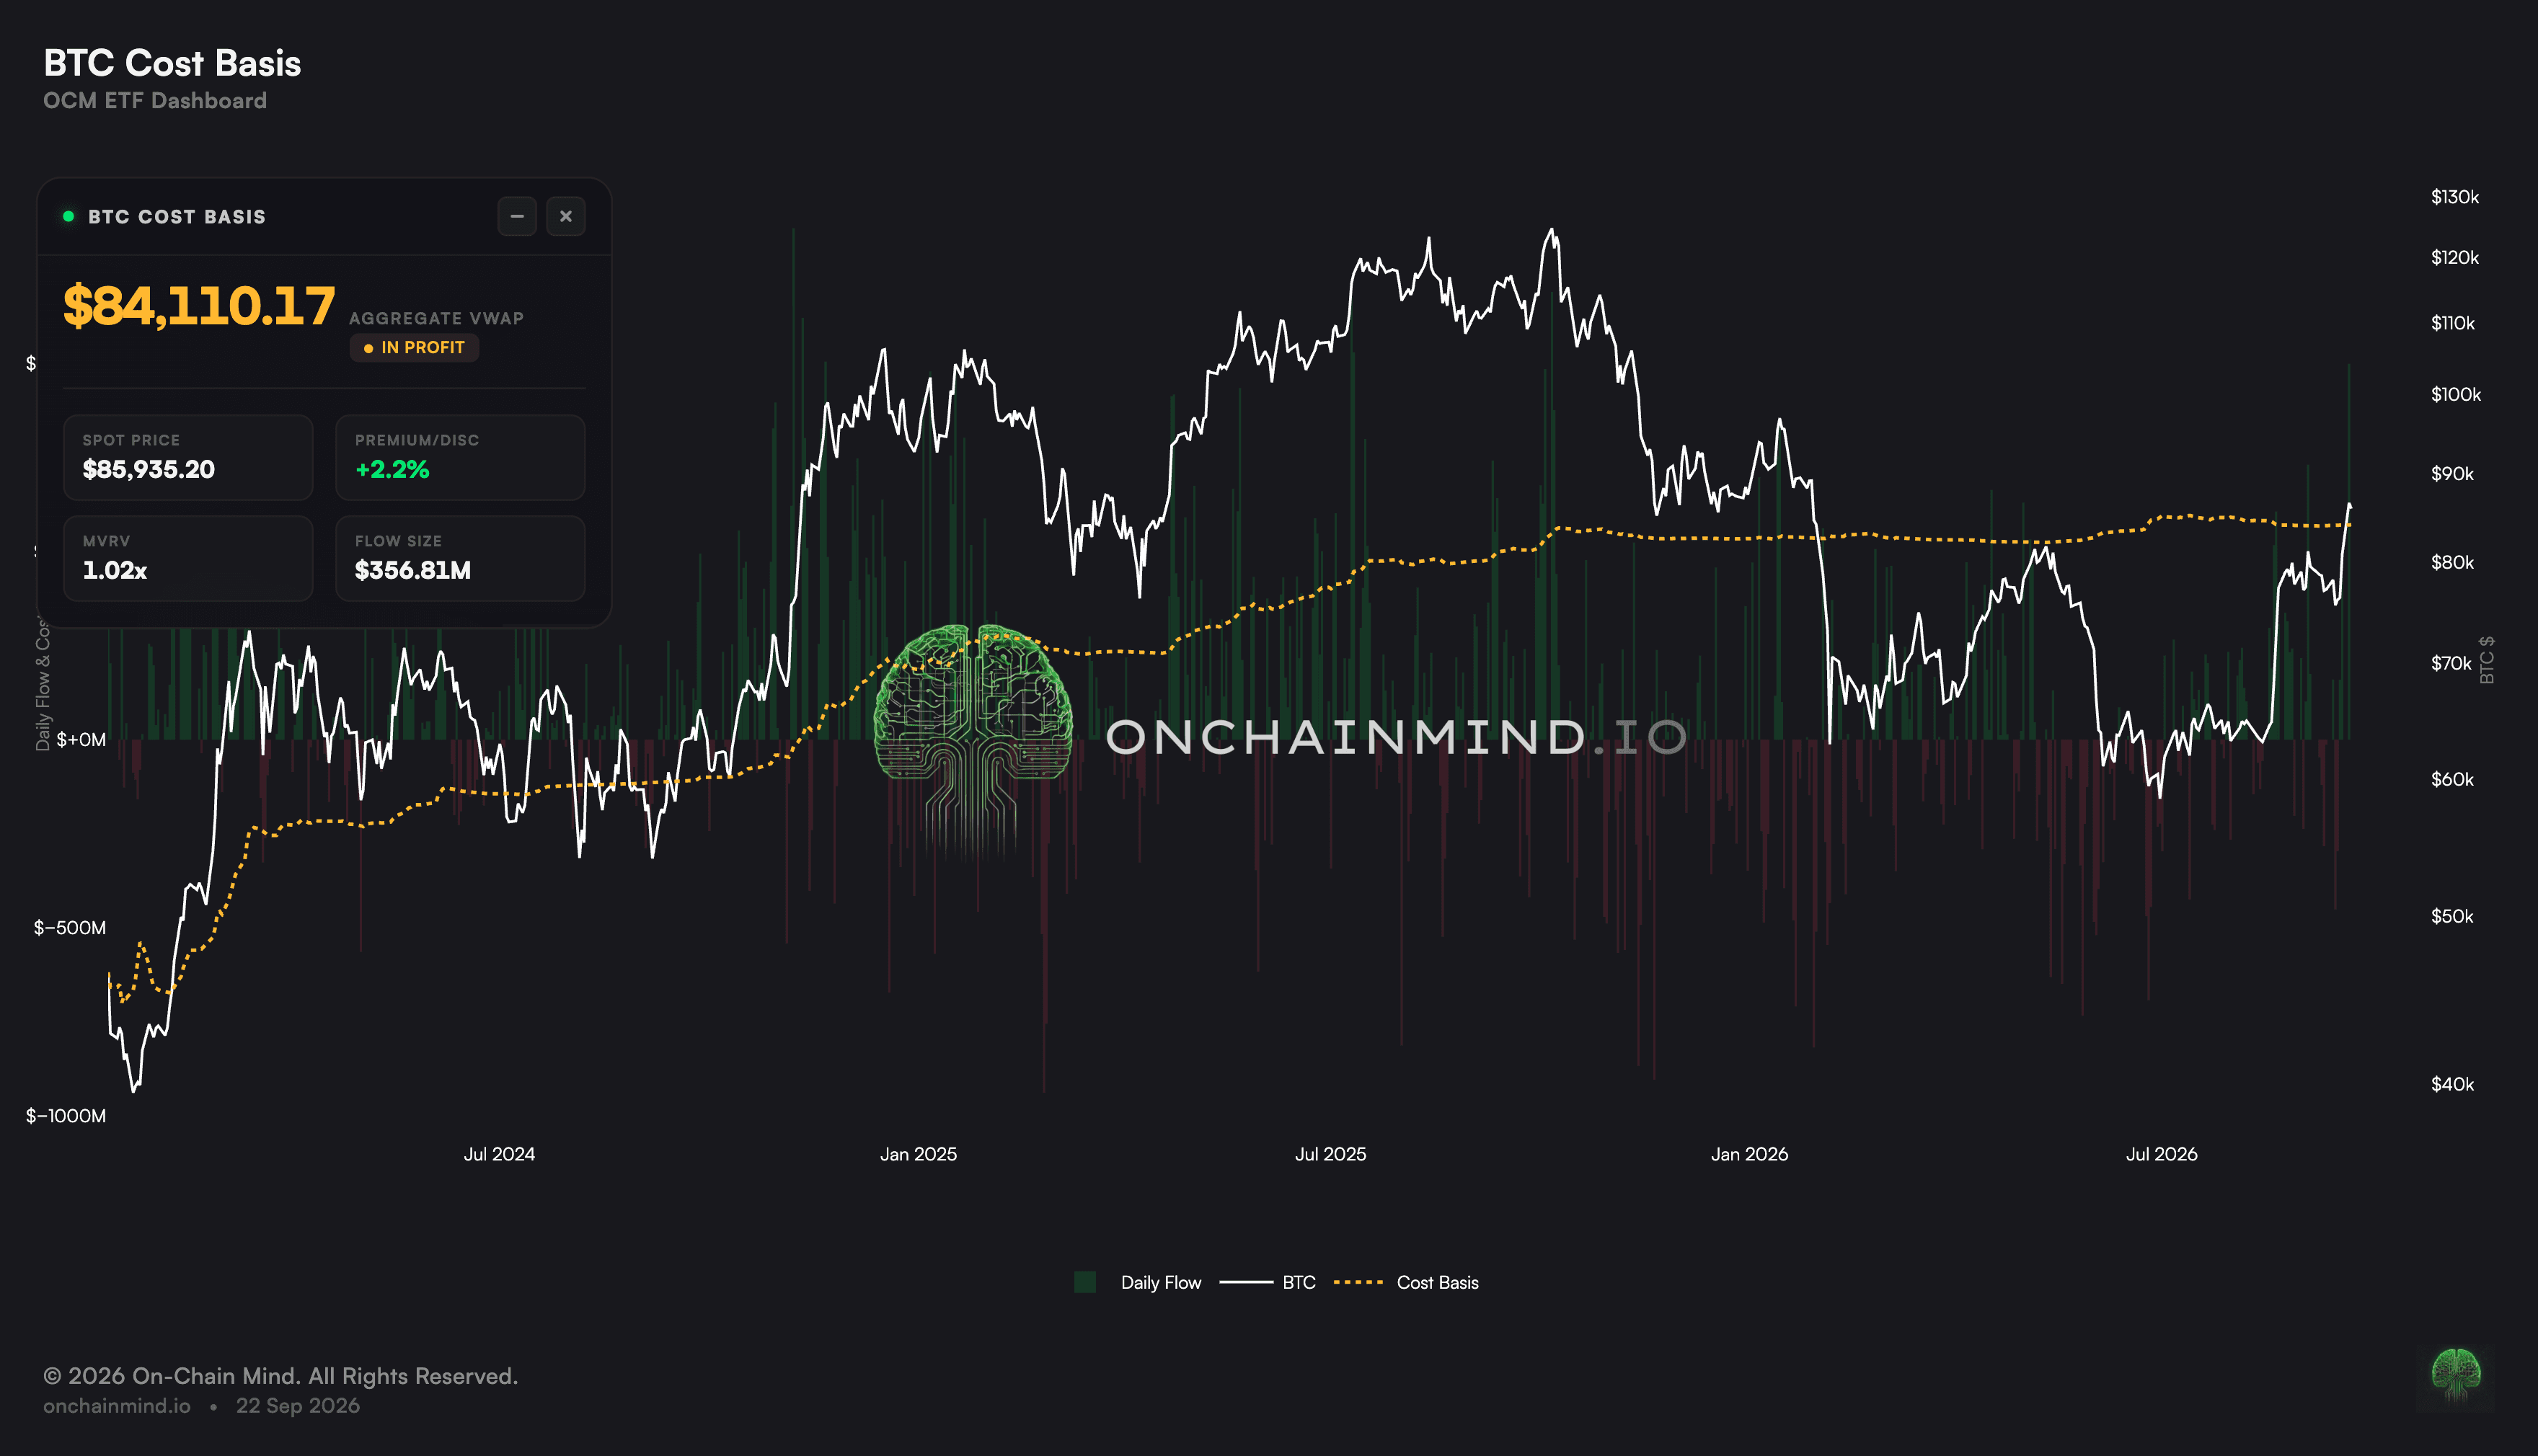
Which brings us to the level I'm watching very closely. The approximate cost basis of the average ETF holder sits at around $84,000, meaning that for almost the whole of this year that cohort has been underwater. We are now pressing straight into their break-even.
Two things can happen from here. They defend that level and it becomes structural support, or they use the rally to exit flat and cap the move. This is a major psychological price level, and how price behaves around it will tell us plenty.
View live in OCM Studio: ETF Cost Basis
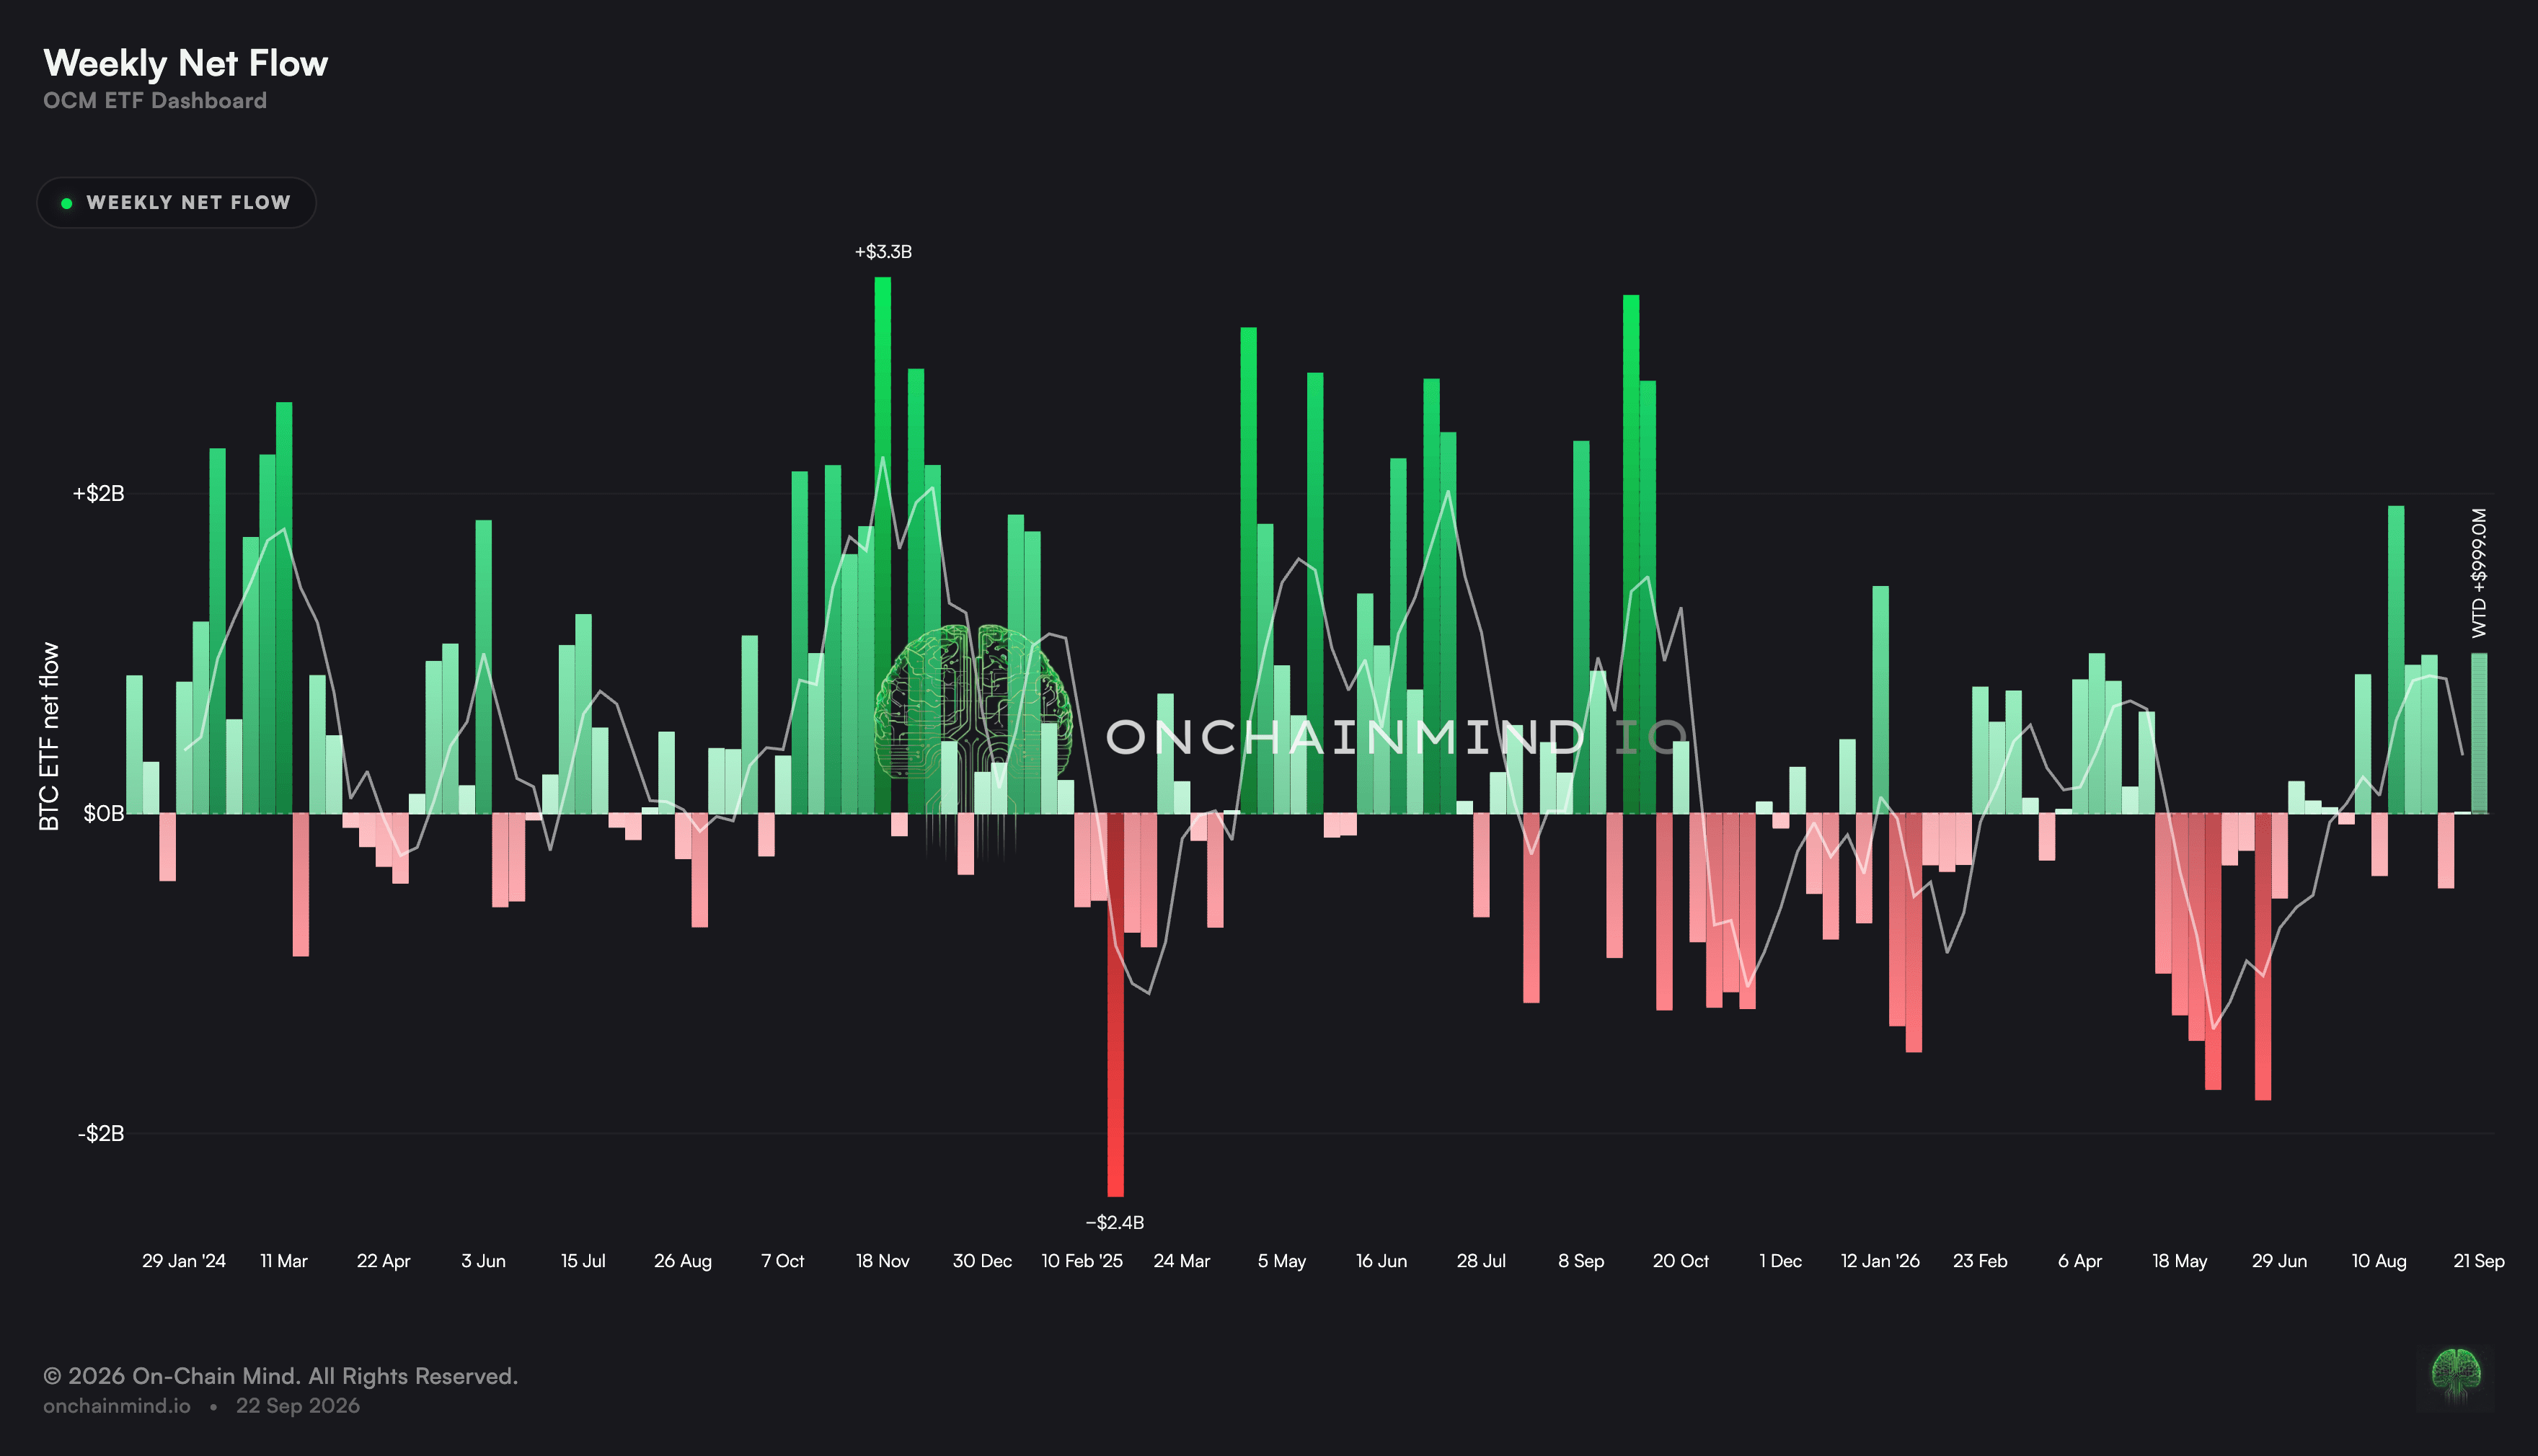
What encourages me is the early evidence. The complex took in a billion dollars of net inflows in a single day yesterday, the seventh largest ETF inflow day ever recorded, and it didn't come from nowhere.
Flows cluster, positive and negative alike, and the mechanism is straightforward. Desks and funds set their exposure targets based on recent price action and recent flows, so a strong start to a week often begets more of the same as the next round of allocators follows the trend rather than fights it.
The same goes for Strategy. They've always been able to buy more as price has risen, and a week like this is exactly the kind of tape that lets them keep doing it. So I never look at these positive weeks as something to be afraid of. Rather, I treat them as the precursor to a positive flow of momentum for the next month or so.
View live in OCM Studio: ETF Weekly Flows
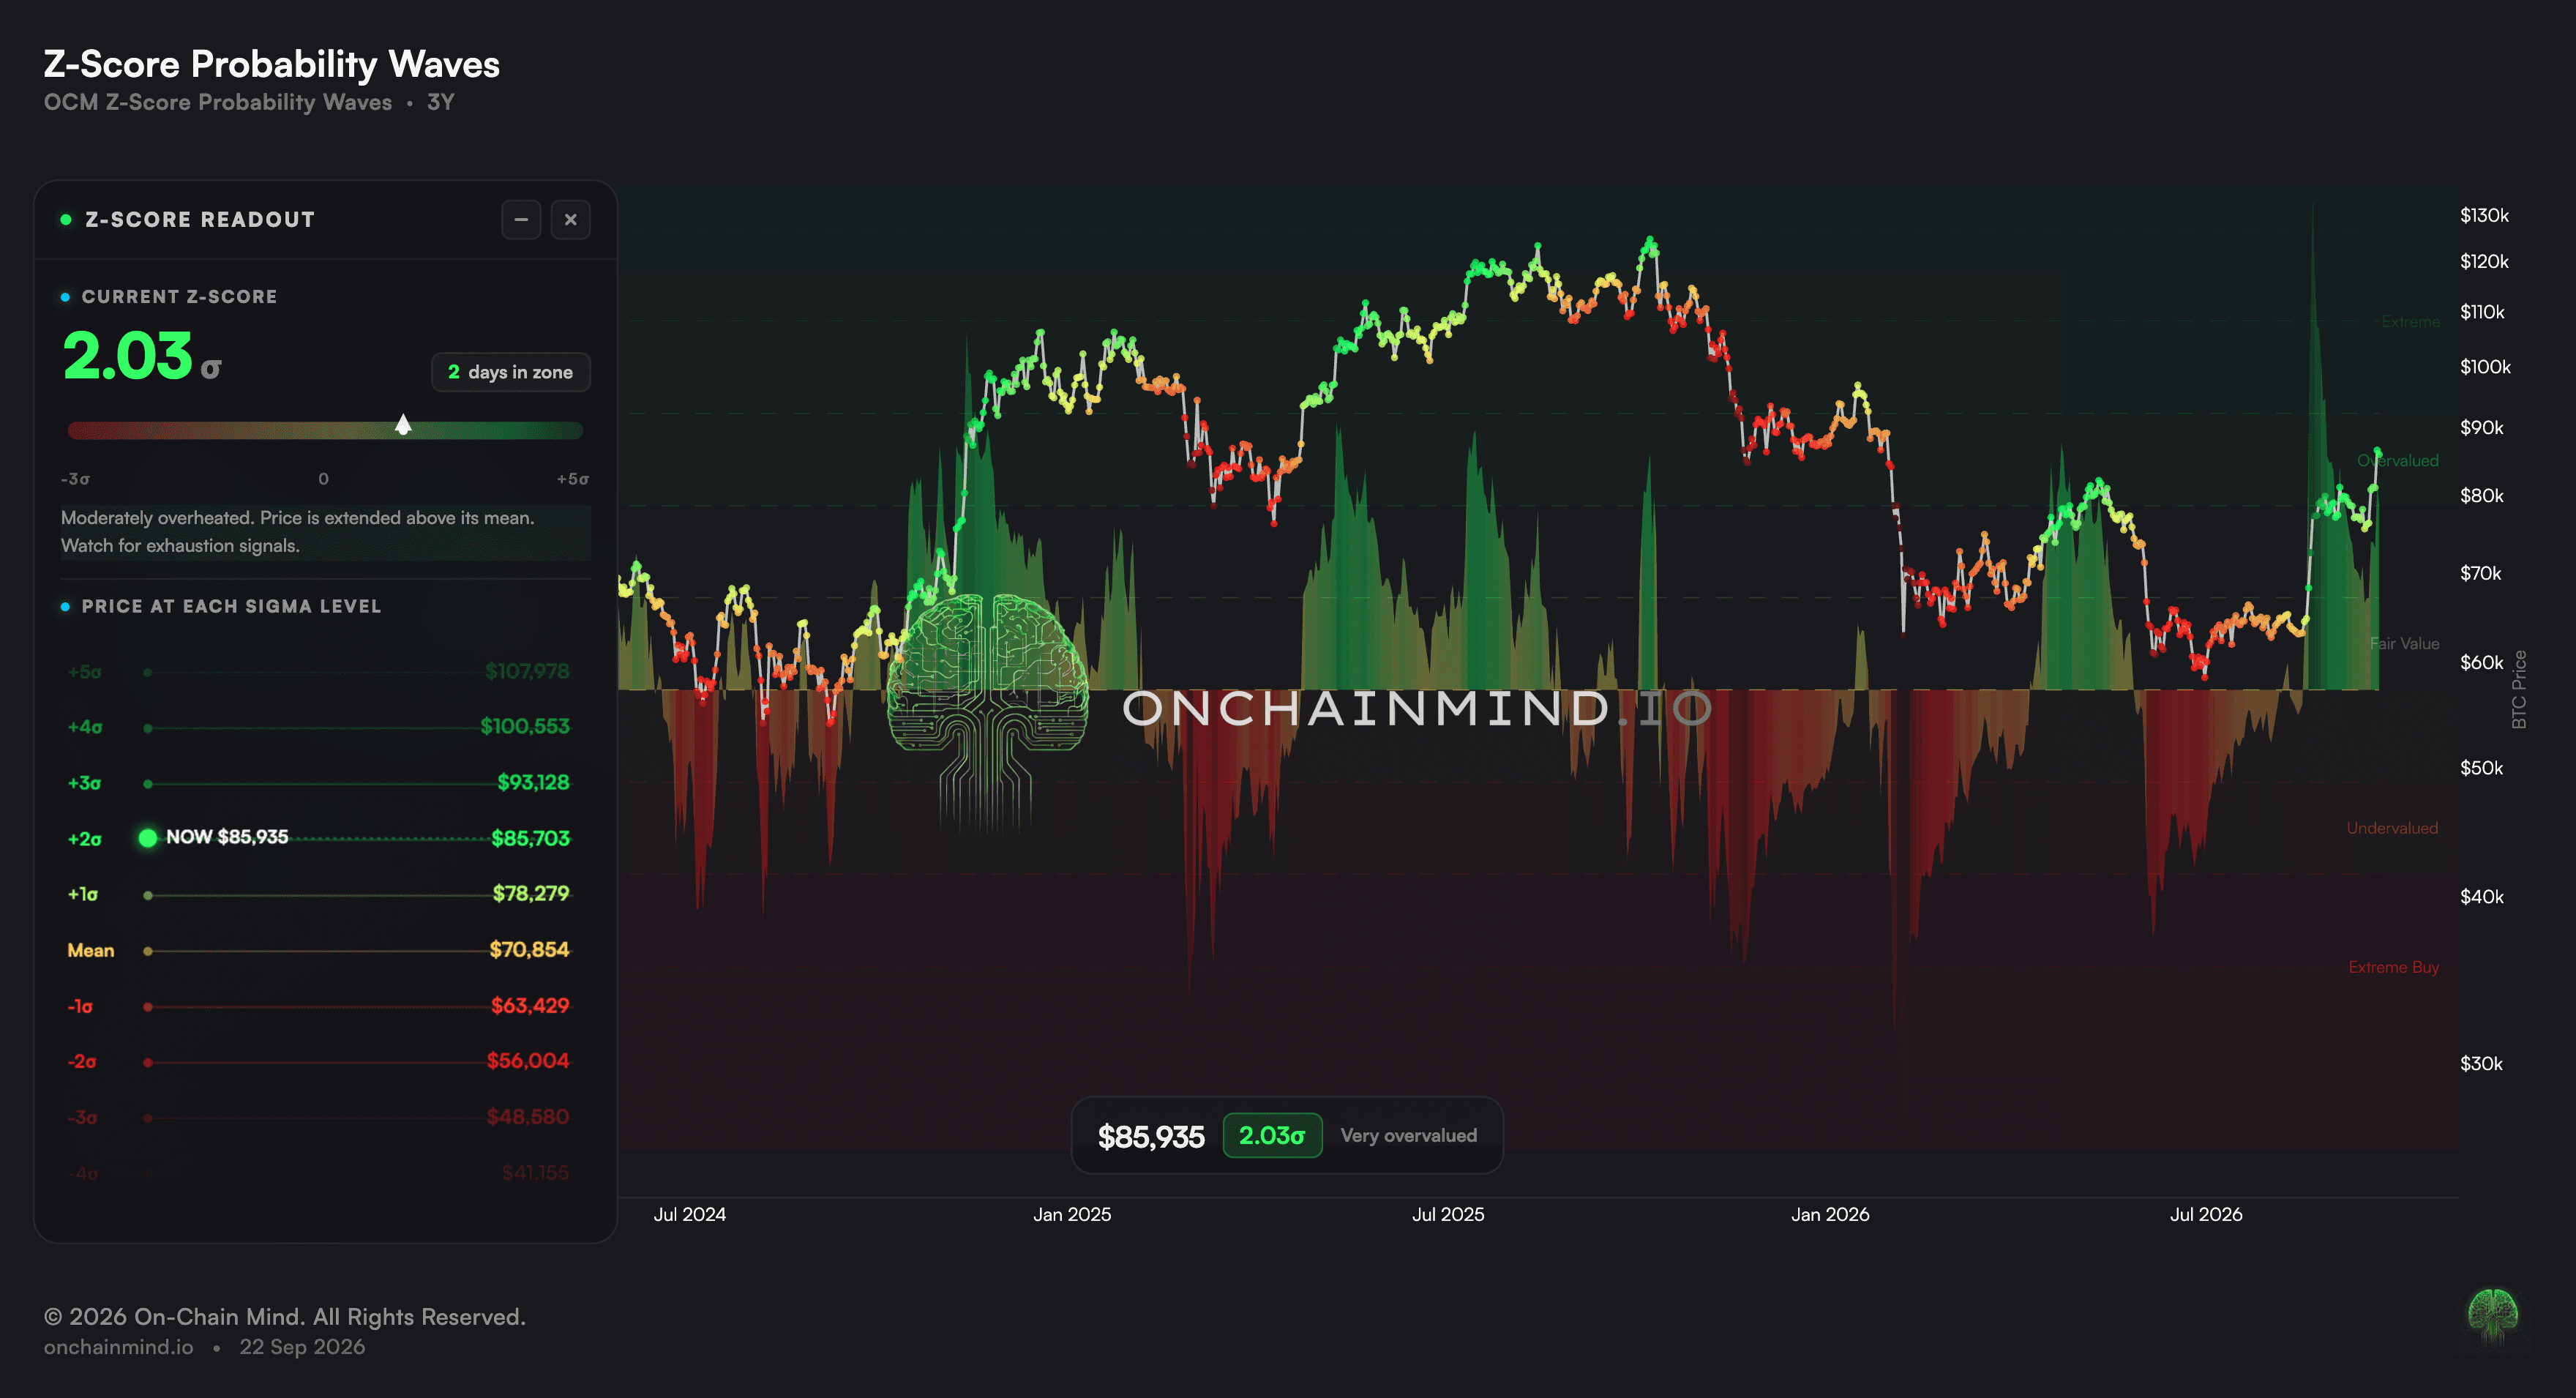
On the technical side, the Z-Score Probability Waves on the Trader view has us at a +2 sigma event, which is stretched, but not one I'm losing sleep over, because stretched quite often doesn't mean finished.
A reading like this is rare enough that it historically marks the upper edge of what a healthy uptrend can absorb before pausing, not the point where it breaks.
We hit +5 on the god candle into the high $70,000s and needed barely a week of cooling before the trend resumed, so the precedent here isn't exactly threatening.
And when you run the historical distribution at this exact reading, a +2 sigma print, price was higher 70% of the time over the following 90 days, with the downside cases mostly shallow consolidations rather than outright reversals.
Momentum begets momentum, more often than not.
View live in OCM Studio: Z-Score Probability Waves (Trader view)
I'd Rather Be Early Than Clever
I'm not going to stand here and declare the bull market confirmed with a stamp on it, because that requires knowing the future.
What I'll say is that every ingredient that has historically marked this transition is now on the table at the same time, and I've learned to respect that kind of confluence more than I do any single chart.
My three key pricing levels are reclaimed, and I've been waiting for that for almost a year. The rally is also too violent to reasonably be considered a late-stage bear bounce. Also, profitability momentum has turned positive for the first time since this bear market began, and that shift has historically been one of the most reliable signals that the tide is turning positively.
Combine that with the textbook readings we wrote about repeatedly through the middle of summer: over half the supply was underwater at the low, worse than 96% of all days on record, and the Ω-score printed single digits, another signal we flagged in real time.
Could this still fail? Of course. If we lose those three levels as support over the coming weeks, I'll tell you, and the picture changes quickly, and we're likely in for some more time-based pain. But does that worry me? No. It didn't worry me at $58K with a single-digit Ω-score. In fact, it excited me that I could buy at those levels, because we know those levels don't last forever.
So I'm never going to be one of those analysts who tells you their conviction is fact. We all read the market differently, and trust me, I still get messages every week telling me we're heading to $32K in October. That's what makes a market. If we all shared the same opinion and forecast, there'd be no movement at all.
As you know, I like to play the probabilities and the on-chain data, which is about as close to irrefutable as this market gets. And I keep coming back to the same stance after enough cycles of this: it pays to be a bull. You don't get paid for bearishness in this asset, you just get to look clever for about 20% of the time and leave every gain on the table for the other 80.
Bitcoin rewards positivity.
And for the next 12 to 24 months, positivity is firmly my base case.