

Bitcoin is about 14% below its September high, and it has now gone 49 days without pushing any higher.
Judging by my comments, a lot of people have already decided the bull market is over. Again.
I understand why. 7 weeks of drifting lower after a strong end to the summer feels like the end of something. But feelings are a poor guide to any market, because bull markets feel a lot worse from the inside than they look on a long-term chart.
So let me show you how much time Bitcoin actually spends going down and sideways in a bull market, how deep and how long its pullbacks have normally been, and the one region of price I think decides whether this is a pullback or something much worse.
Let's get into it.
Key insights
1 Day in 10: Across the last three bull markets, Bitcoin closed at a new cycle high on only 12%, 8% and 10% of days.
A Few Days Do the Work: In each of those bulls Bitcoin rose between 8 and 110 times, yet take out the best 1 day in 10 and the other 9 days, added together, went down.
Shallower Than Every Past Bull: At about 130 days old, this cycle's worst pullback is about 14%, against 26%, 18% and 19% for the last three bulls at the same age.
The Region That Decides: Our three key pricing levels now sit within a few thousand dollars of price, and which side of them Bitcoin settles on is what I'm watching.
Bull Markets Feel Worse From the Inside
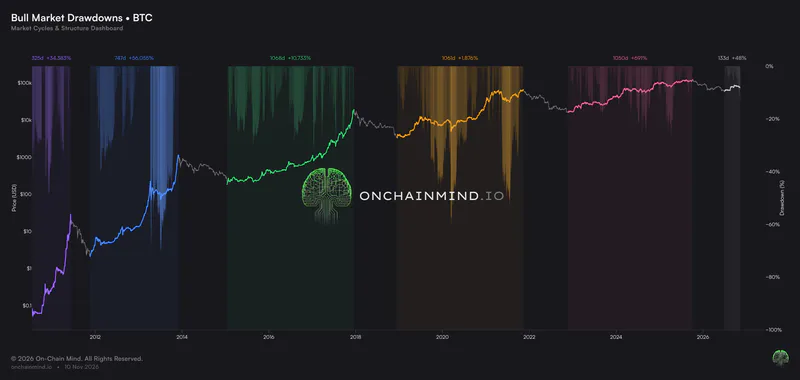
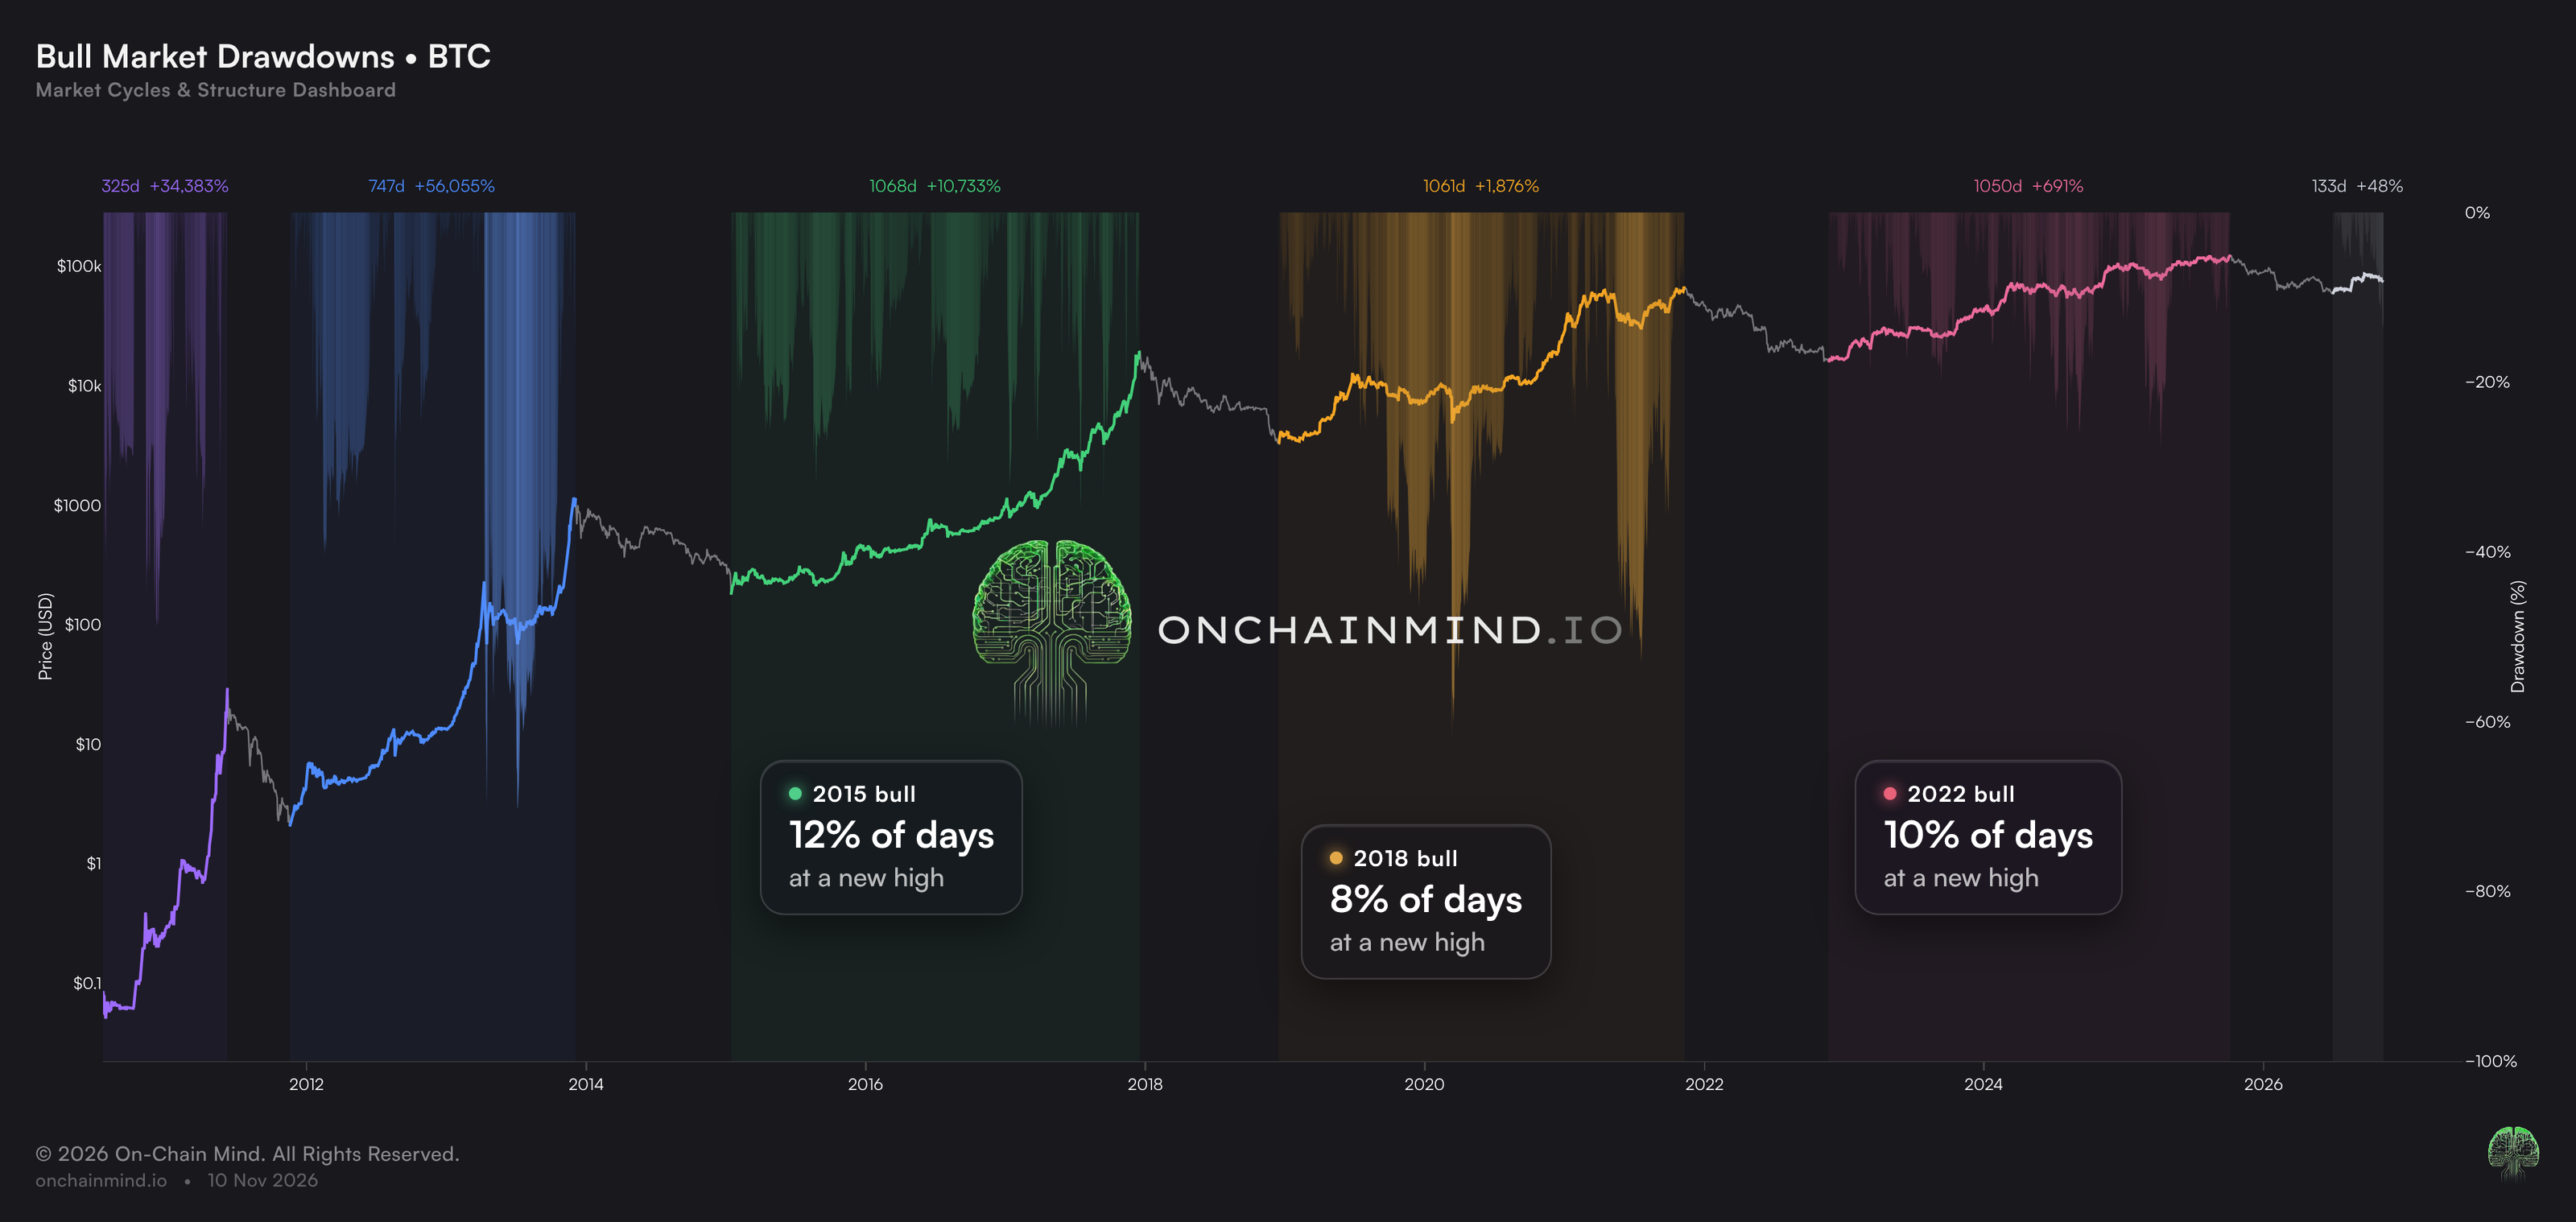
Let's start with the Bull Market Drawdowns view on our Market Cycles dashboard.
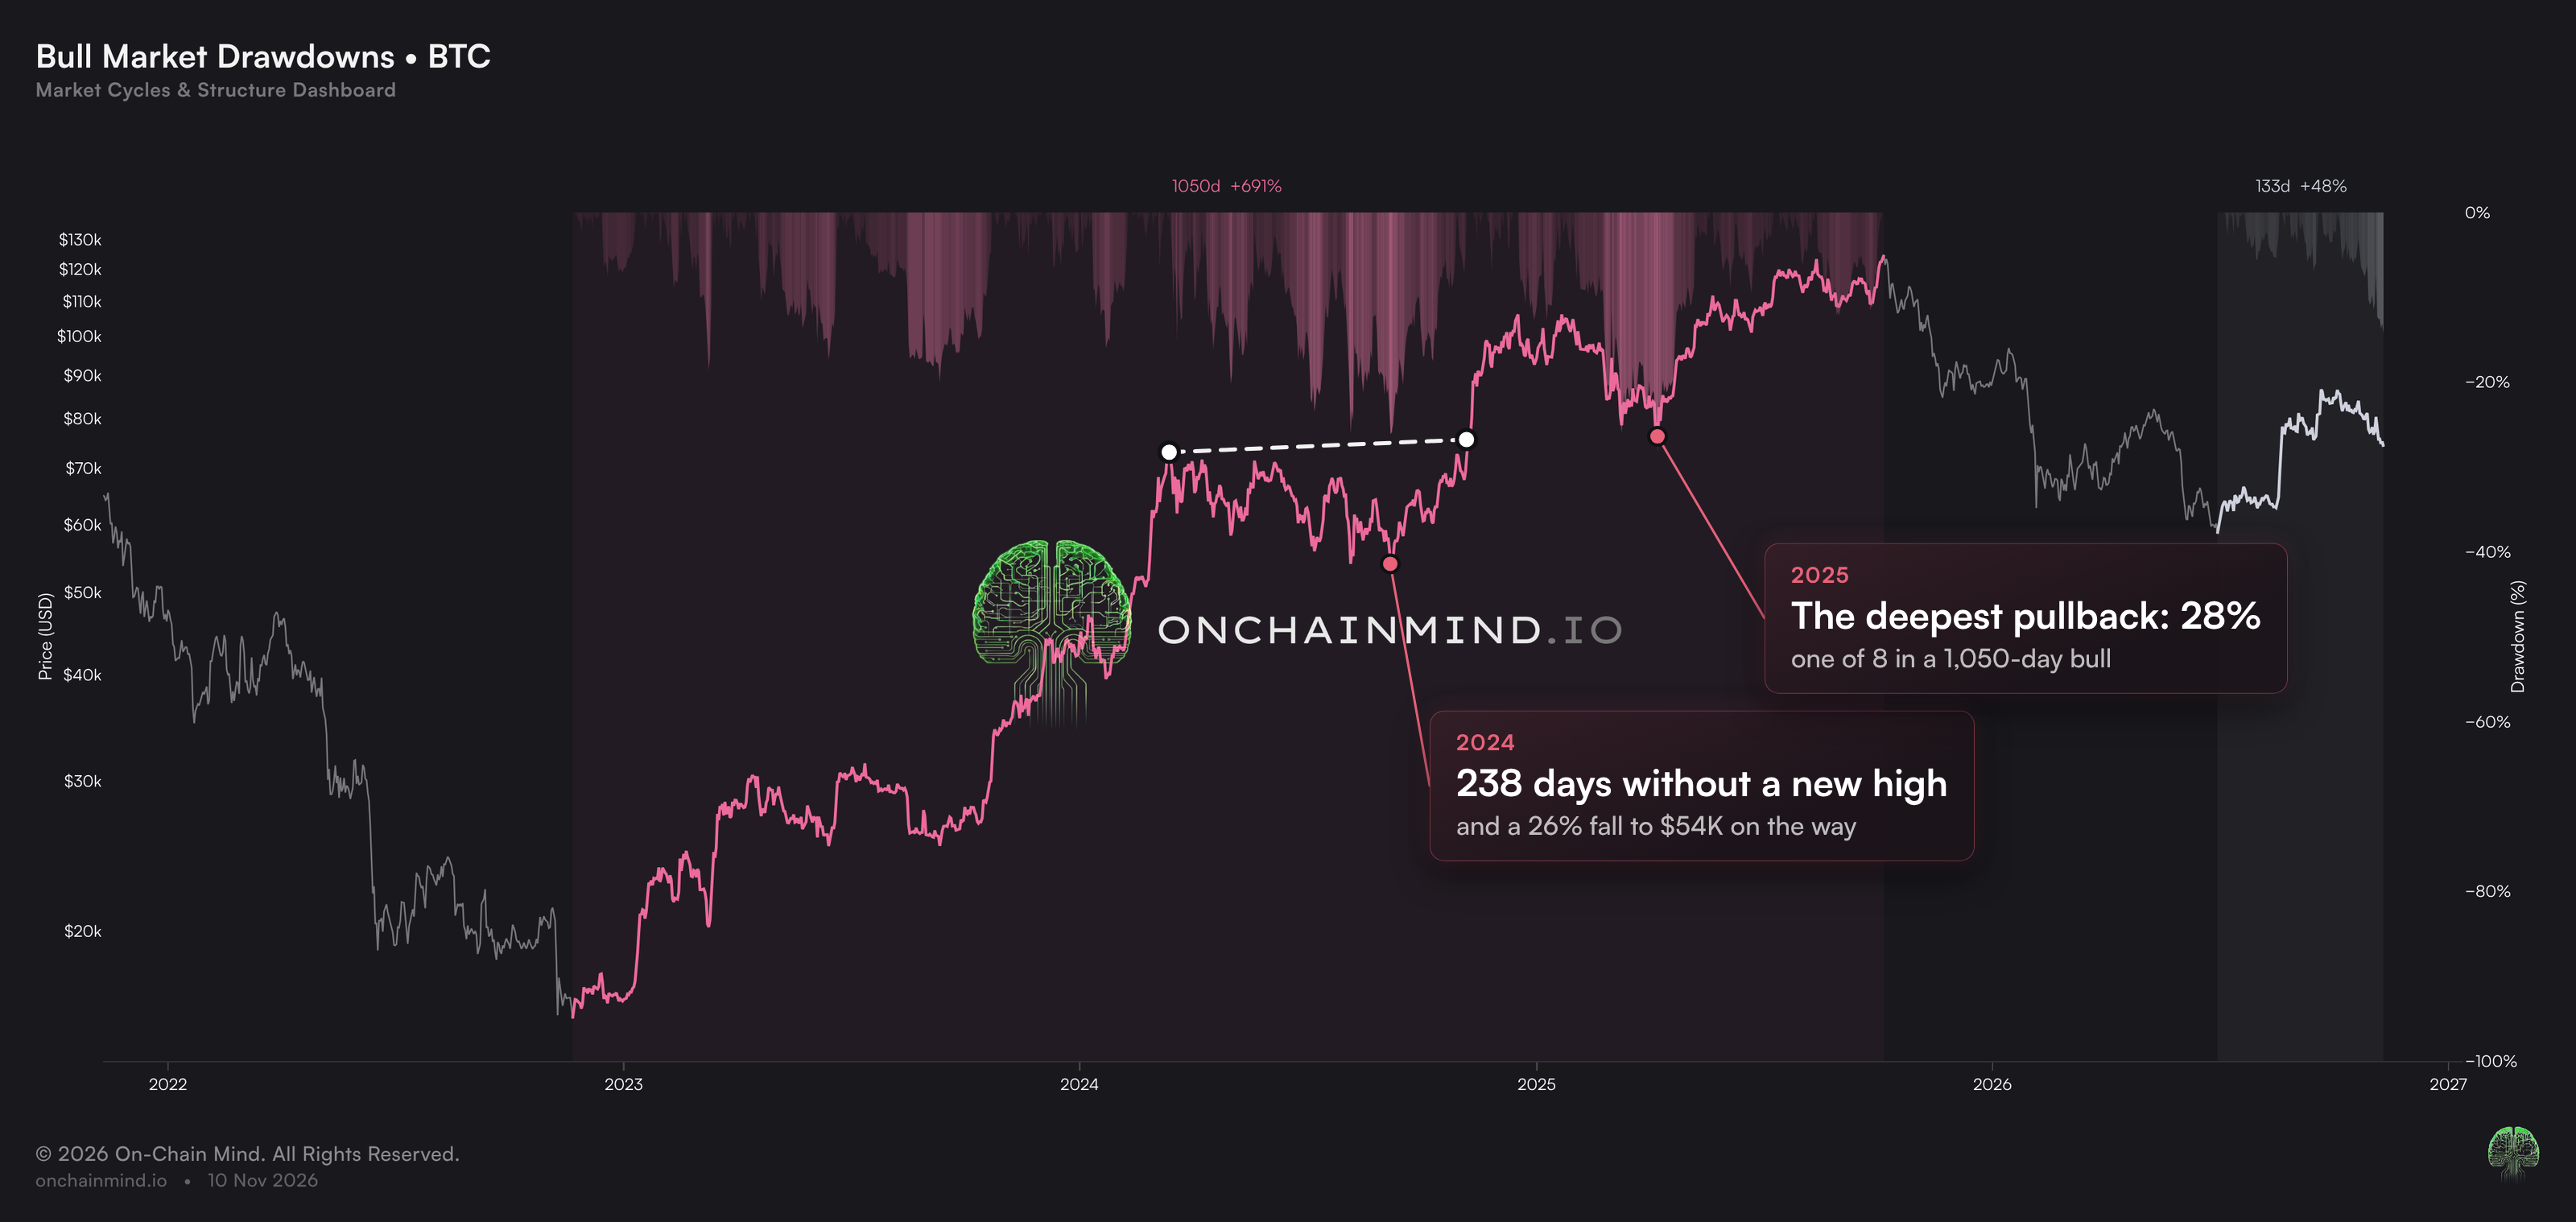
Each shaded band is one bull market, from its cycle low to its cycle high. The line is price, and the spikes hanging down from the top of each band show how far price sat below the highest close of that bull so far. Whenever a band touches the top with no spike, Bitcoin is at a new high. Whenever it drops away, it's in a pullback.
What I want you to notice is how little of each band actually sits at the top.
View live in OCM Studio: Bull Market Drawdowns
Across the last three bull markets, 2015 to 2017, 2018 to 2021 and 2022 to 2025, Bitcoin closed at a new cycle high on only 12%, 8% and 10% of days.
That's roughly 1 day in 10. The other 9 were spent below a high it had already printed.
Zoom out to months and it's the same story: about 1 month in 3 still finished lower than the month before.
Cut each bull into 30-day stretches and only about 4 in 10 rose by more than 10%. Nearly half went sideways, moving less than 10% either way, and the rest fell by more than 10%.
Put another way, in a typical bull market you'd have spent most months looking at a chart that was going sideways or down, wondering whether it was all over.
So if it feels like Bitcoin spends most of a bull market going nowhere, that's because it does.
Where the Gains Actually Come From
If most days go nowhere, where did all the gains come from?
This is the part that explains the frustration better than anything. In each of the last three bulls Bitcoin rose between 8 and 110 times from bottom to top. Yet take out just the best 1 day in 10, and the other 9 days, added together, went down.
So the entire gain, and then some, came from that 1 day in 10.
That’s what a bull market is: long stretches of chop and grinding lower, broken up by a handful of violent days that do almost all of the work. Those days rarely announce themselves, and they tend to arrive when the mood is at its worst.
This is why I never try to trade around the chop with my long-term stack. Miss a few of the best days and you miss most of the bull.
31 Pullbacks, and Every One Was Normal
So how deep do these pullbacks usually go?
I took every fall of more than 10% from a high inside the last three bull markets. There were 31 of them, and the typical one, the median, was about 21%.
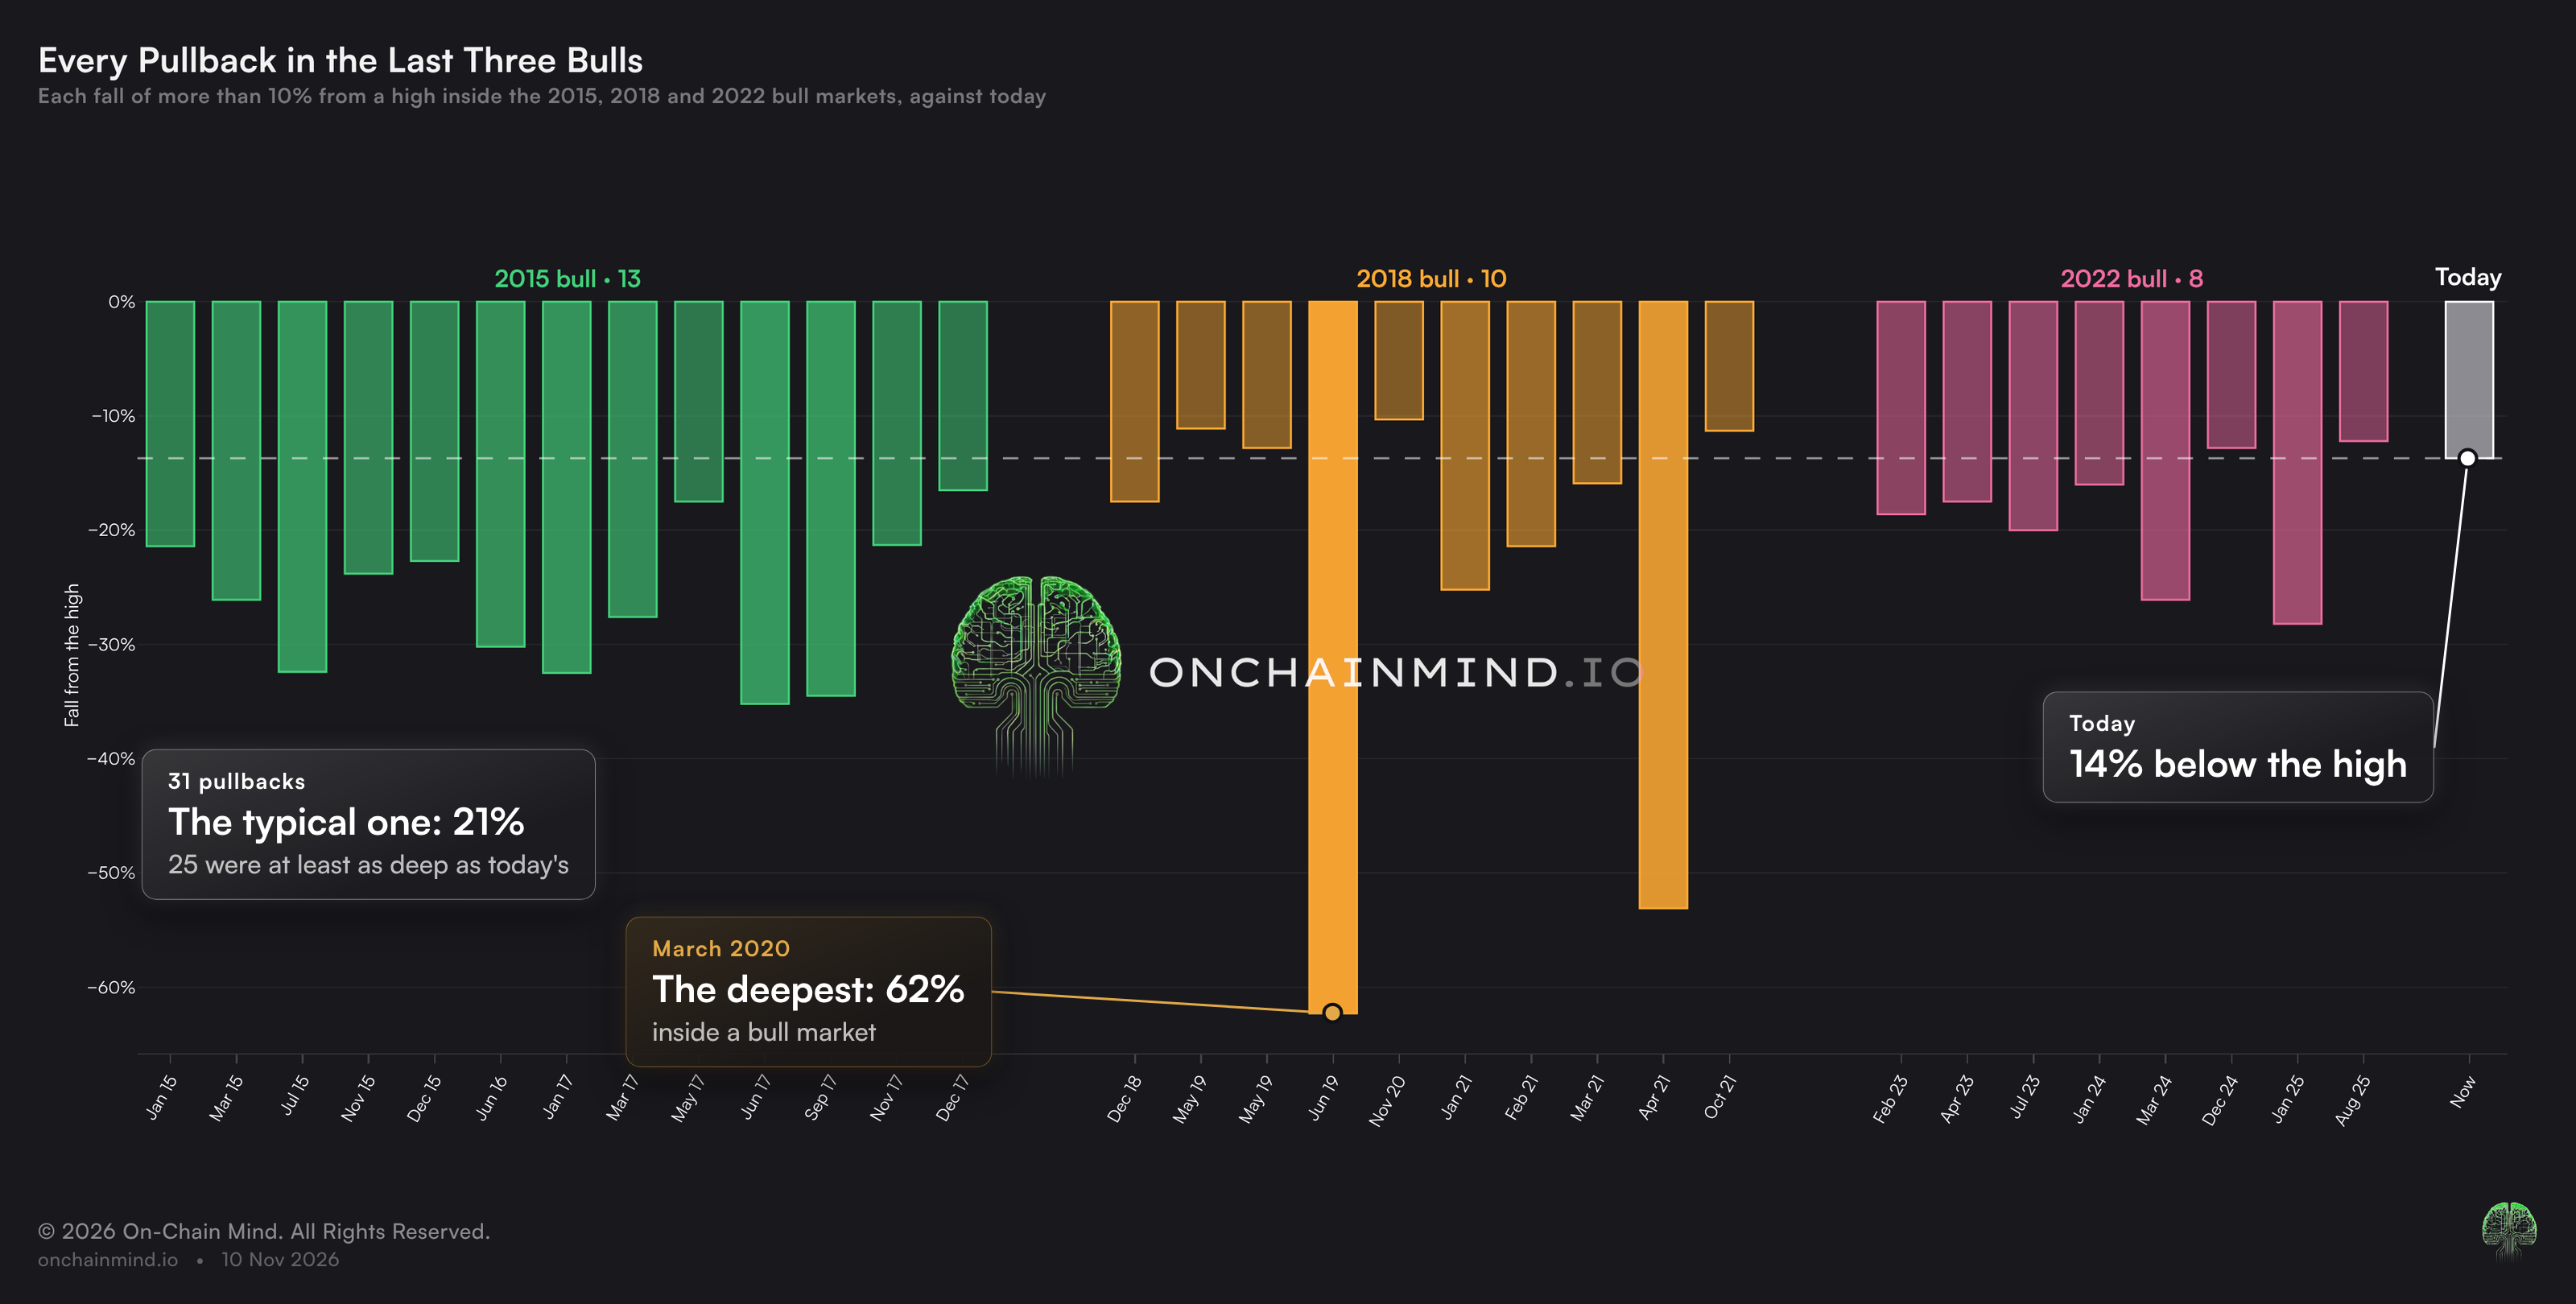
25 of those 31 were at least as deep as the 14% we're sitting in today. 17 went deeper than 20%, another stopped right at 20%, and 7 went deeper than 30%.
Some of them were brutal. The 2015 to 2017 bull had 13 separate pullbacks of more than 10%, and 5 of them were deeper than 30%, including two of about 35% in the summer of 2017, right in the middle of the run-up to $19,000.
The 2018 to 2021 bull had the deepest of all: 62% from June 2019 to March 2020, and then 53% from April to July 2021, both inside what was still a bull market.
And they take time. The typical pullback took about 41 days to get from its high back to a new one. But there were 16 separate stretches of 49 days or more without a new high, and the longest in each bull lasted 169, 484 and 238 days.
7 weeks without a new high is ordinary. If anything, the surprise would be a bull market that never had a stretch like this.
The 2024 Template
The most recent bull is probably the best template for how this one might feel.
From the November 2022 low to the October 2025 high, Bitcoin rose about 7.9x over 1,050 days. It still had 8 pullbacks of more than 10%, the deepest about 28% from January to April 2025.
But the one I really want to point you at is 2024.
View live in OCM Studio: Bull Market Drawdowns (5Y)
Bitcoin closed at about $73,000 on the 13th March 2024, and it didn't close above that level again until the 6th November, 238 days later.
In between, it fell about 26%, down to around $54,000 in September.
I remember that period well. The mood was very similar to the one we're seeing now: the top was in, the cycle was broken, the ETF buyers were done. Then Bitcoin went on to almost double from that September low within 4 months.
Anyone who gave up on the bull that summer sold close to the bottom of the pullback, not the top of the bull.
Today Against History
So where does this cycle sit?
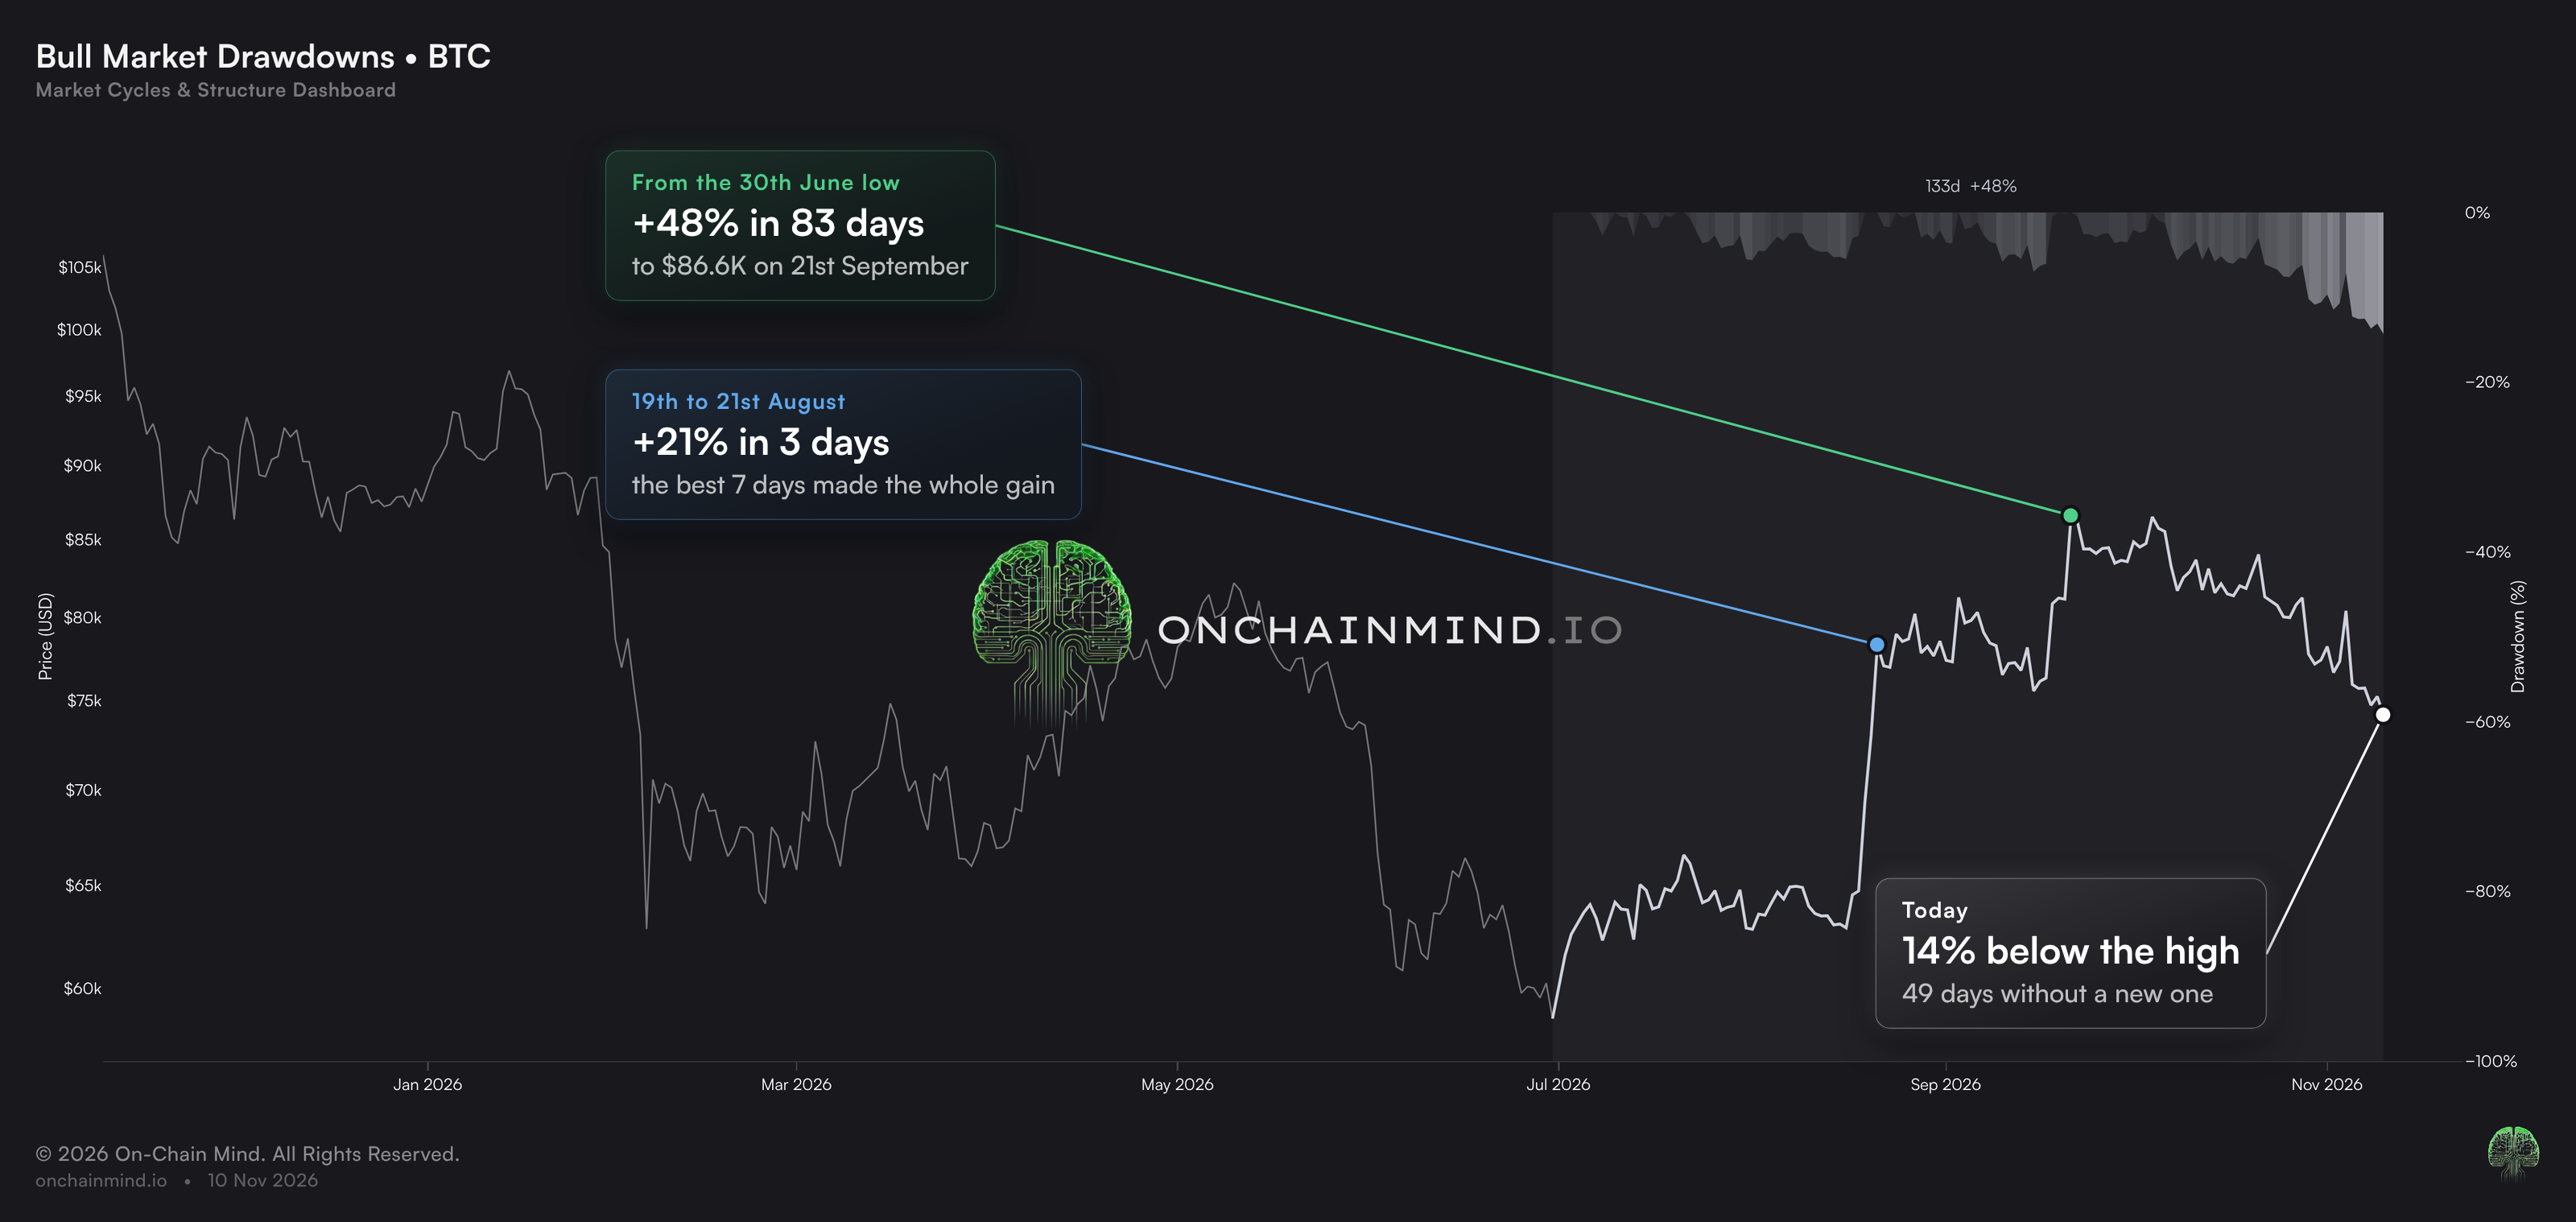
From the 30th June low at about $58,600, price rose about 48% in 83 days to around $86,600 on the 21st September. Since then it has drifted back to around $74,000, a pullback of about 14%, with no new high for 49 days.
View live in OCM Studio: Bull Market Drawdowns (1Y)
Even this cycle's rally played out like the ones before it. Three days in August, the 19th to the 21st, added roughly 21% on their own, and the best seven days of the whole run from the June low to the September high delivered all of its gains. Miss those few days and you missed the move.
But here's the comparison I found most interesting in all of this.
This bull market is now about 130 days old, and its worst pullback so far is about 14%. By the same age:
2015: the bull had already suffered a 26% pullback
2018: about 18%
2022: about 19%
This cycle's pullback is shallower than any of the last three bulls at the same point in its life. So far, this bull has been gentler on its holders than any of the three before it, not harsher.
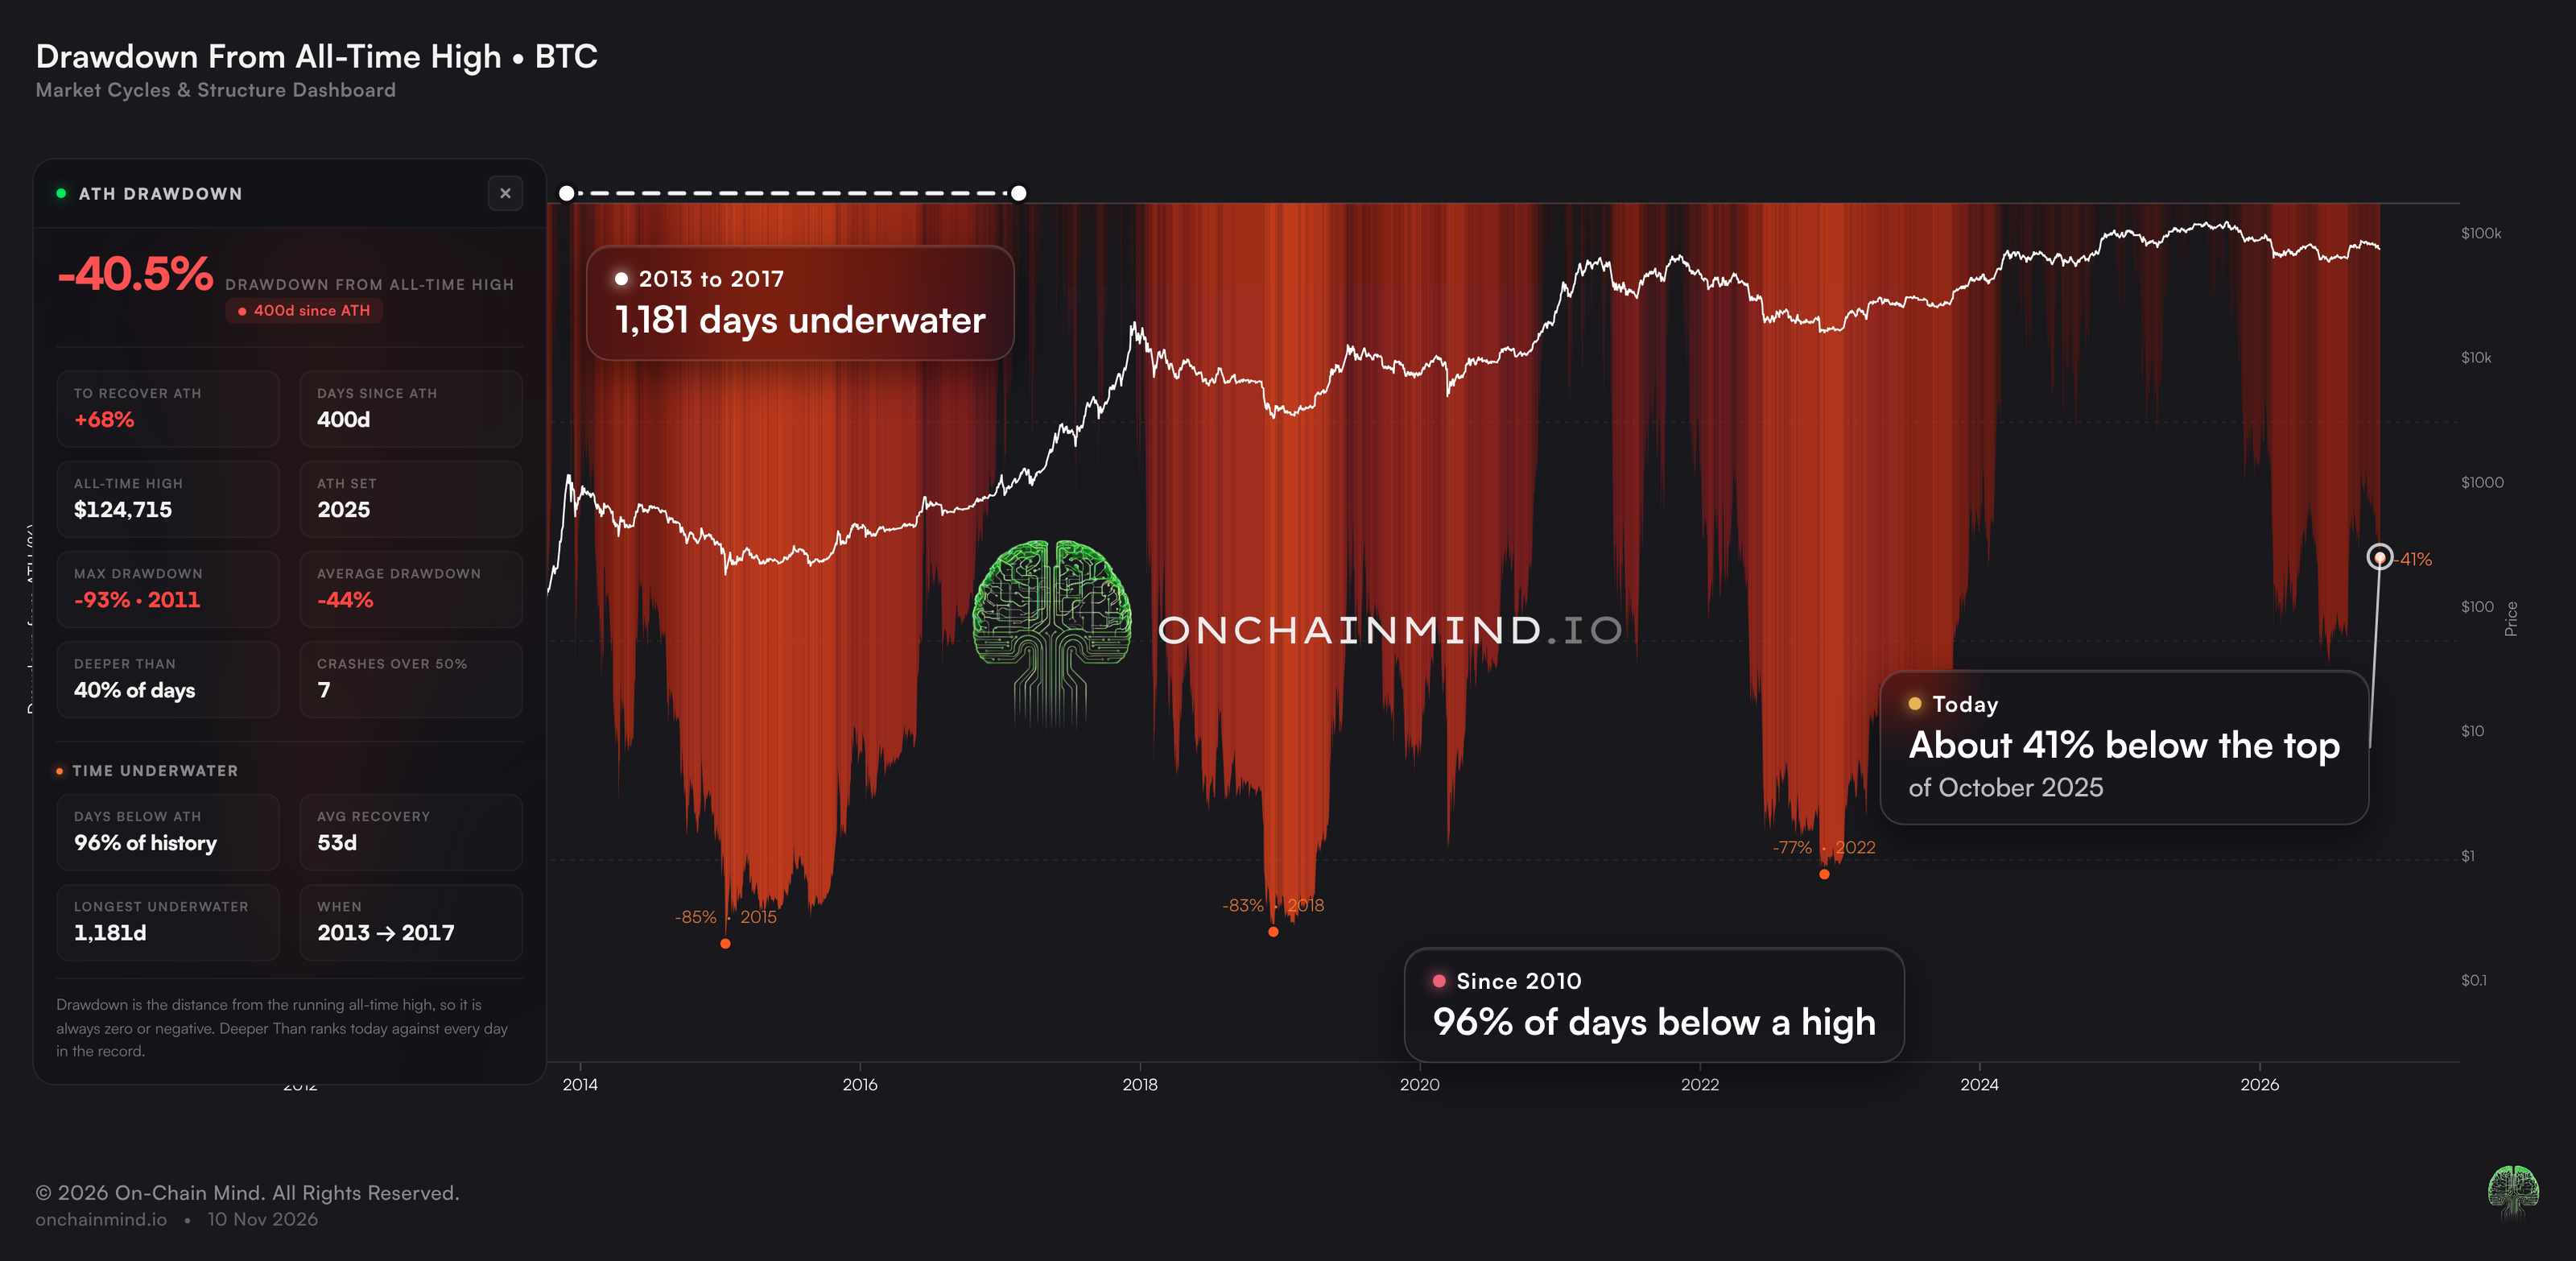
This next chart, the ATH Drawdown, makes the same point on a much bigger scale. Bitcoin is still currently about 41% below its all-time high from October 2025.
But over its entire history, Bitcoin has spent 96% of its days below its previous all-time high, with the longest stretch underwater lasting 1,181 days, from 2013 to 2017.
View live in OCM Studio: Drawdown From All-Time High
So really, going up is the exception and waiting is the normal state of the market, and that's as true in bull markets as it is in bear markets.
Hold the Region, Keep the Bull
So the data says this pullback is normal. What would actually worry me?
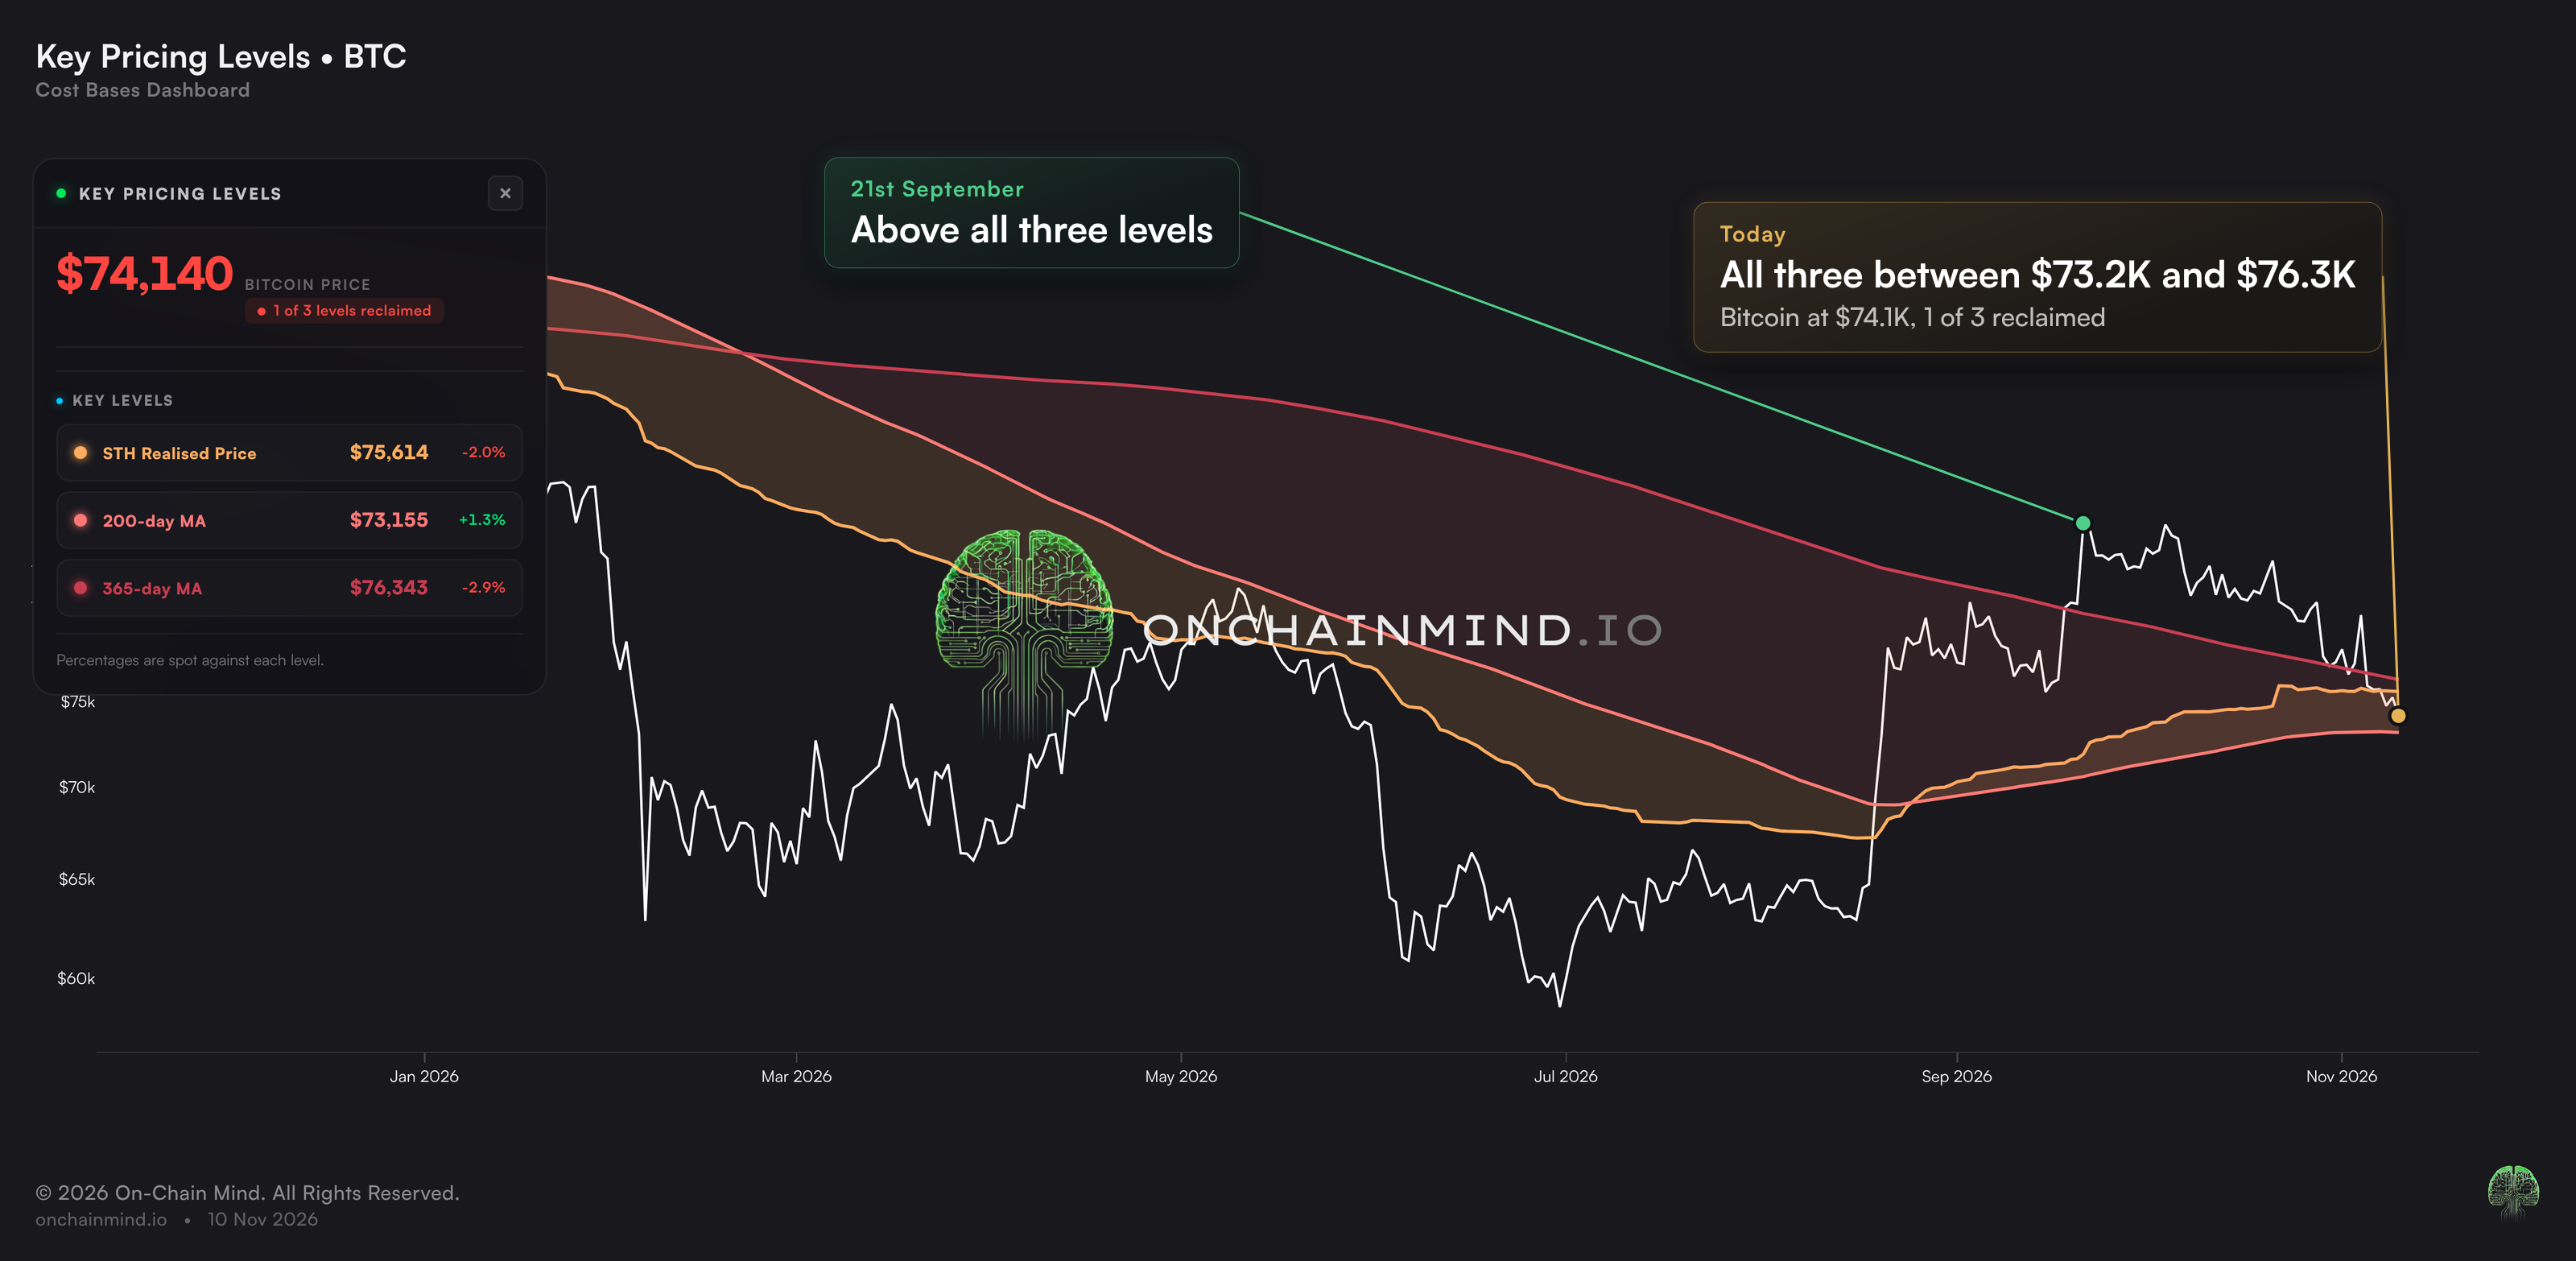
There are three key pricing levels I've been tracking all cycle on our Cost Bases dashboard:
The short-term holder realised price: the average cost basis of newer buyers, now $75,614
The 200-day moving average: $73,155
The 365-day moving average: $76,343
My rule is simple. Above all three convincingly, the bull market is on. Below all three convincingly, the bear market is likely back.
View live in OCM Studio: Key Pricing Levels
Back in September, price sat convincingly above all three, and my base case was a retest of this tight cluster before another break higher. When we recorded our podcast with James Check a few weeks ago, with Bitcoin at about $84,000, I said I'd be perfectly happy with another $10,000 drop to retest these levels, and that it was probably pretty likely.
Here we are. At around $74,100, Bitcoin sits just above the 200-day average and just below the other two, with all three packed between about $73,200 and $76,300.
That's exactly what we'd expect, because Bitcoin doesn't go up in a straight line. It extends, then it retests. It does the same in a bear market too, where these levels tend to act as resistance on the way down rather than support on the way up.
So I'm prepared for both sides.
If Bitcoin loses all three and stays convincingly below them, then by my own rule bearish price action is back to being my base case, however normal this drawdown looks next to past bulls. A 14% pullback is normal. A pullback that takes out all three levels and holds below them is a different story.
If price holds this region, and I mean the region, not one exact price, then this goes down as one more ordinary retest in a very long list of them.
Bull markets feel far worse from the inside than they look on the chart. Bitcoin closes at a new high on about 1 day in 10, most of the gains come from a handful of days, and every bull has been full of pullbacks deeper than this one.
Now it's down to the levels.
Hold the region, keep the bull.
Got a question for next week’s Q&A? Send it to Tom with the question box at the end of the article.