

On 30th October I wrote down the line that would change my mind:
"If Bitcoin loses all three key pricing levels as support, on closes rather than intraday wicks, I'll stop treating this as a pause in an uptrend and expect more time-based pain."
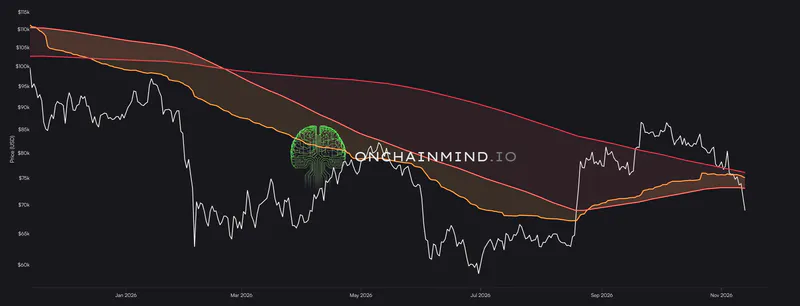
Yesterday, Bitcoin closed below all three. Today it is trading around $69K.
So the test is live. The easy reactions are to panic or to explain it away, and I don't want to do either. I want to read it properly, and the data has given me a lot to work with.
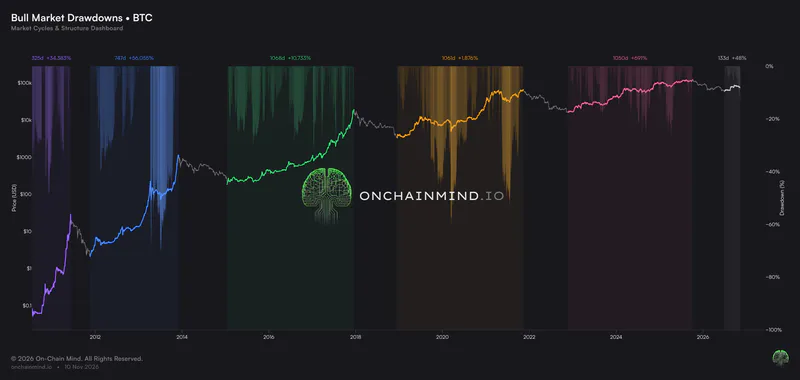
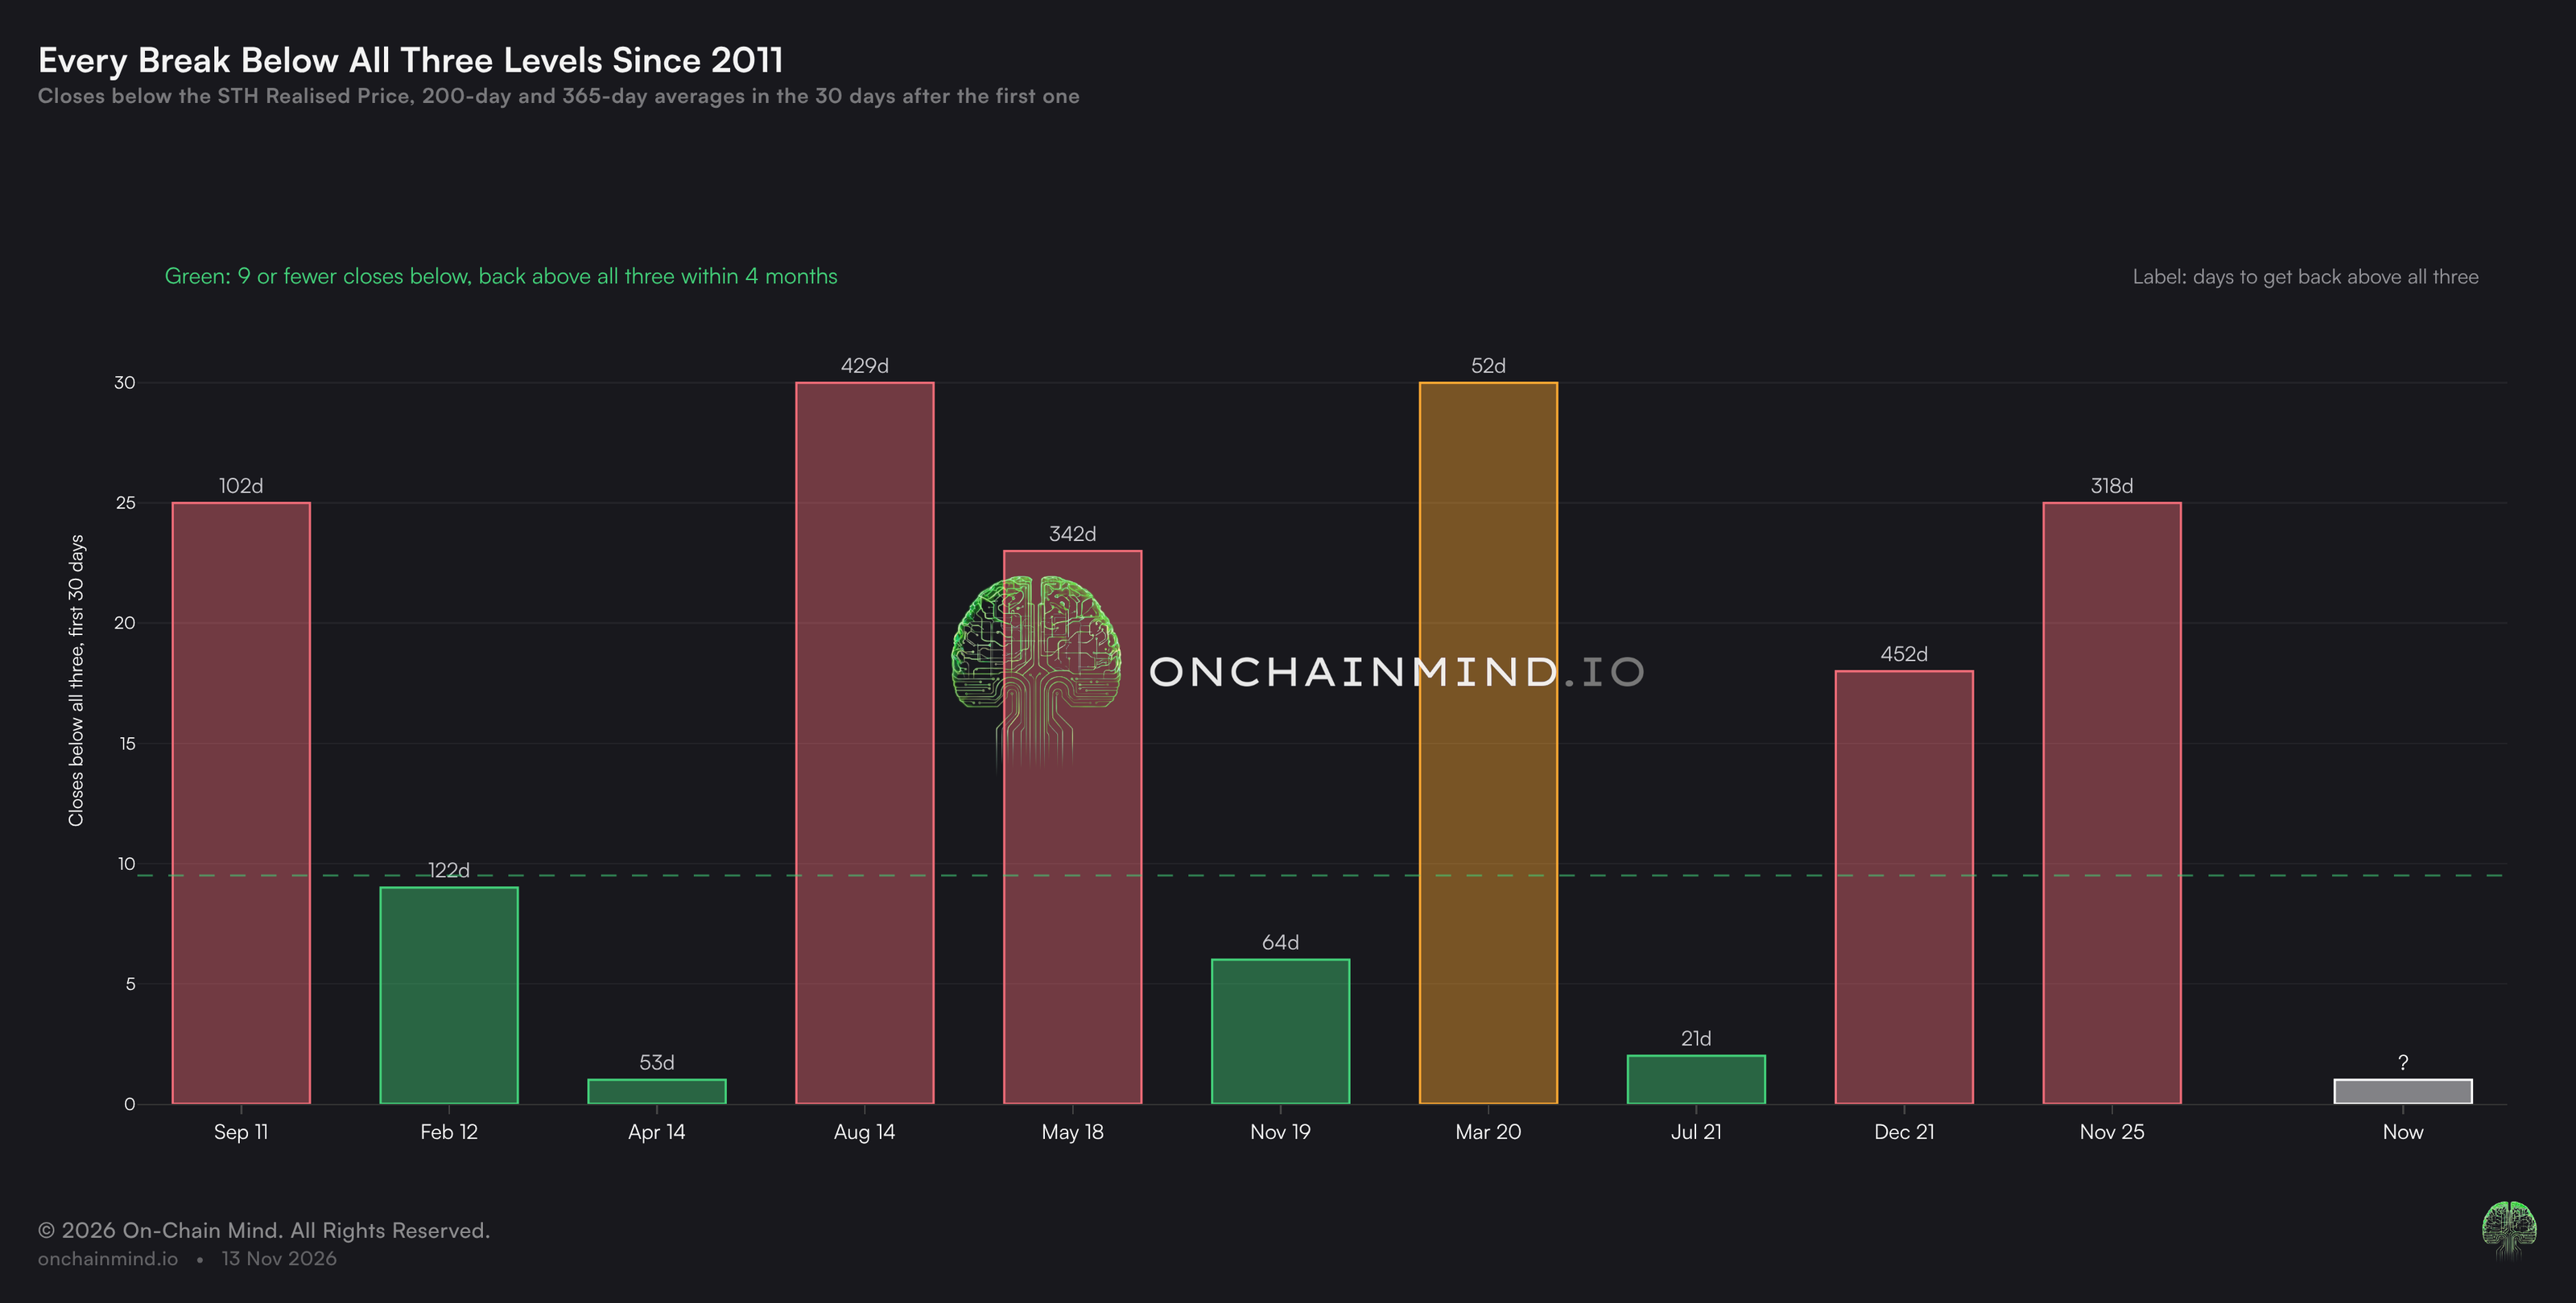
I went back through every break below all three lines since 2011. There have been ten. Six were scares that passed within a few months, and four turned into longer bearish stretches.
Then there's the question everyone is asking: where is the next floor? The answer isn't on a moving average. It's in the map of where the coins were actually bought. The coins below today's price and the coins above it belong to two very different kinds of holder, and that changes how I expect the next few weeks to play out.
I'll finish with what the Omega Score is telling us, and exactly how I'm deploying into this pullback.
Let's get into it.
Key insights
Below All Three: Bitcoin closed under the STH Realised Price, the 200-day and the 365-day yesterday, the first close below all three since 18th August.
Ten Breaks Since 2011: Six recovered within about four months. The other four took 10 to 15 months to get back above.
The 30-Day Tell: One simple count in the first month after a break has separated the quick recoveries from the long bear markets.
Two Kinds of Holder: The coins below price and the coins above it tell very different stories, and that tells you where the likely floor is.
Below All Three
We've covered these three lines many times, so I'll keep this short. The STH Realised Price is the break-even point for newer buyers, and the 200-day and 365-day averages are the medium and long-term trend of price.
Above all three, bullish price action is on. Below all three, the bearish action is likely back.
View live in OCM Studio: Key Pricing Levels
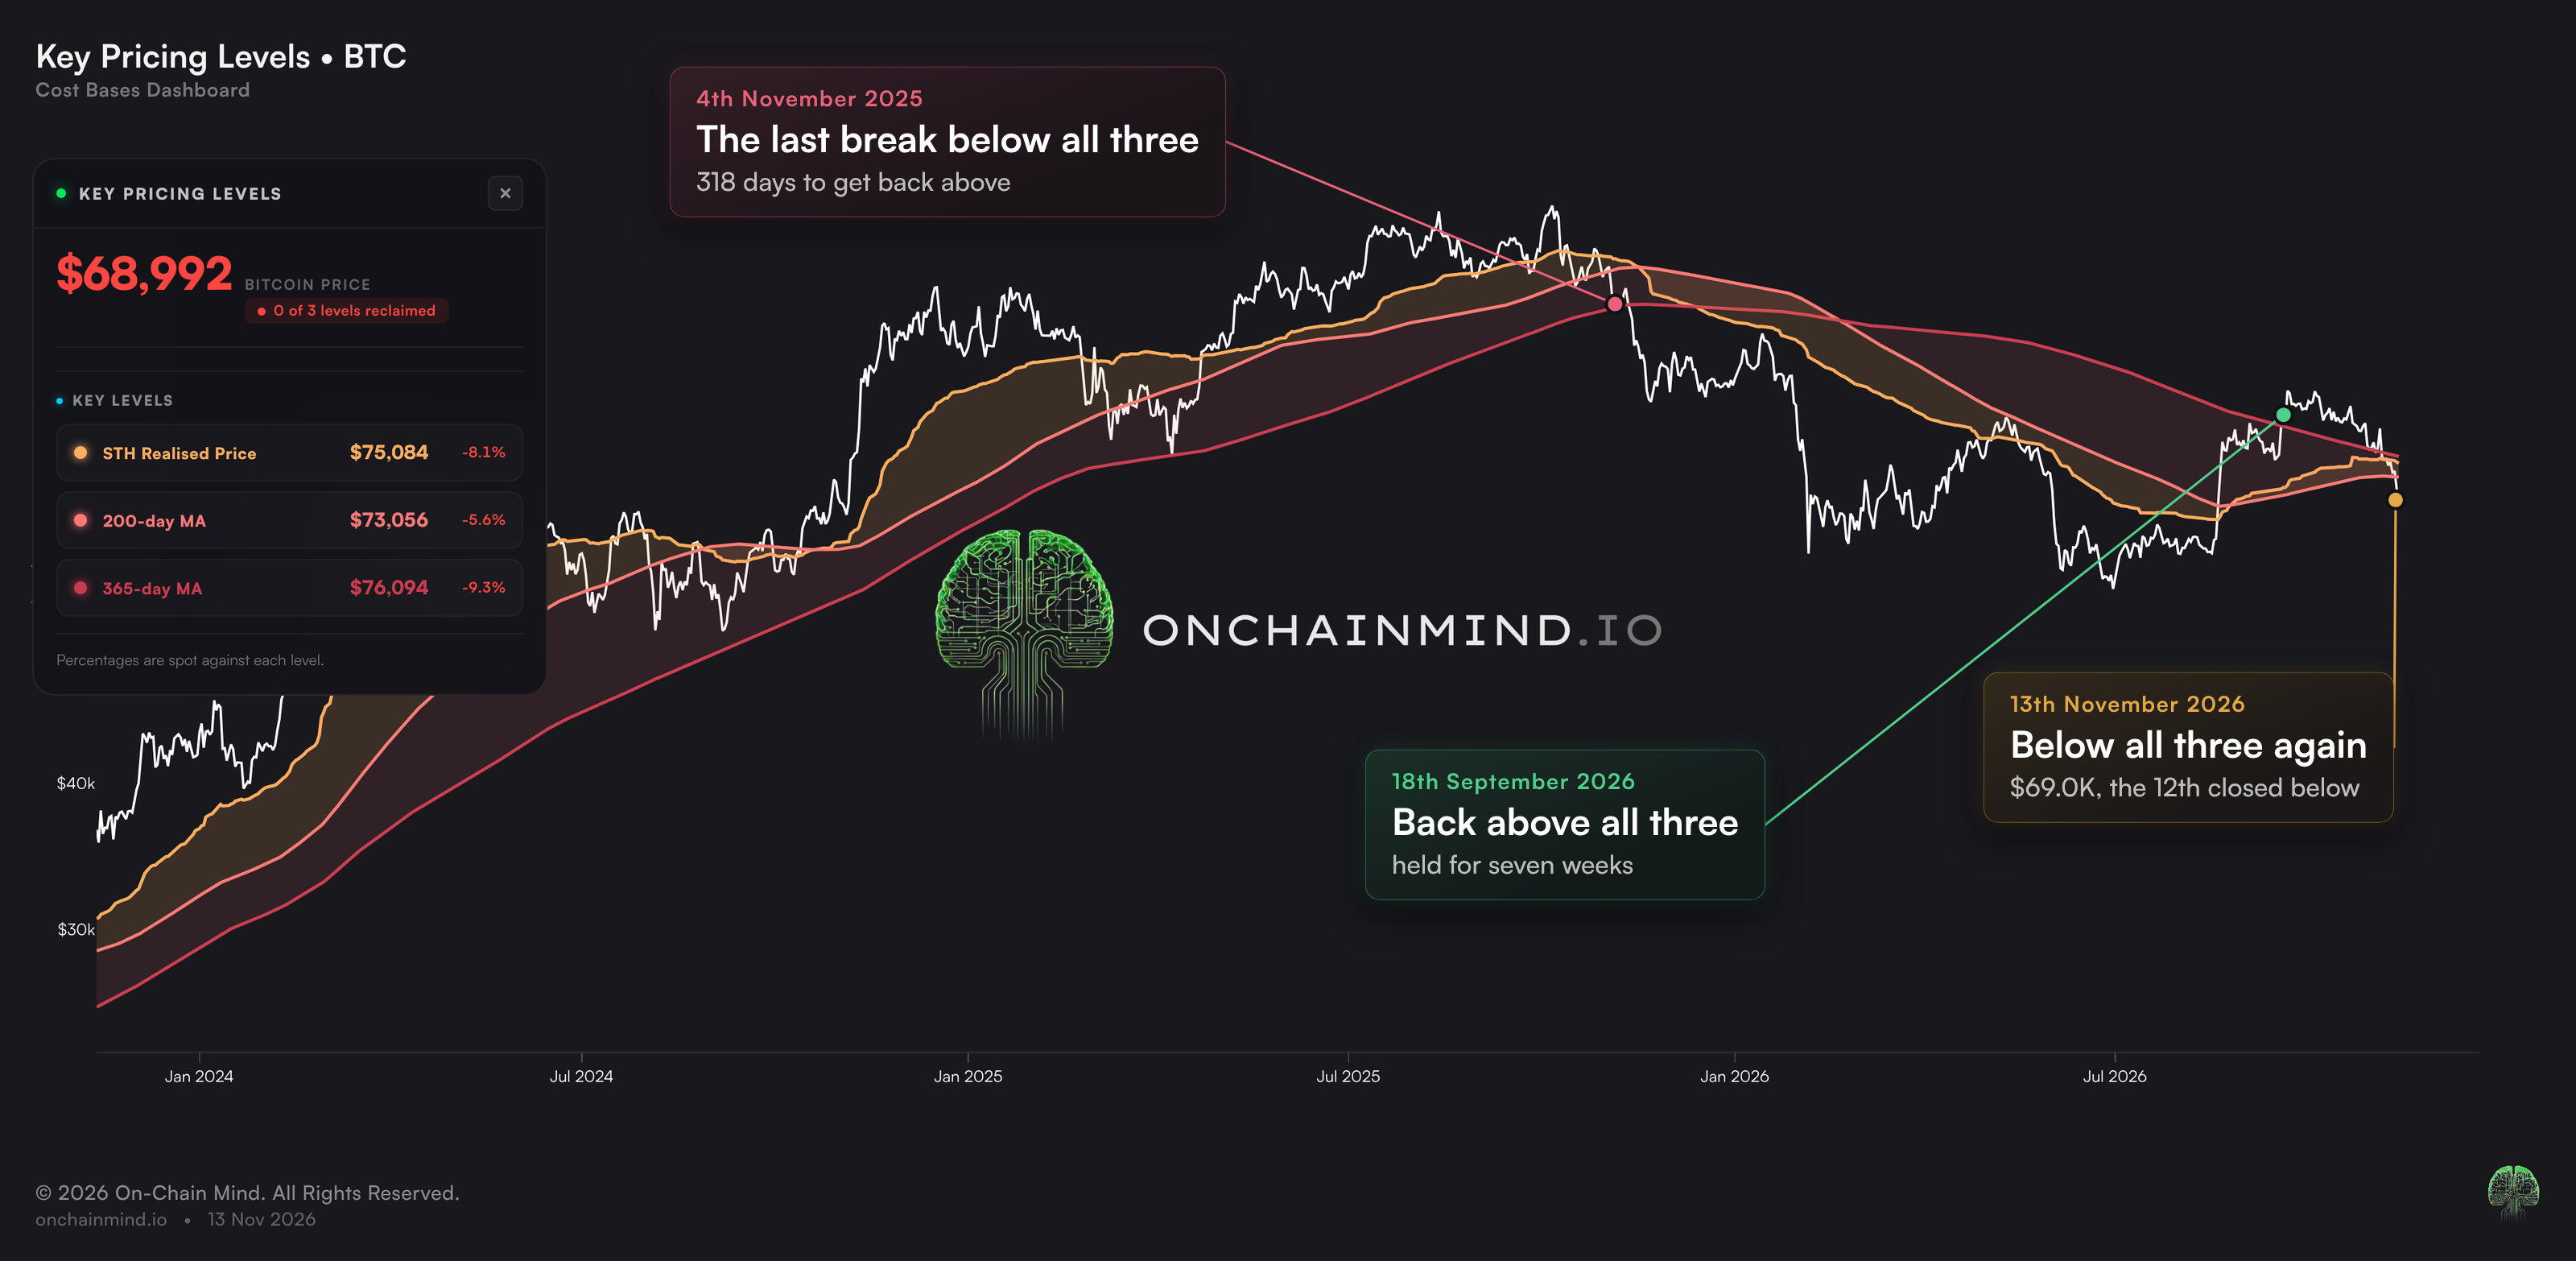
Bitcoin got back above all three on 18th September, after 318 days below them, and held there for seven weeks. Now it is under all three again: the STH Realised Price at $75.1K, the 200-day at $73.1K and the 365-day at $76.1K.
Price needs to rise about 10% to get back above the highest of them.
Every Break Since 2011
Using daily closes, I found every time Bitcoin closed below all three lines after having been above all three. There are ten earlier cases, from September 2011 to November 2025.
They split almost down the middle. Six were back above all three within about four months. The other four took 10-15 months, and those four line up with the long bear markets of 2014, 2018, 2022 and the one we've just come through.
So a break below all three is not a death sentence on its own. More often than not, it was a scare. The useful question is how to tell the two apart early, before the damage is done.
Next, I’ll show you where the on-chain floor sits, and why the holders below today’s price are so different from those trapped above it. Then there’s the surprising group selling into this fall, the ETF and Strategy buyers who are now underwater, and the levels I’m calling as the floor. I’ll finish with exactly how I’m deploying our own capital into this.
Continue reading with OCM Premium
You have been reading the free preview of this article. The rest of it (about 2,100 more words and 6 more charts) is for OCM Premium members. See OCM Premium plans.