

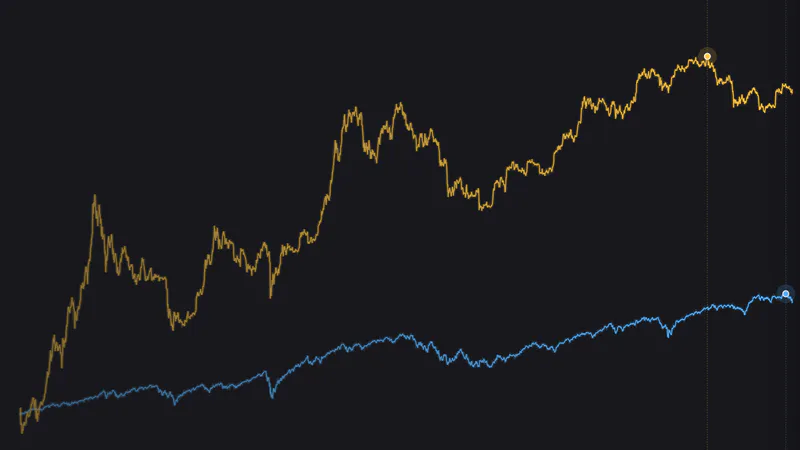
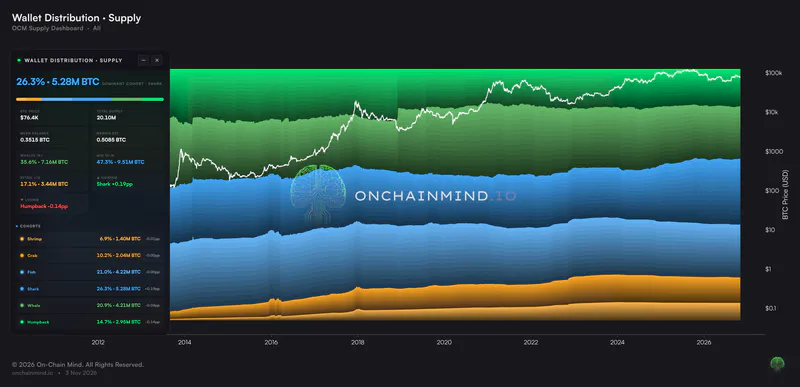
Almost 80% of every dollar ever invested in Bitcoin is now sitting at a loss.
Fear and Greed is at 12. Our X Sentiment reading is at the 4th percentile of its whole record. And almost $1.8 billion of long positions were wiped out in seven days.
By any reasonable measure, that is a capitulation.
But those numbers only tell you how bad it feels, not who actually sold, and a sell-off driven by long-term holders is a very different animal from one driven by recent buyers.
So I'm going to measure this sell-off in dollars rather than coins, show you exactly who gave up and who didn't, and then look at what history says happens next, over the next few months and over the next two years, because those are two very different answers.
Let's get into it.
Key insights
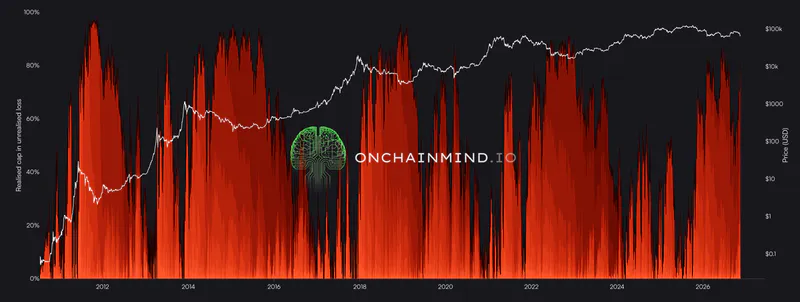
4 in 5 Dollars Underwater: 79.8% of all the money invested in Bitcoin is at a loss, up from 42.4% in September and close to the 87.3% of the June low.
Recent Buyers Sold: 73% of last week's $7.3 billion of realised losses came from coins held for under 6 months, while holders of 3 years and more barely changed their habits.
A Forced Flush: Almost $1.8 billion of longs were liquidated in a week, and about 75,600 BTC of open interest was closed out in three days.
Two Very Different Answers: From today's Omega Score, history gives one answer for the next 12 months and a very different one for the next 24.
Deeply Underwater
Most people measure capitulation in coins: how much of the supply is underwater. But nobody lies awake at night counting Satoshis (at least I don't think they do). They think about the $500 they put in that is now worth $350.
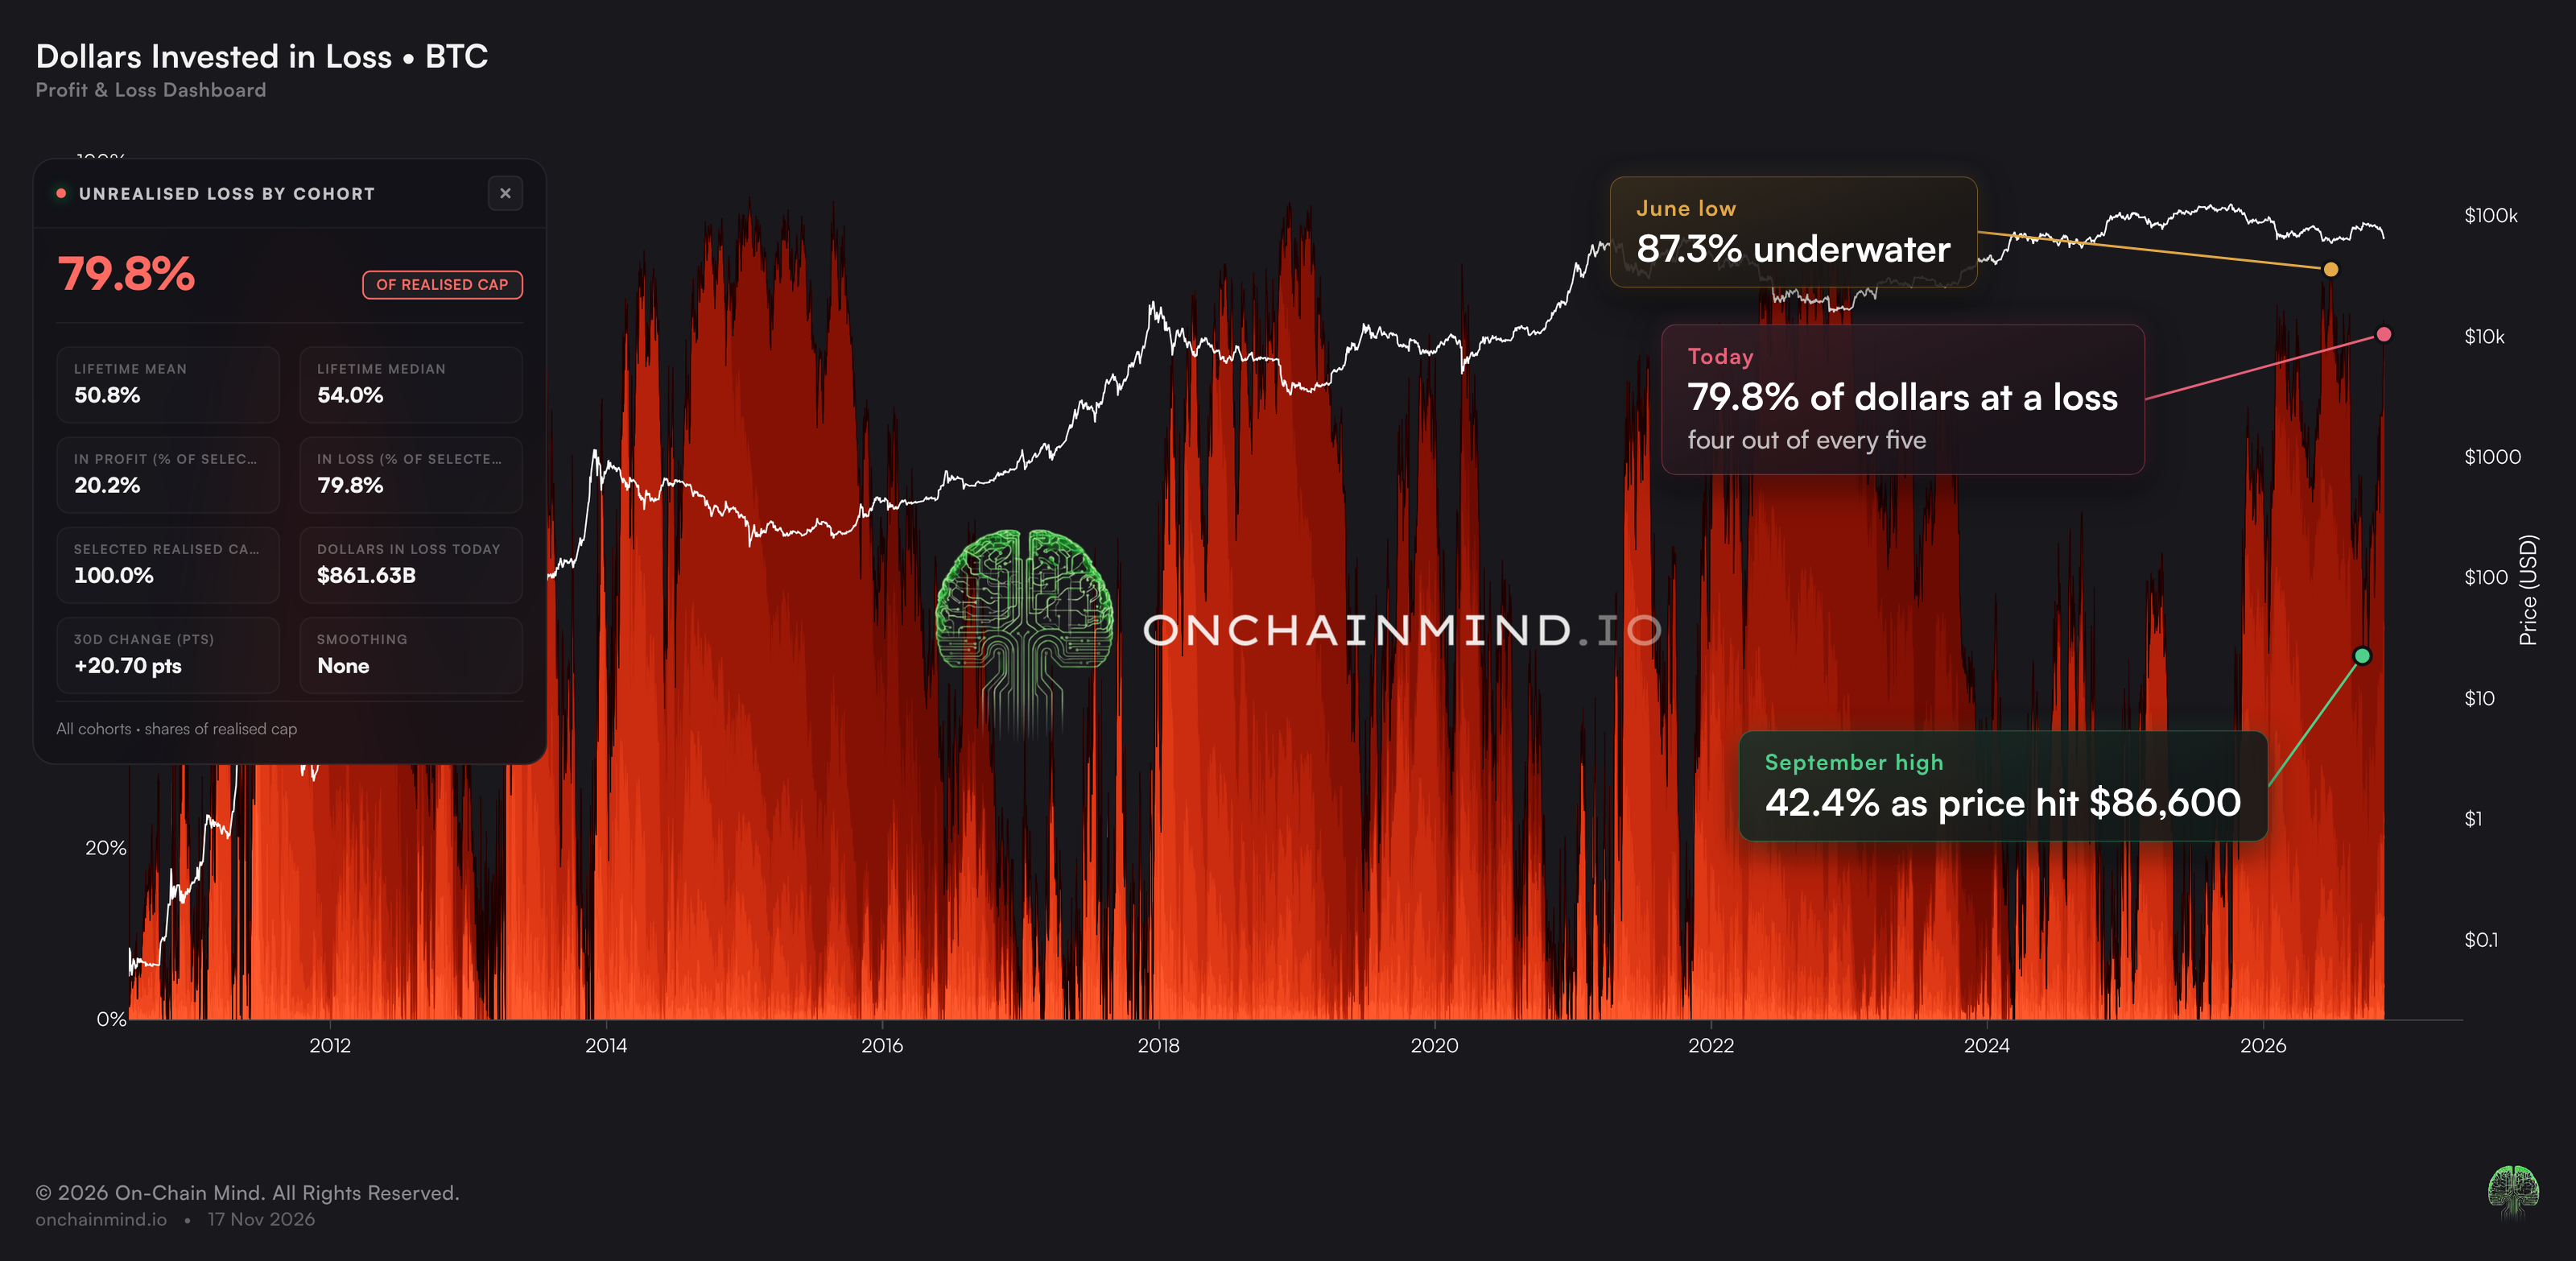
When we weight every coin by the price it last moved at, the idea behind the Realised Cap, we can see how much of the actual money invested in Bitcoin is underwater. Check it out:
View live in OCM Studio: Dollars Invested in Loss
Right now, that's 79.8%. Roughly four out of every five dollars ever put into Bitcoin are worth less today than when they went in.
At the June low, when Bitcoin closed at about $58.6K, it hit 87.3%. Then, as price rallied to about $86.6K in September, it fell to 42.4%, so more than half of all the money in Bitcoin was back in profit. In about two months, we've gone straight back to almost 80%.
Here's what it read at every major bottom in Bitcoin's history:
October 2011: 97.8%
January 2015: 95.9%
December 2018: 95.2%
March 2020: 88.1%
November 2022: 91.5%
When nearly everybody's dollars are underwater, that's historically where cycle bottoms have formed, though those extremes should get harder to reach over time: it's very difficult to put the dollars invested in 2015 into a loss today.
Across Bitcoin's entire history, less than one day in five has been worse than today.
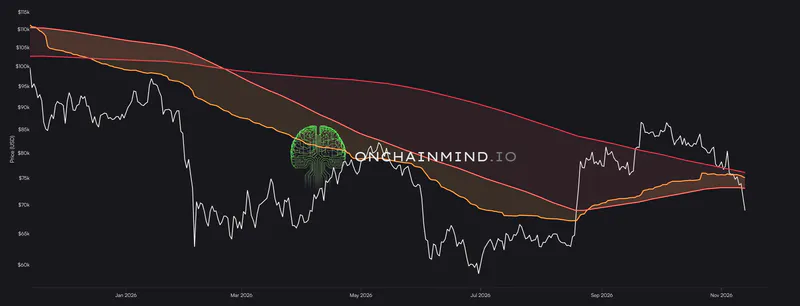
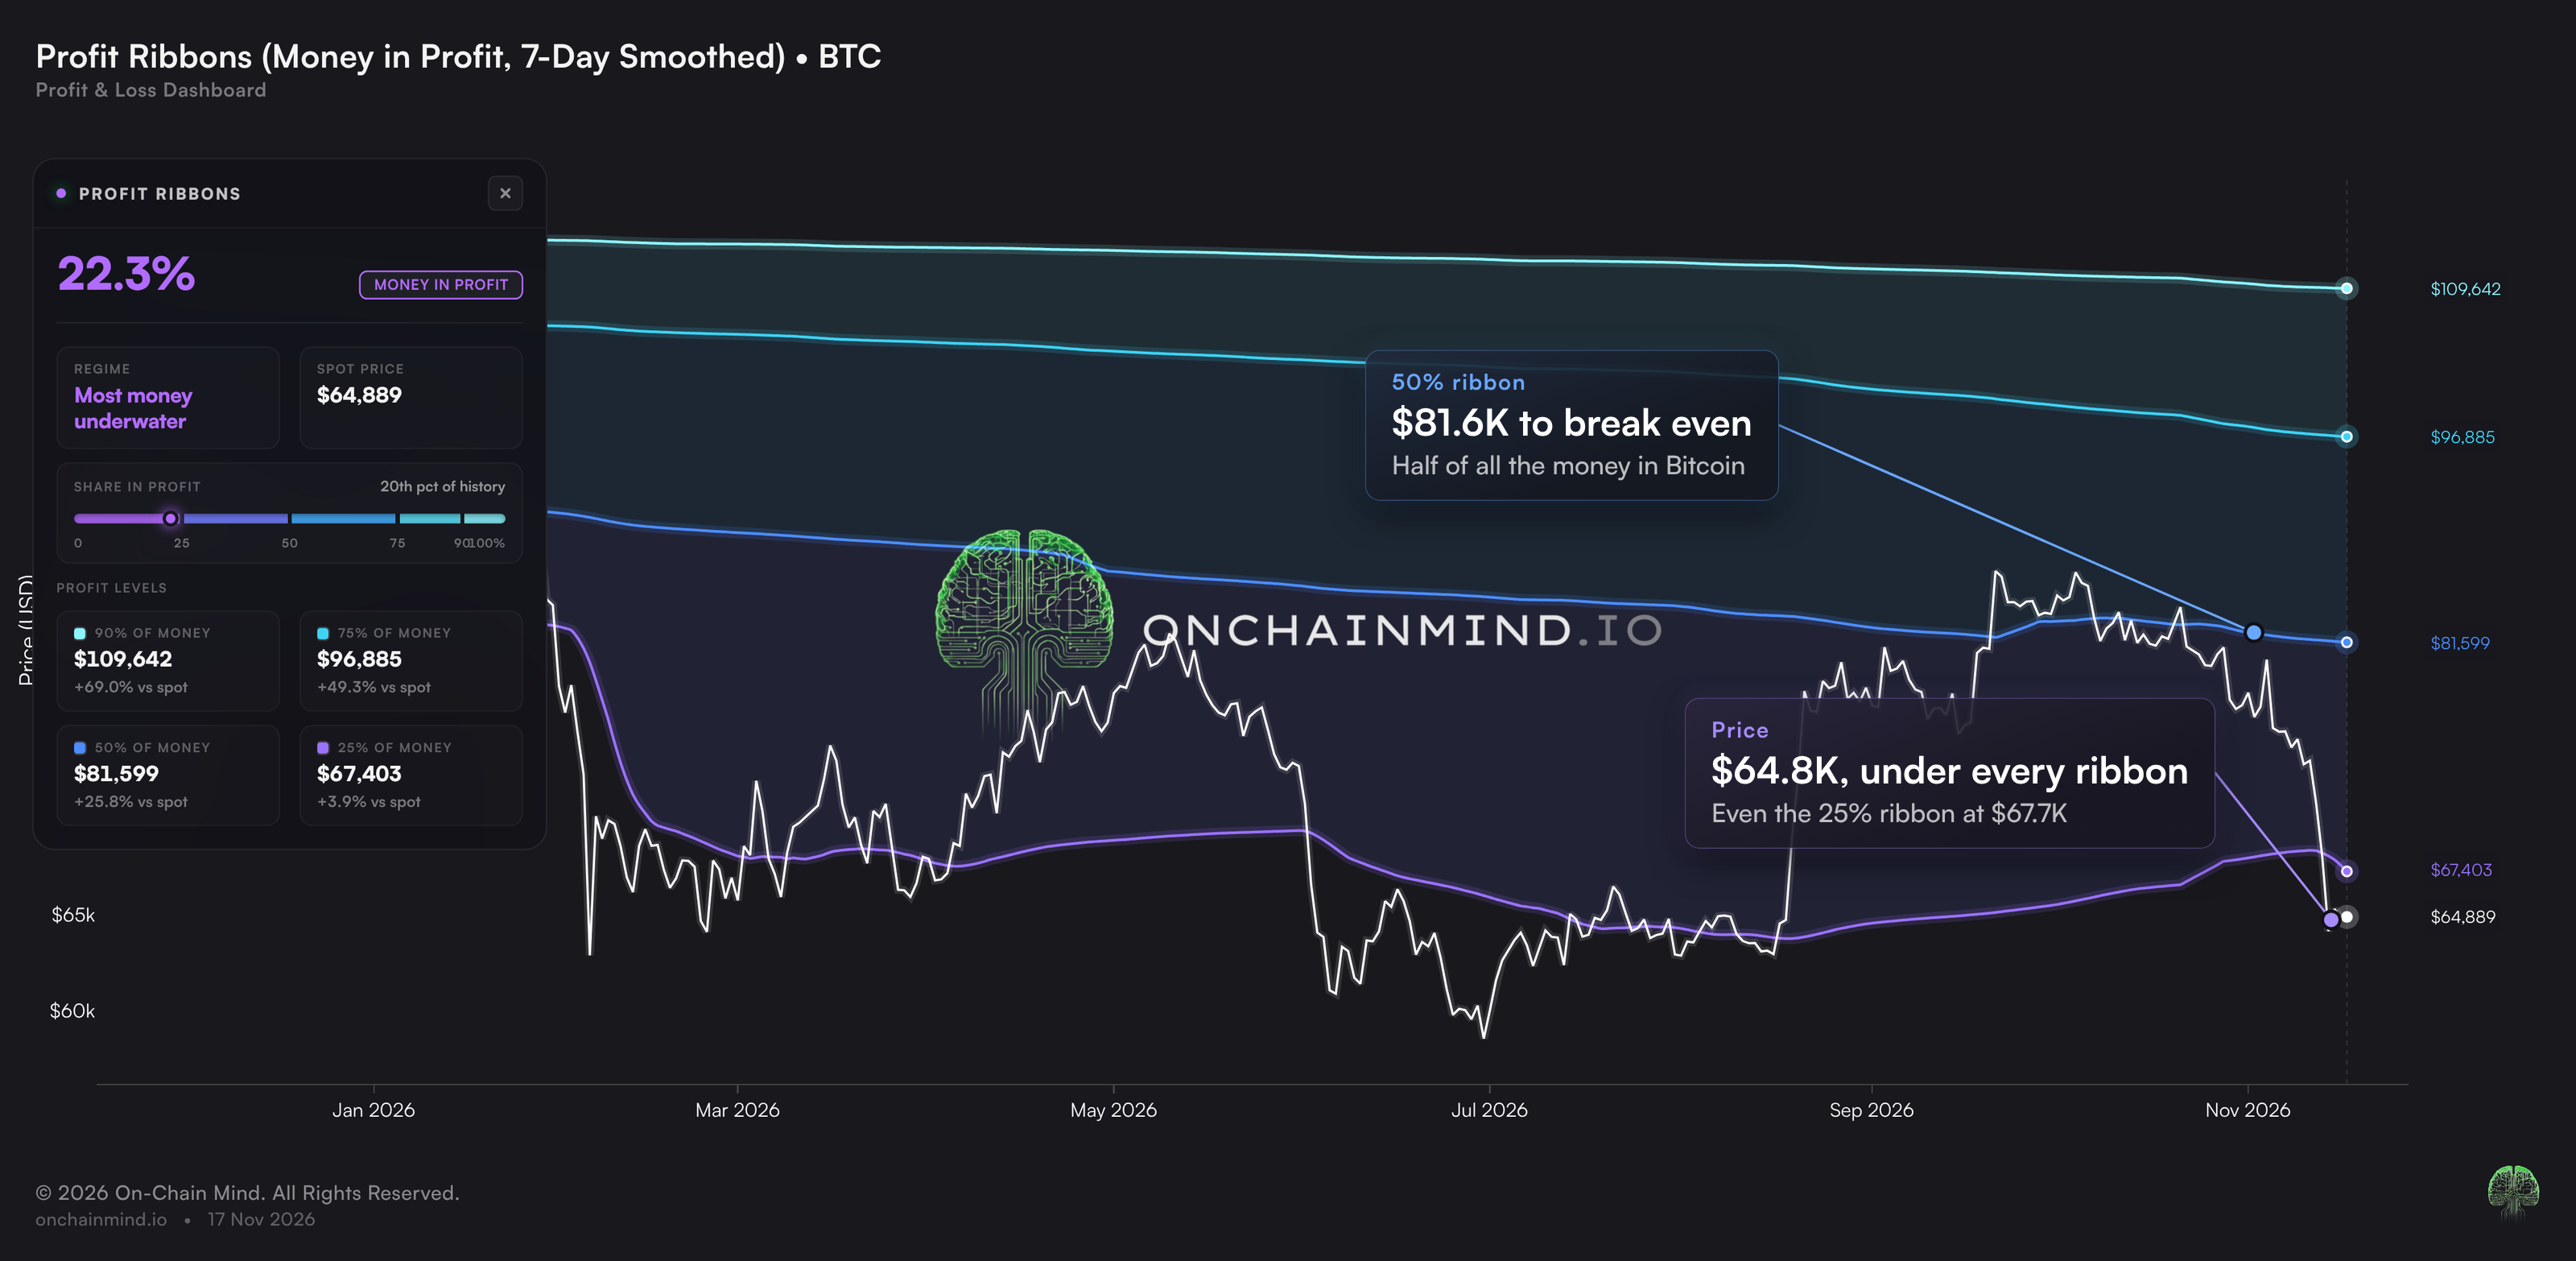
The other way to read the same thing is by price. The Profit Ribbons view shows the price at which a given share of all that money is back in profit. The one I'd focus on is the 50% ribbon at about $81.6K: the price where half of all the money ever put into Bitcoin gets back to break even.
View live in OCM Studio: Profit Ribbons
At about $64.8K, price sits around 21% below that line and would need to rise about 26% to reach it. That's a big wall of underwater holders, and many of them will be tempted to sell the moment they get their money back, which is why a ribbon like this tends to act as resistance on the way up.
Even the 25% ribbon, at about $67.7K, is above price right now. When price trades below every ribbon, the market is full of people waiting to get out at break even, and it usually takes time for those coins to change hands before a sustained move higher.
Who Actually Sold
Yesterday alone, the network realised $1.81 billion of losses: coins bought higher and sold lower by people who couldn't stomach it any more. Only 35 days in Bitcoin's entire history saw a bigger realised loss in dollar terms, the last of them in July.
Over the past week, $7.3 billion of losses were realised against only $1.5 billion of profit. That's a get-me-out-at-any-cost scramble for the exits.
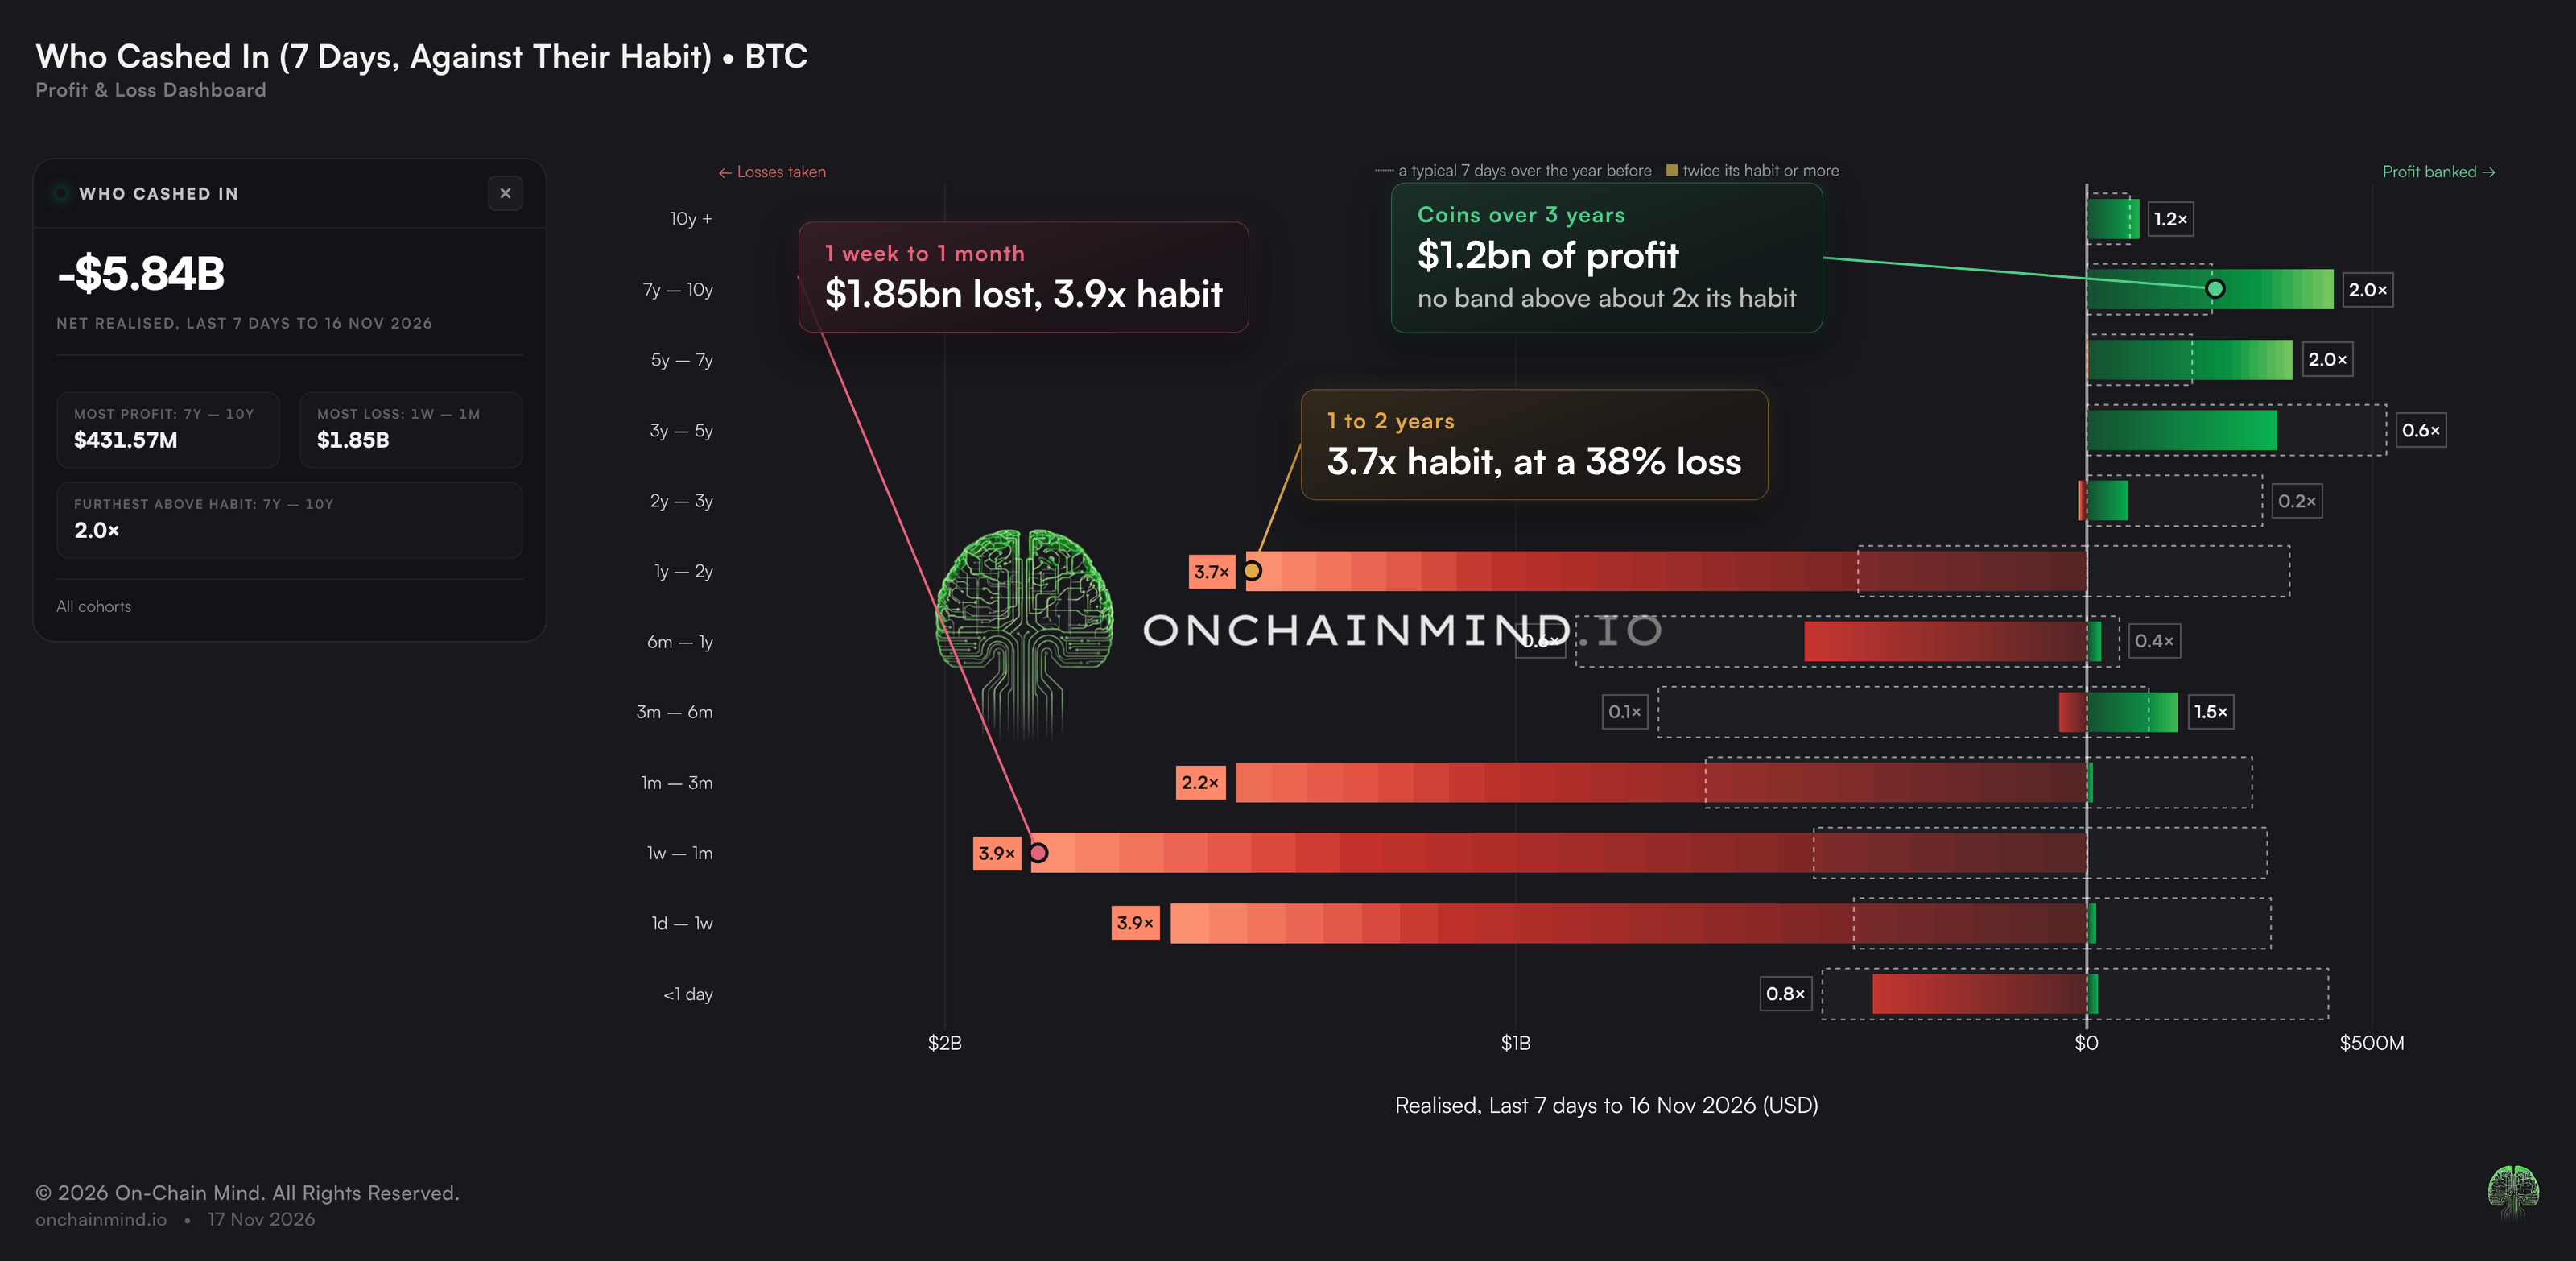
Our newer Who Cashed In view breaks all of that down by the age of the coins that moved, and it's very clear who did the selling. 73% of those losses, about $5.4 billion, came from coins held for less than six months. The single biggest group was the 1 week to 1 month band, with $1.85 billion of losses, and the coins that band sold yesterday went at an average loss of about 18%.
These are the rally chasers who jumped back in as Bitcoin ran from the high $50,000s into the mid $80,000s. I had plenty of messages once we broke $80,000 asking whether to get back in. Nobody was asking that at the lows.
The Against Their Habit mode (chart below) compares each band's selling with its typical 7 days over the year before.
View live in OCM Studio: Who Cashed In: Against Their Habit
Three groups stand out on the loss side:
1 day to 1 week: 3.9x its usual losses
1 week to 1 month: 3.9x
1 year to 2 years: 3.7x, about $1.47 billion of losses
That last group is the one I find most telling. Coins aged 1 to 2 years were bought roughly between November 2024 and November 2025, so a lot of them near the top. They held through more than a year underwater and are now finally giving up and taking a loss.
On the other side, coins older than three years took about $1.2 billion of profit over the same week, but none of those bands sold at more than about twice its usual pace, and the 3 to 5 year band sold well below its normal rate. Long-term holders aren't panicking; they're trickling out coins at a profit, as they always do.
So this isn't the smart money running for the exit. It's recent buyers and top buyers handing their coins to people who are willing to hold them.
Not All of It Was a Choice
As you'd expect with a drop this violent, some of this selling was forced.
At the worst of it, $620 million of long positions were liquidated in a single day, and only five days in the last 1,000 were bigger. Another $563 million went the next day as well.
Across the week, that's almost $1.8 billion of longs wiped out against about $360 million of shorts, roughly five times as many.
A liquidation is what happens when a trader borrows to make a bigger bet and the market moves against them far enough that the exchange closes the position for them.
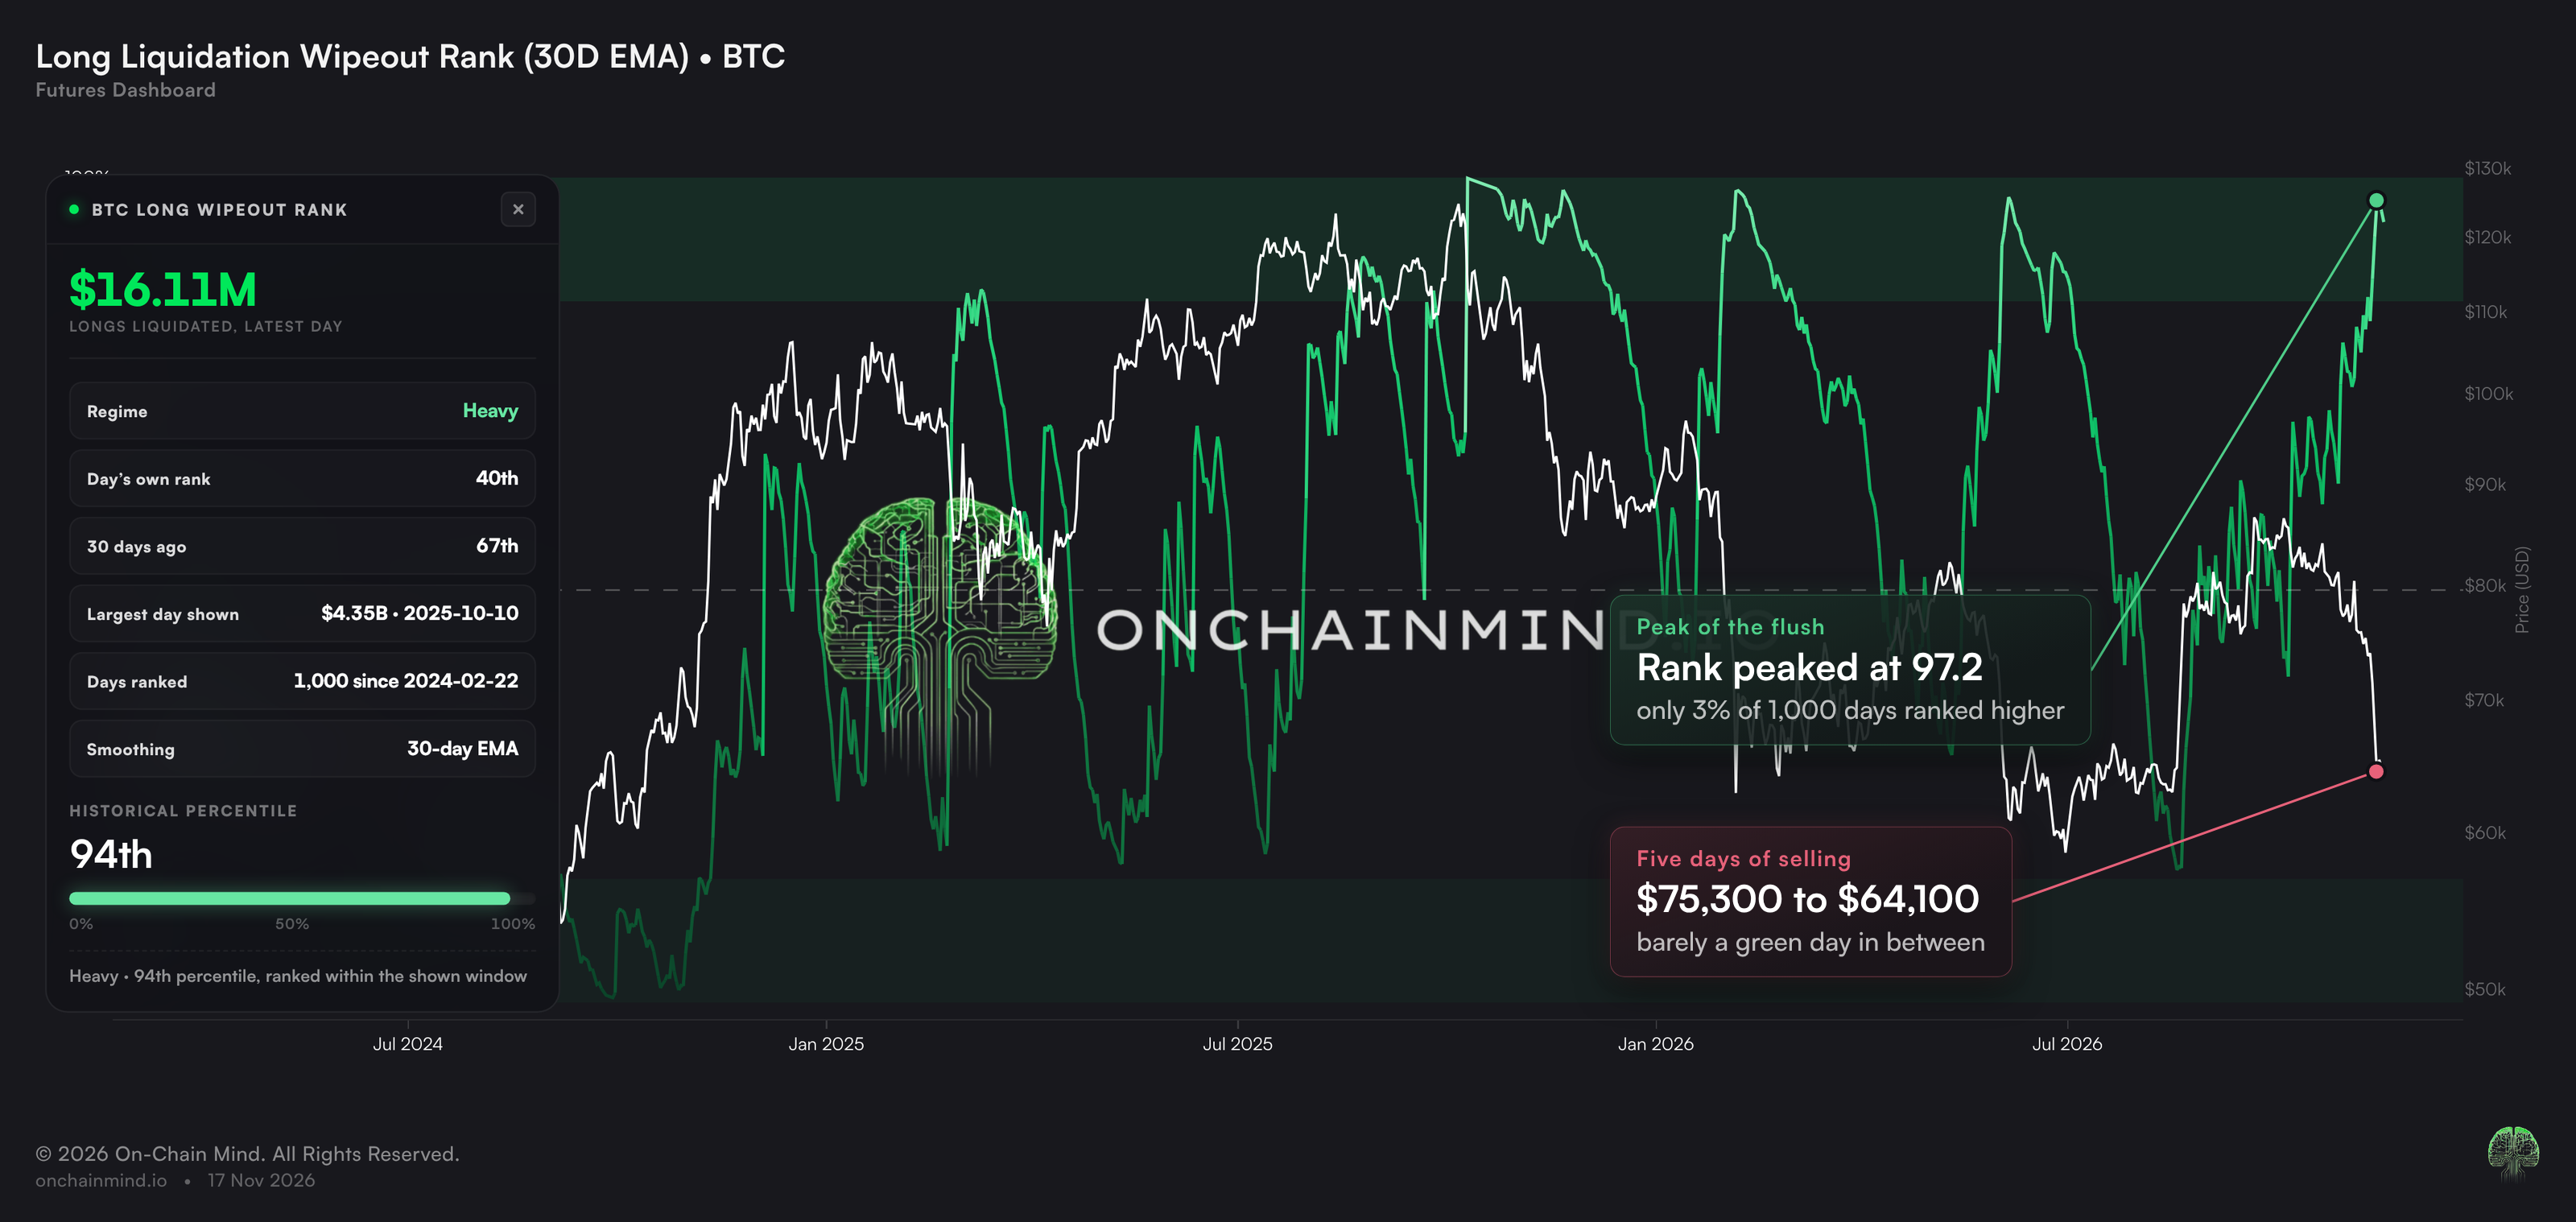
Each forced sale pushes price lower, which triggers the next one. Our new Wipeout Rank view puts each day's liquidations in context by ranking them against every day in the window on screen, so you can see how unusual a flush really is.
View live in OCM Studio: Long Liquidation Wipeout Rank
On the long side, the 30-day reading peaked at 97, which means that only about 3% of the last 1,000 days ranked higher.
What stands out is how it played out. Price fell from about $75.3K to about $64.1K in five days, with barely a green day in between. When price falls in a straight line with no relief bounce, it almost always means forced selling.
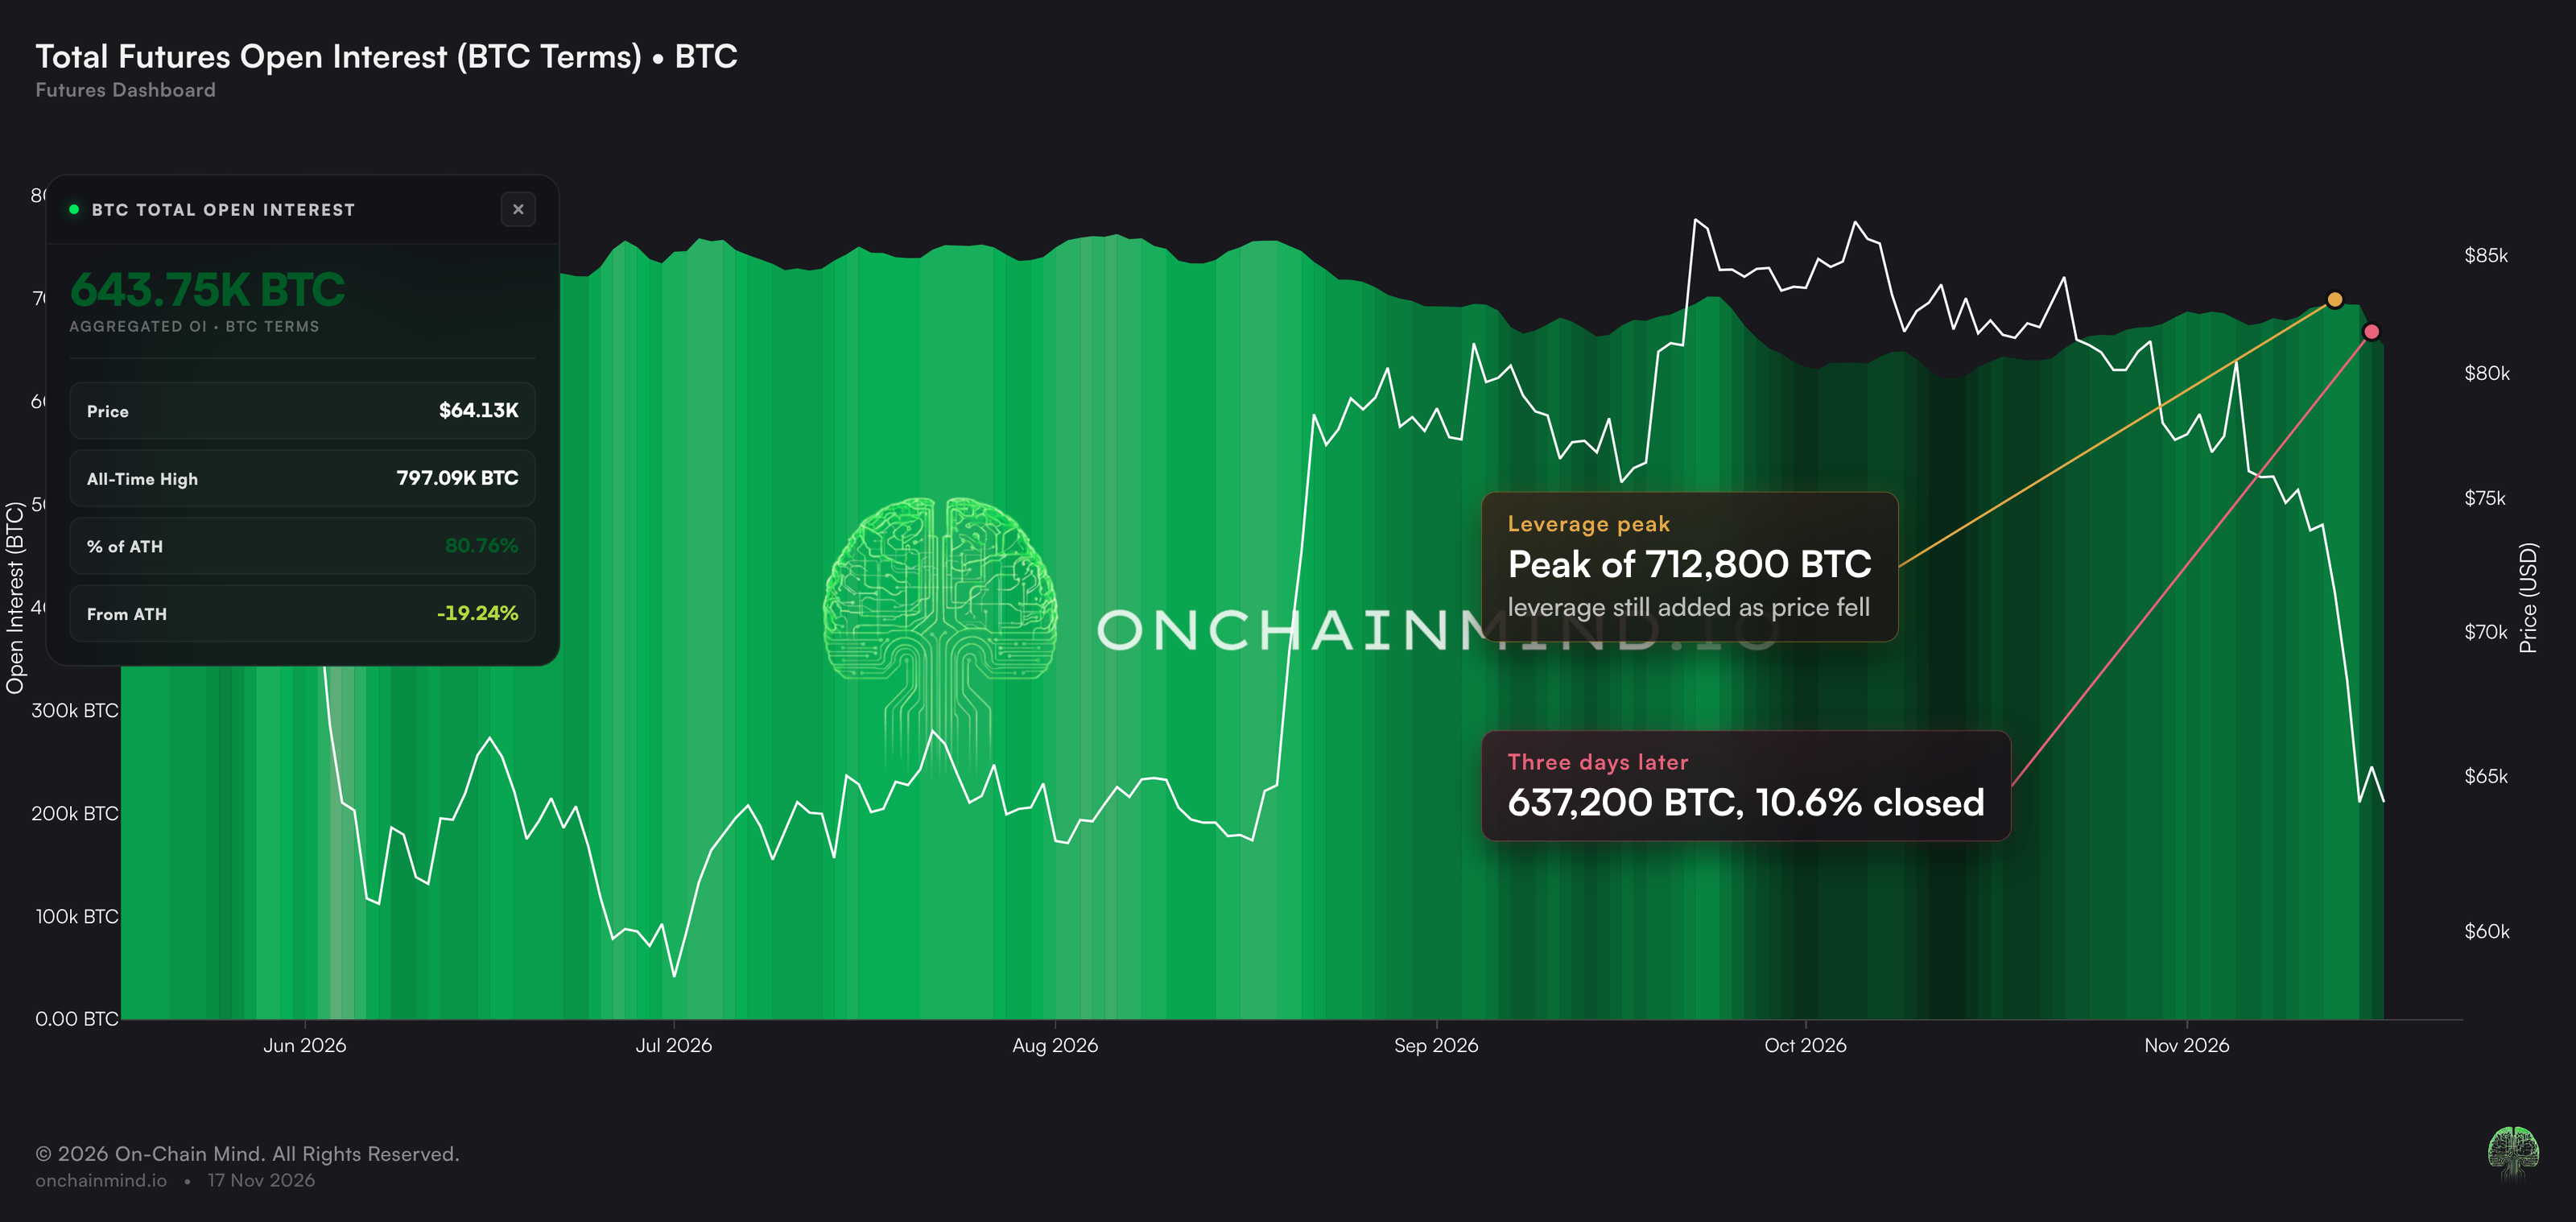
You can see the result in open interest, shown here in Bitcoin rather than dollars, because in dollars it falls simply because price falls.
View live in OCM Studio: Total Futures Open Interest (BTC)
Open interest is the total size of all the futures positions that are still open. It kept climbing into the sell-off, from about 676,400 BTC to a peak of about 712,800 BTC, so traders were still adding leverage as price fell.
Since that peak it has dropped to about 637,200 BTC. That's 10.6% of all open positions, about 75,600 BTC, closed out in three days. A flush like this is painful, but it also clears out a lot of the leverage that was making the market fragile.
As Fearful as It Gets
The famous Fear and Greed Index is at 12 today, and it touched 10 over the weekend, firmly in extreme fear. The last time it was this low was straight after the June low. Since February 2018, it has been at 12 or lower on only 4.7% of days.
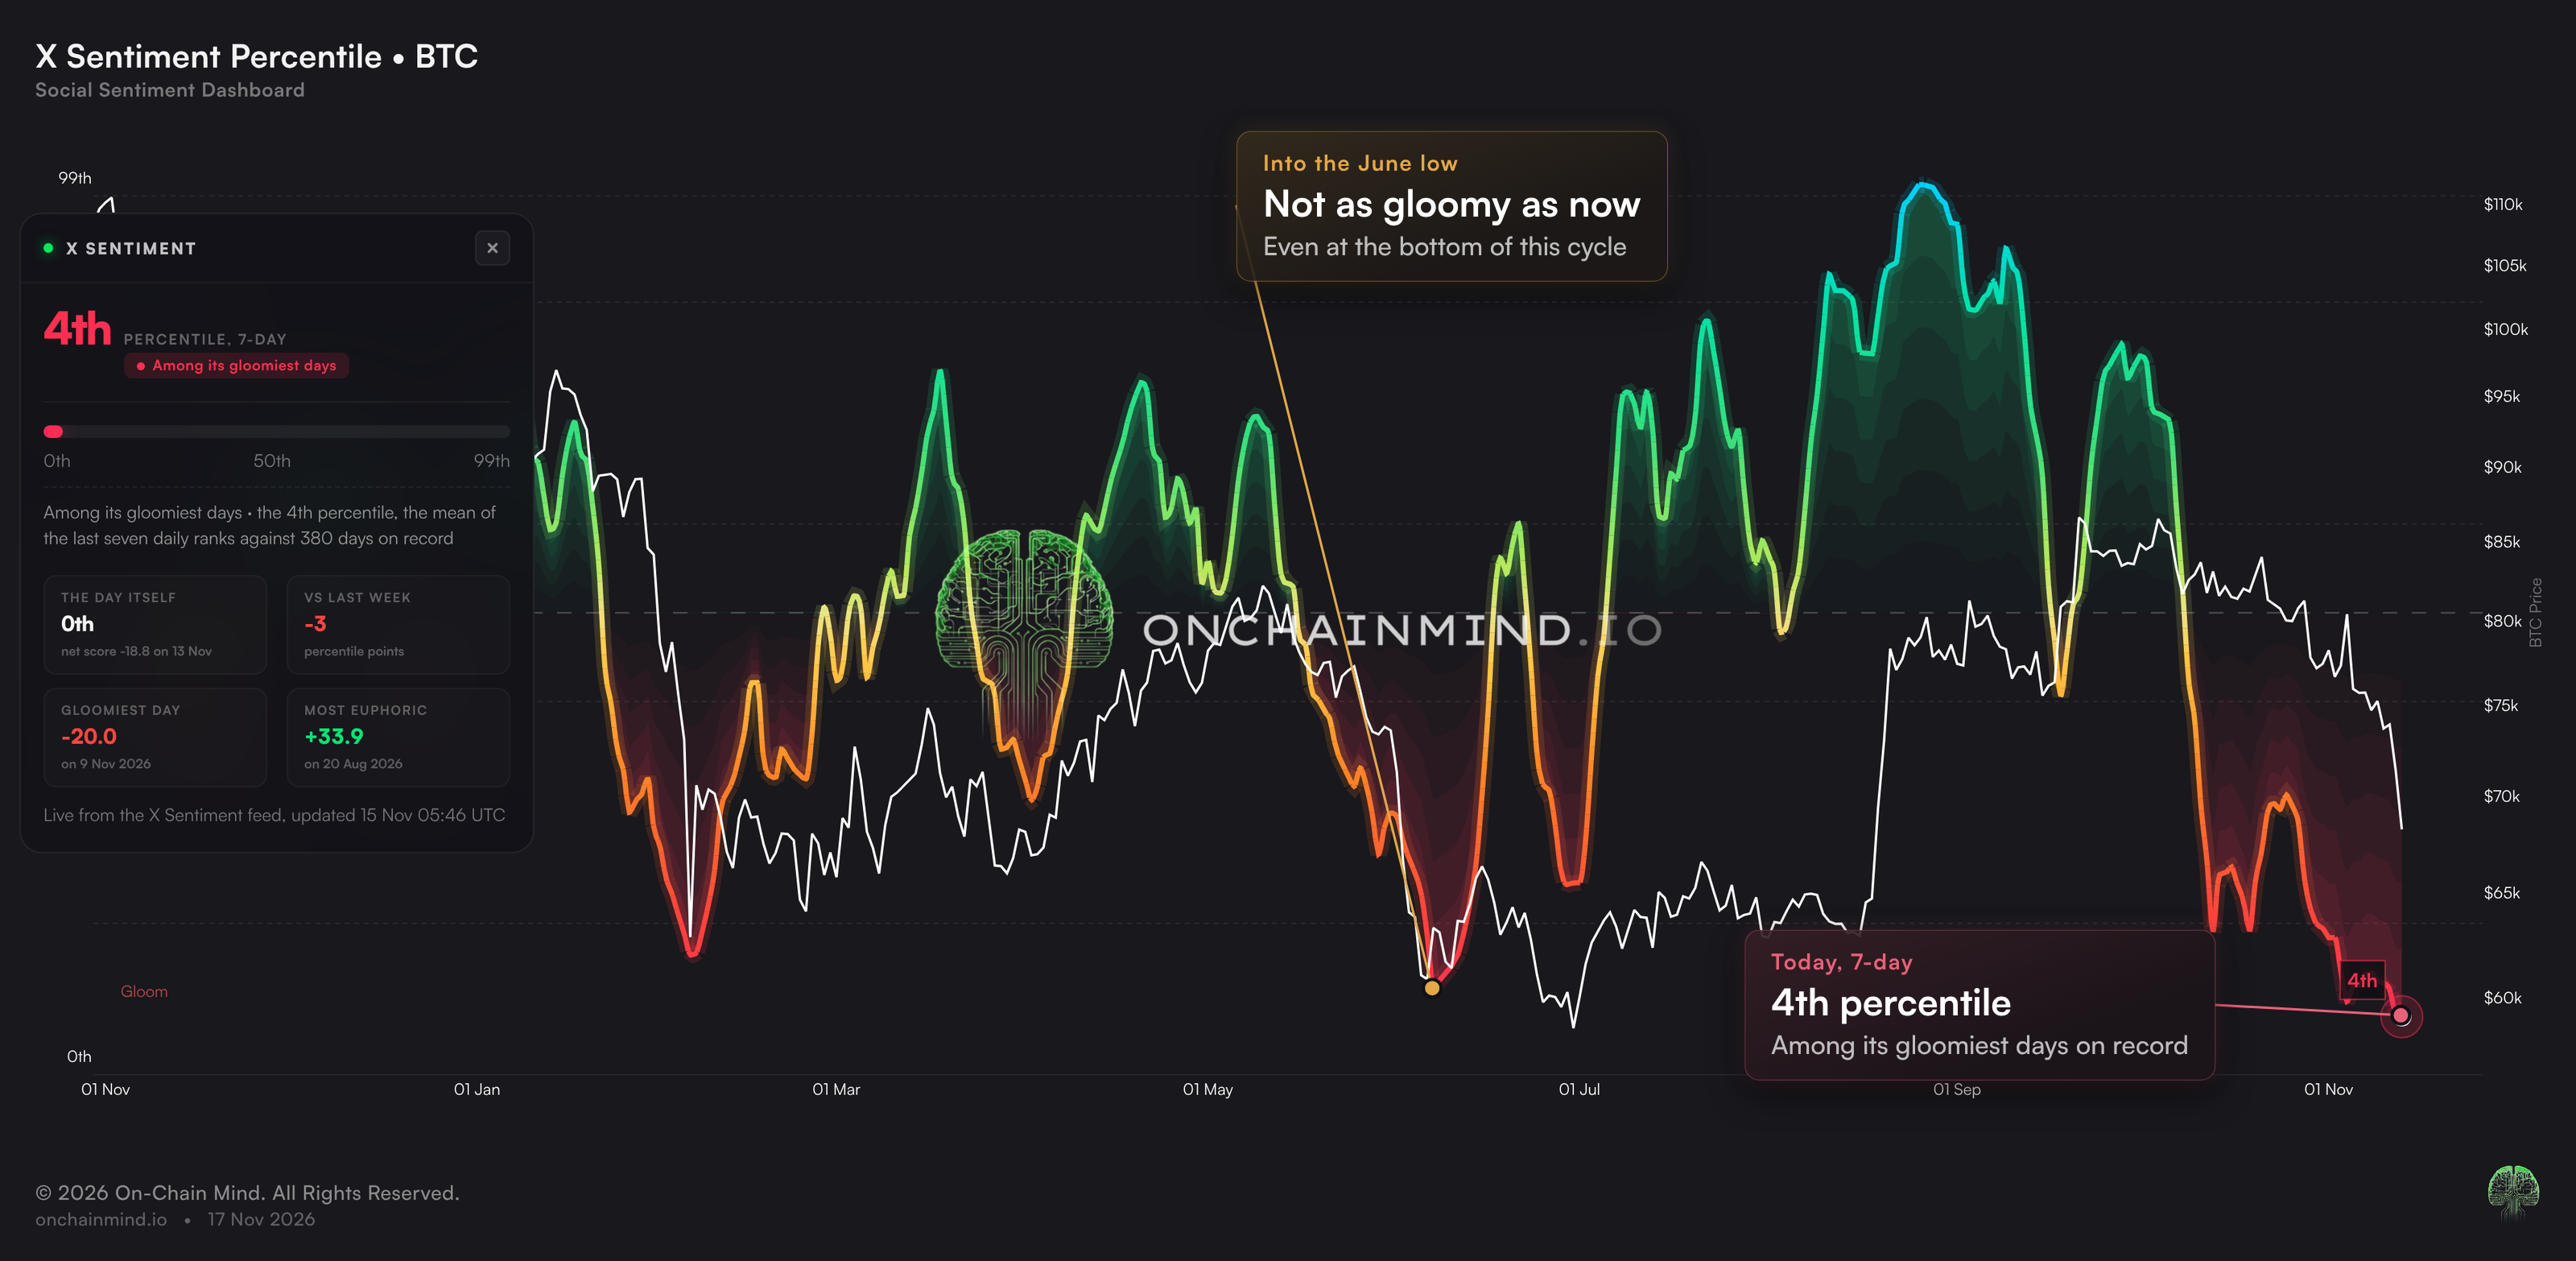
But the one I find much more interesting is our X Sentiment view. Every day, we read a sample of posts about Bitcoin on X, from analysts and retail alike, and label each one bullish, bearish or neutral. That's almost 132,000 posts so far, in a record that goes back to the end of October 2025.
The raw score is the share of bullish posts minus the share of bearish ones. On its own that number is hard to judge, so the Percentile view ranks each day against every other day in the record and averages the last seven ranks, so no single day can swing it.
View live in OCM Studio: X Sentiment Percentile
On that 7-day view, X Sentiment is now at the 4th percentile, among the gloomiest readings in its whole record of 380 days, and it fell another 3 points over the last week.
It's gloomier now than it was going into the June low, which turned out to be the actual bottom of this cycle so far.
Sentiment is a contrarian tool. When almost nobody on X is bullish, most of the people who were going to sell have usually already sold. I love to see it.
Risk Has Halved
Our flagship Omega Score pulls all of this together.
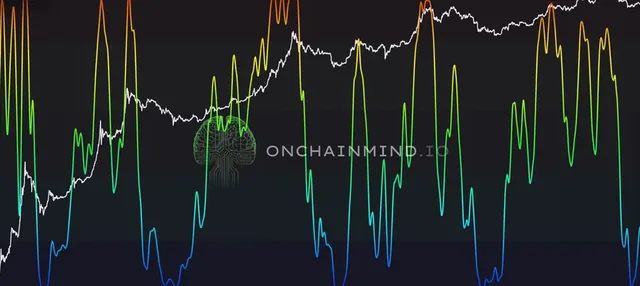
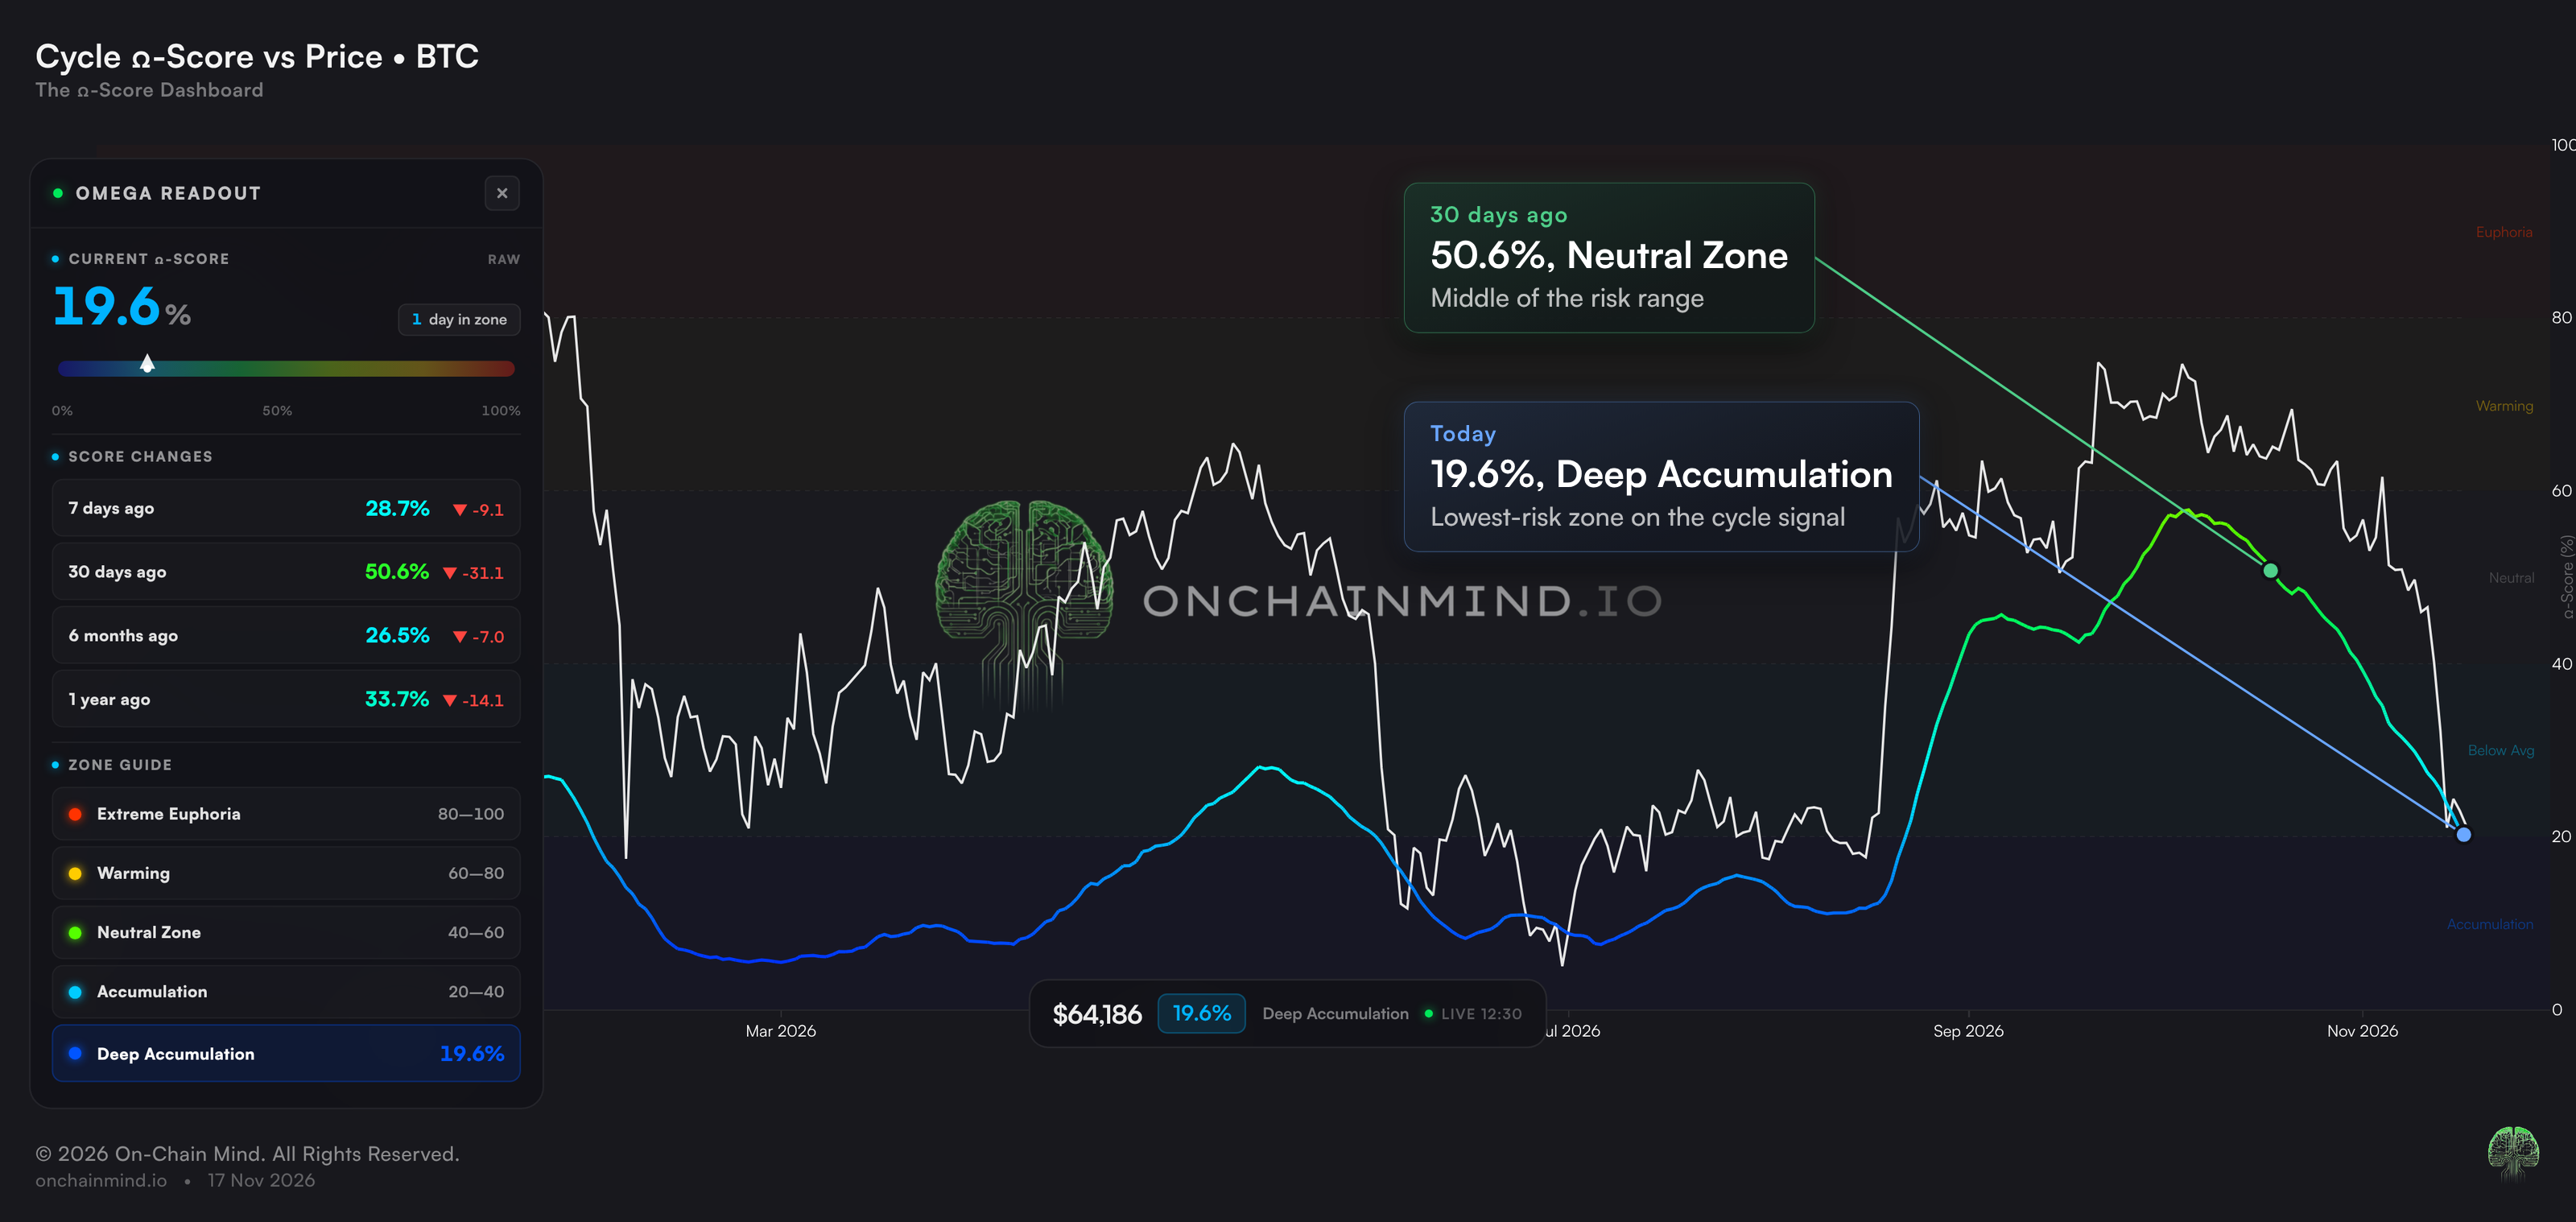
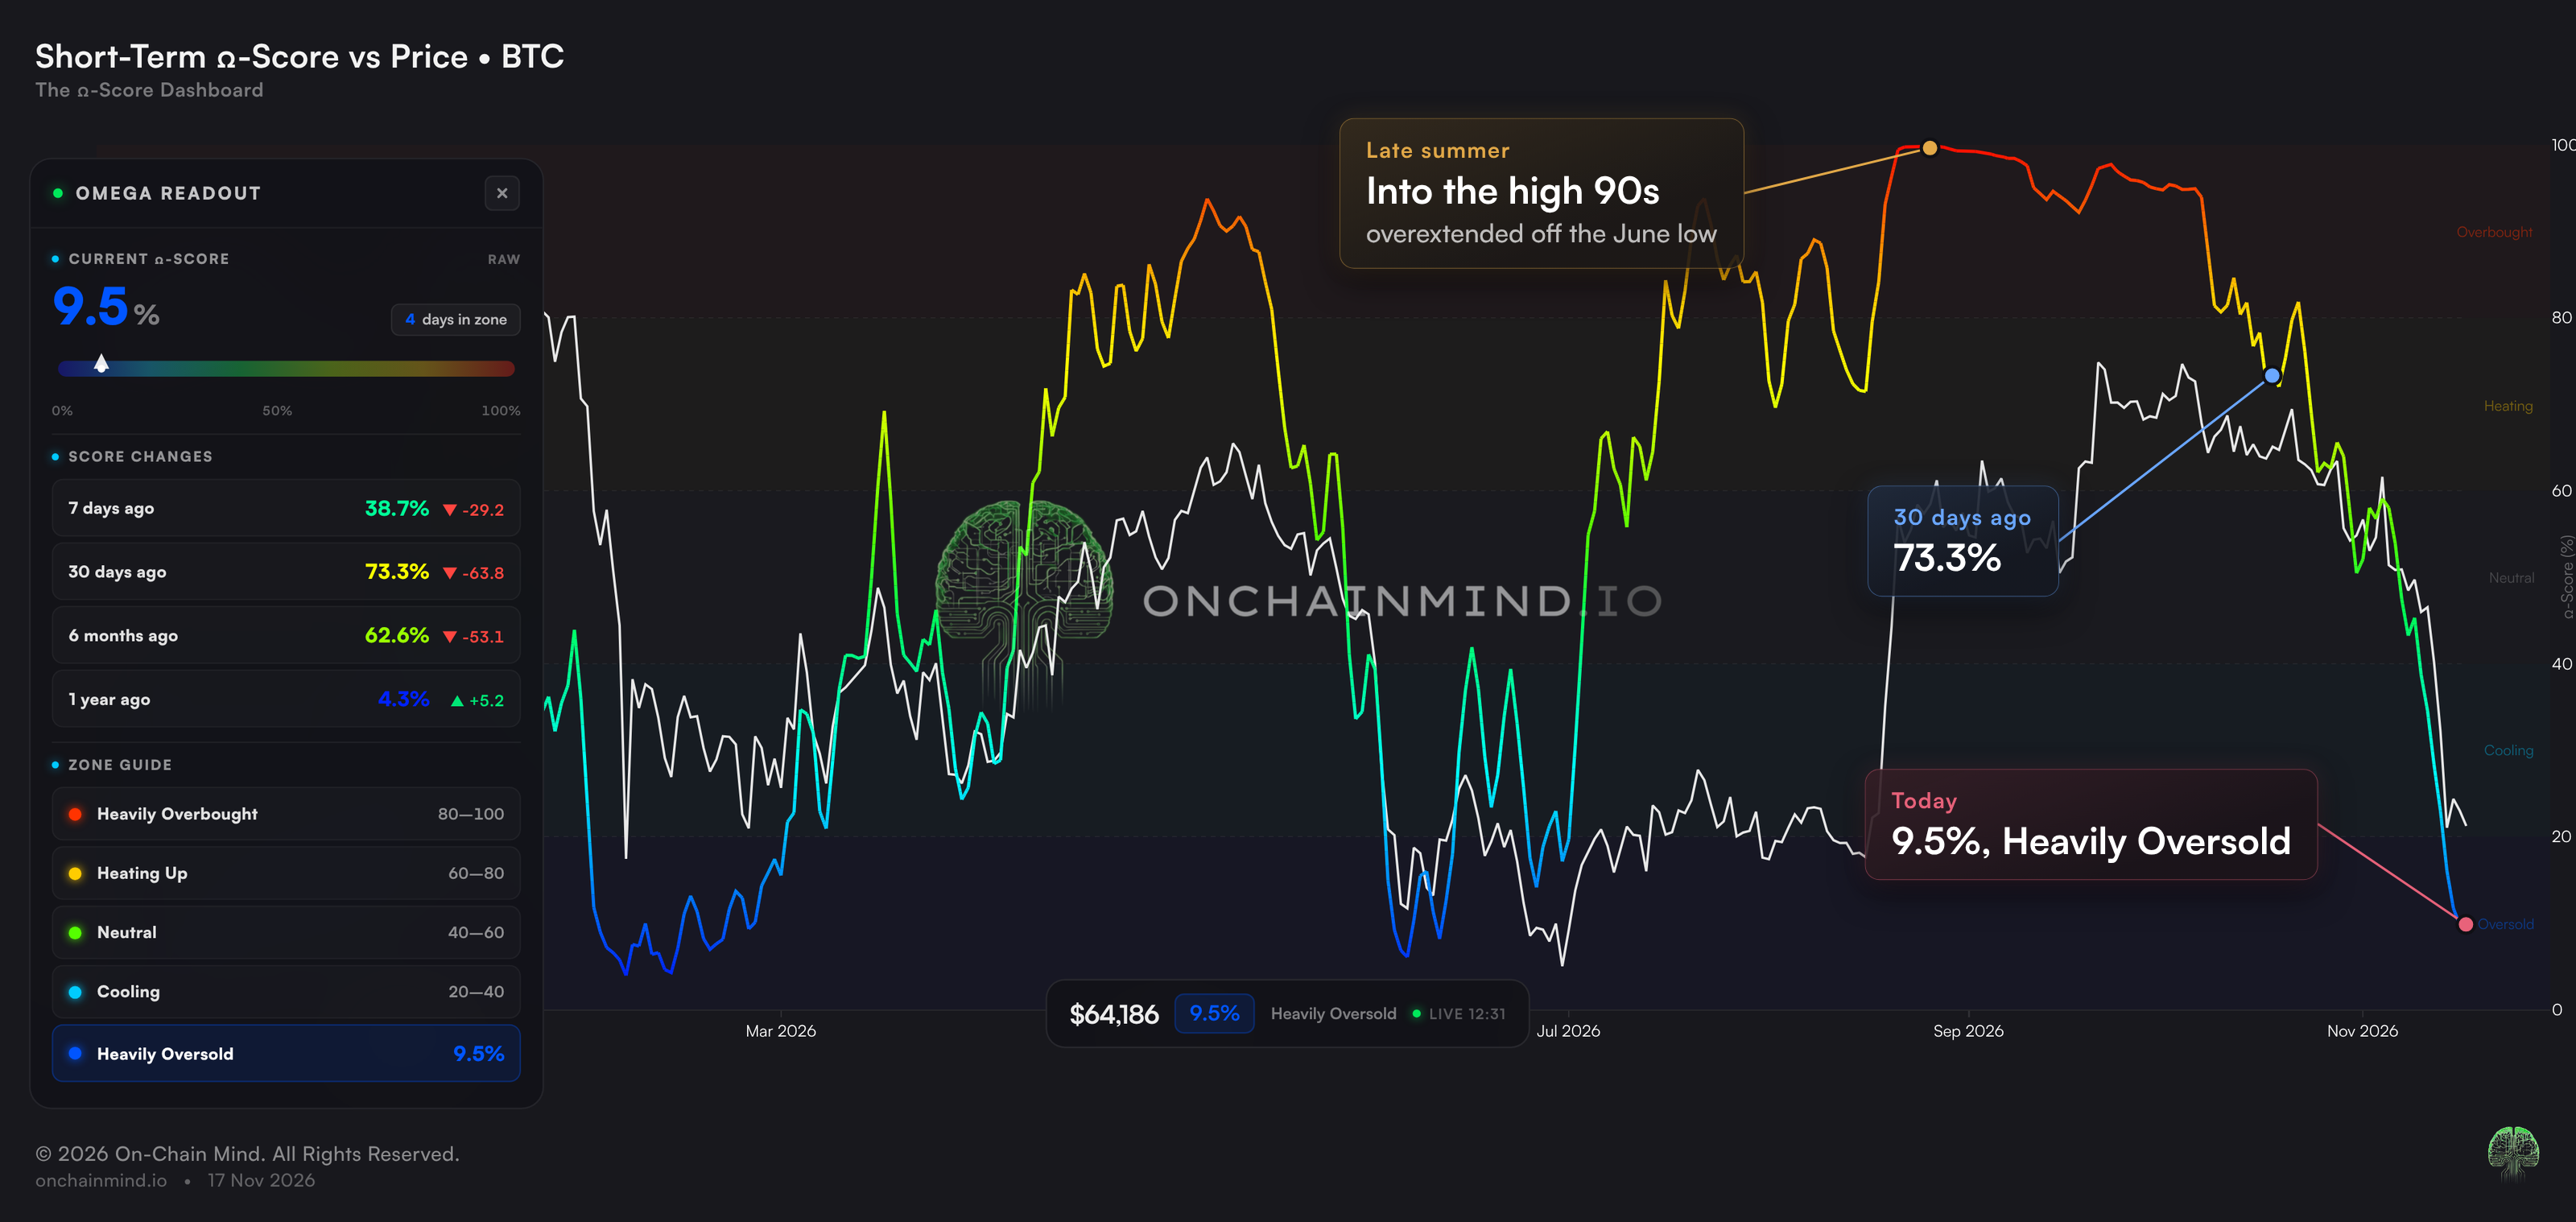
It comes in two flavours. The cycle signal moves slowly and tells you where we are in the bigger picture, so it's the one we use to guide our heavier DCA zones. The short-term signal moves fast and tells you how stretched the market is right now.
Start with the cycle signal.
View live in OCM Studio: Cycle Omega Score
It's at 19.6%, just inside the Deep Accumulation zone, the lowest of its five zones. Just 30 days ago it was at 50.6%, right in the middle of the range, so the risk profile has more than halved in a month.
We use it to guide our heavier DCA zones, and it's back in the one that gets me interested.
The short-term signal is even more dramatic.
View live in OCM Studio: Short-Term Omega Score
In late summer, as price went near vertical off the June low, it shot up into the high 90s, one of the most overextended readings in years, warning that the rally needed to cool off. 30 days ago it was still at 73.3%.
Now it's down to 9.5%, Heavily Oversold. In under three months, it has gone from one extreme to the other.
Cautious for Months, Bullish for Years
Now let's zoom out.
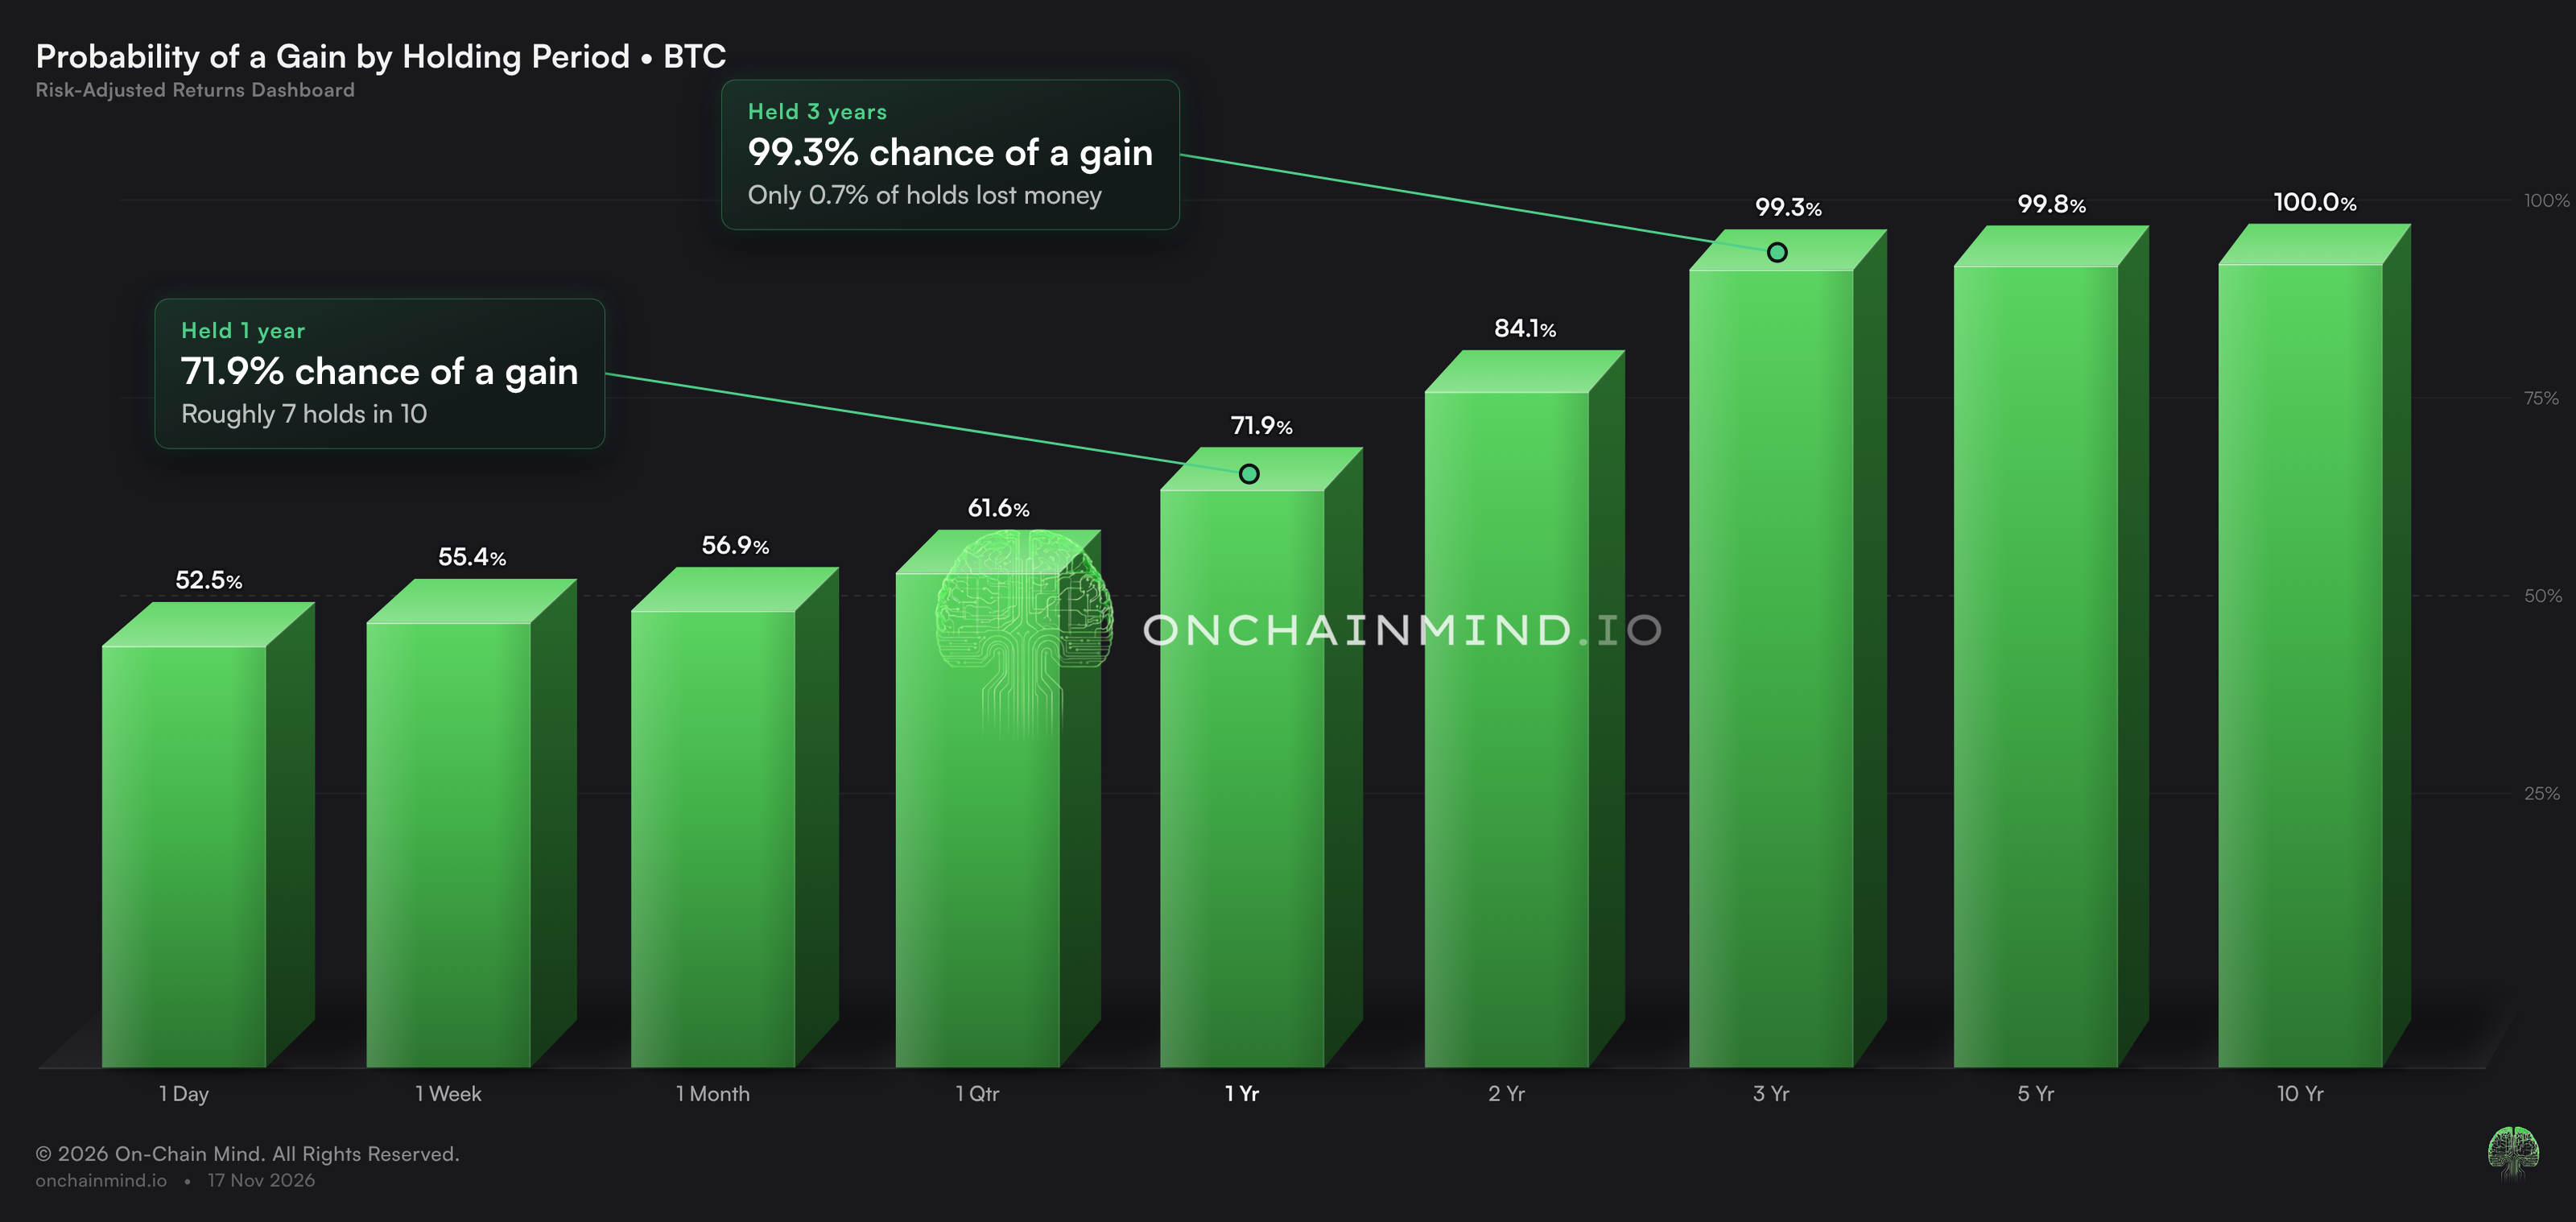
The Profit Probability view on our Risk-Adjusted Returns dashboard asks a simple question: if you'd bought Bitcoin on any random day in its history and held it, what was the chance you'd be in profit at the end?
View live in OCM Studio: Profit Probability
Over a day, it's close to a coin flip, 52.5%. Over a year it rises to 71.9%, roughly seven holds in ten. Held for 3 years, it climbs to 99.3%, and over 5 years to 99.8%.
The longer you hold, the less the short-term noise matters. That's the whole case for patience in one chart.
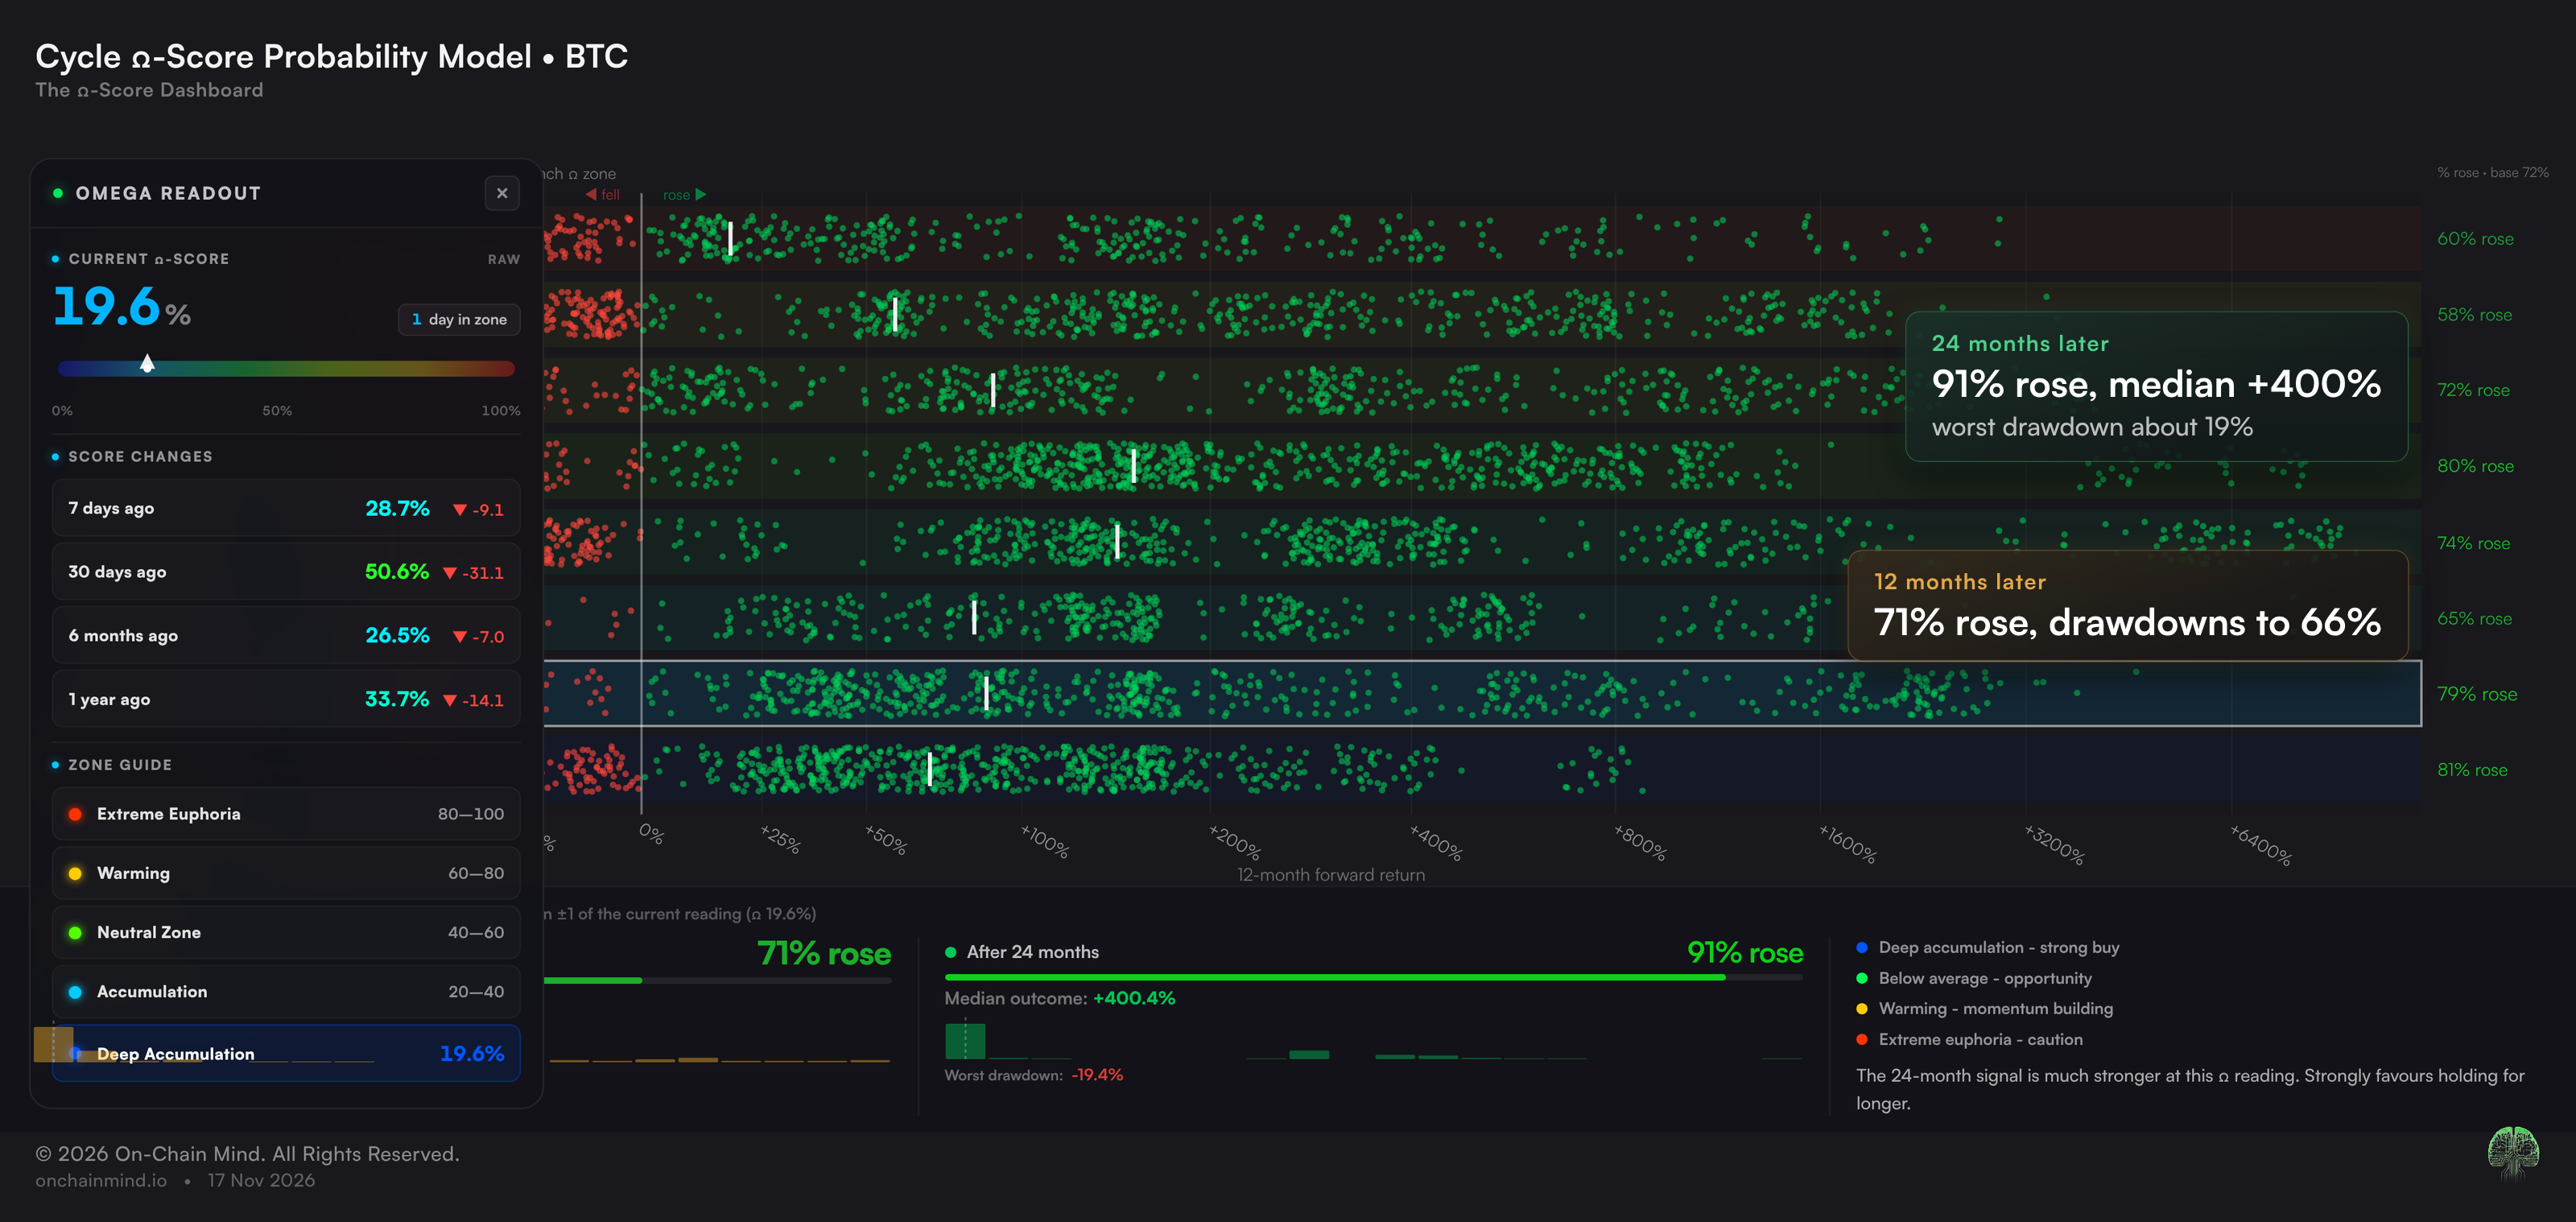
The Omega Score Probability Model asks the same question, but only for days when risk looked like today: every past day with the cycle Omega Score within one point of 19.6%.
View live in OCM Studio: Omega Score Probability Model
24 months later, price was higher 91% of the time, with a median gain of about 400%, and the worst drawdown along the way was about 19%.
Now, I want to be really clear: that is not me calling the bottom. On the 12-month row, price was still higher 71% of the time, but the worst drawdown along the way was 66%. When risk gets this depressed, it tends to stay depressed for a while. These readings can drag on for months, as they did around this year's low.
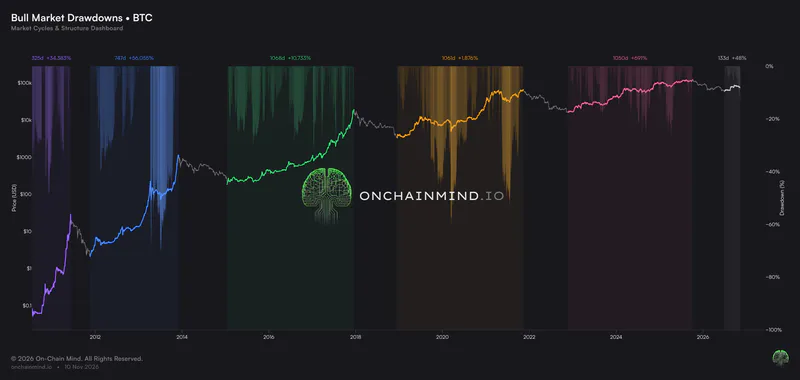
So in the short term, things could easily stay bearish and choppy. On a two-year horizon, history says this is about as good as it gets.
My plan works both ways. If price goes higher from here, great, my portfolio goes up with it. If price goes lower, I get to buy at a historically deep discount, and every time I've had that chance before, I've wished I'd bought more.
Don't panic just because everybody else is.
Be cautious for months and bullish for years. They are not opposites.