

What a difference a month makes. Back in the October Q&A, Bitcoin was sitting at around $83K, above all three key pricing levels, and the questions were all about whether the breakout was the real thing.
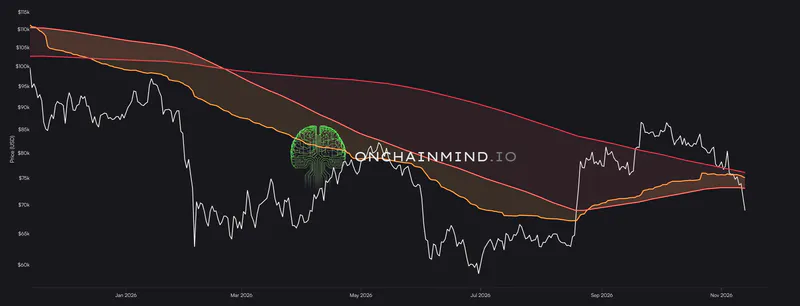
Five weeks later, it's sitting in the low $60Ks. It closed below all three levels on 12th November, wicked to $62.0K over the weekend, and slipped back under the 200-week moving average for the third time this year. A lot of people were caught completely off guard, and judging by your questions, a lot of you want to know whether it's over, where the floor is and what I'm doing about it.
The other theme this month is the calendar. The US midterms came and went earlier this month and the timeline is full of charts claiming a post-midterm rally is "programmed" into the price. I've put that one to the test with the raw data, and I don't think it survives.
We've also got:
Macro
Whether extreme fear is a buy signal
Ethereum
Selling now to buy back lower
And whether a Santa rally is worth waiting for
There's a lot to work through, so let's get stuck in.
1. What Actually Just Happened?
Question: Two weeks ago we were above $75K and everyone was talking about a post-midterm rally. Now we're $10K below and Fear and Greed is back in extreme fear. What actually happened and was that the capitulation or just the start?
My Thoughts: It felt like it came out of nowhere, but it turns out it had been building for a while. Bitcoin's highest close of the rally was $86.6K in late September, and it hasn't closed higher since. A week ago it closed below all three key pricing levels, and three days later it wicked down to $62K. From that September high, that's close to a 30% drawdown in under two months.
So is it over? To answer that properly, you have to separate the two ways a market capitulates.
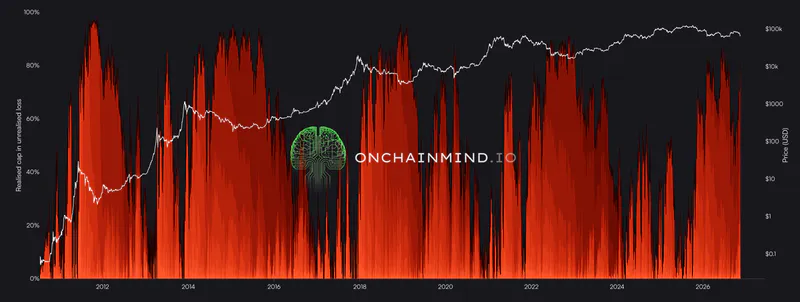
Price capitulation is the violent version. Holders dump coins at a loss all at once, usually with leverage making it worse. You measure it by how much money is realised at a loss, relative to the size of the whole network.
Time capitulation is the slow version. Nobody panics, but recent buyers sit underwater for so long that they eventually give up and sell into any bounce. You measure it by how long they've been below their cost basis.
I went back through every cycle low since 2011 and measured both. Almost nobody looks at capitulation this way, and the result are pretty interesting.
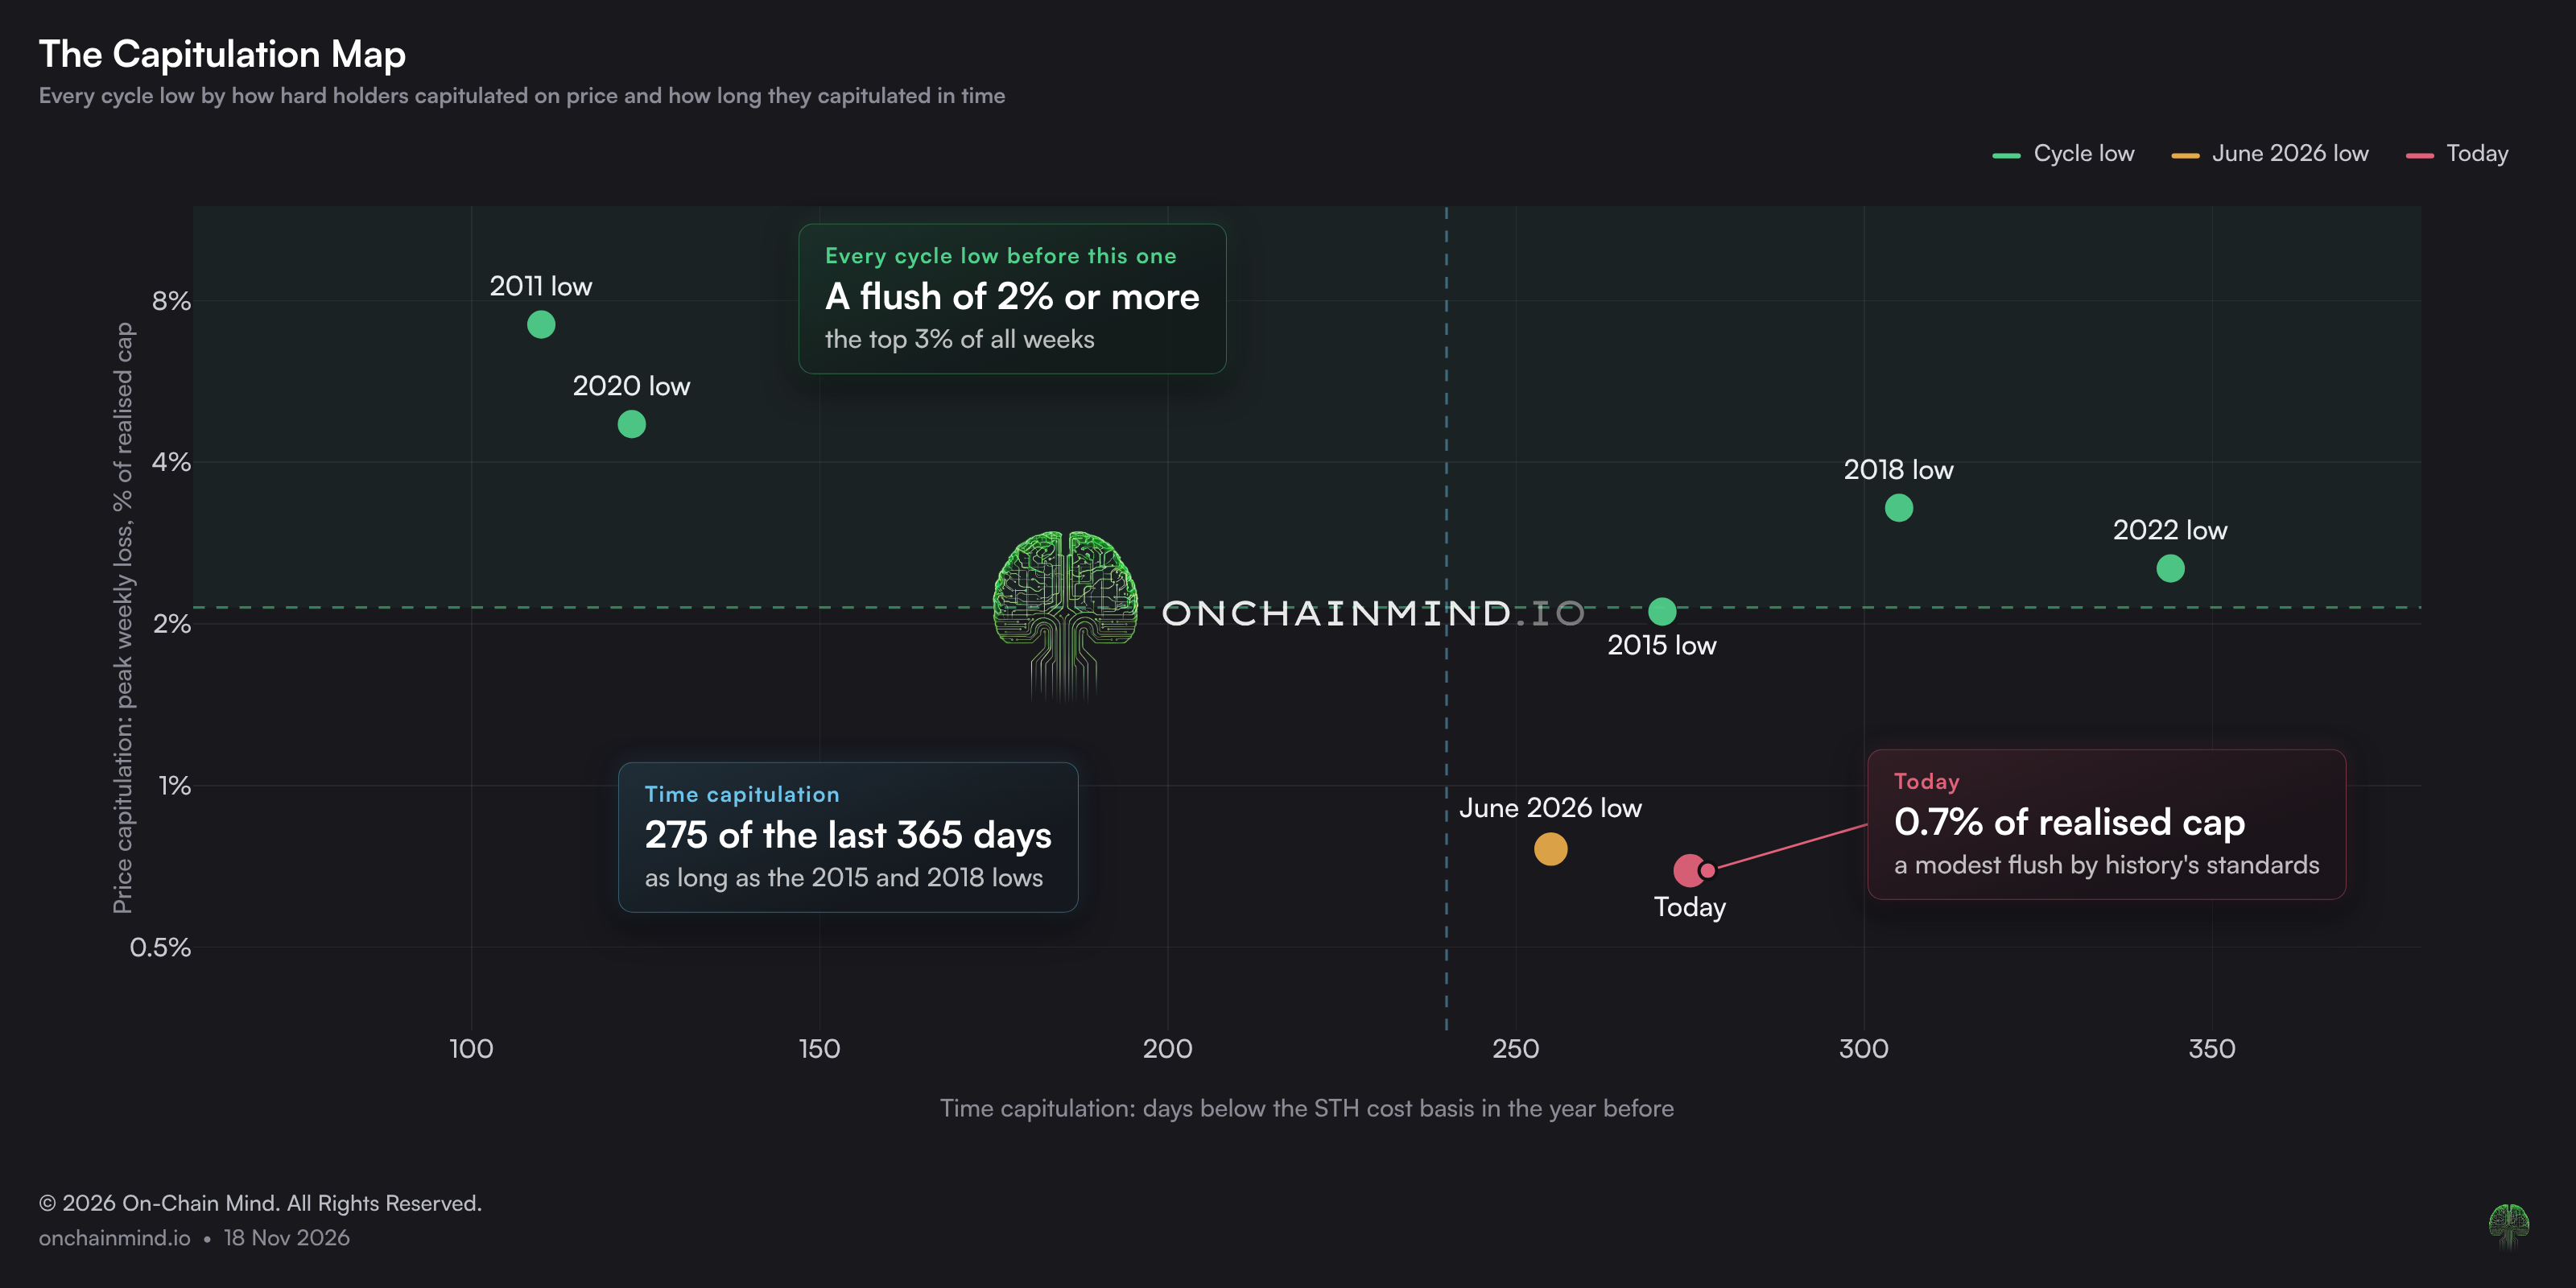
Every cycle low before this one came with a big price capitulation.
In the week around each low, holders realised losses worth at least 2% of Bitcoin's entire realised cap, which puts every one of them in the top 3% of all weeks on record. Some, like 2015, 2018 and 2022, combined that with a long stretch of time capitulation. Others, like 2020, were pure panic.
Now look at this cycle. The past week felt brutal, with about $7.5 billion of realised losses, most of it from people who bought in the last 6 months. But measured against the size of the network, that's only 0.7% of realised cap, a fairly ordinary week by history's standards. Even the June low barely got above that.
What this cycle has had instead is time. Price has been below the short-term holder cost basis on 275 of the last 365 days, right in line with the lows of 2015 and 2018.
So this cycle is capitulating through time rather than price, which is new. There are two ways to read that:
The bearish read: the big flush hasn't happened yet. To match a historic capitulation today, holders would need to realise something like $23 billion of losses in a single week, about three times what we just saw.
The maturing read: a bigger, less volatile asset, with more long-term owners, may simply not flush like it used to. The pain gets spread out over months instead of compressed into a week.
I can't rule out either, and that's exactly why I'm not calling the bottom. As I said earlier this week: "Be cautious for months and bullish for years. They are not opposites."
I'll show you what I'm doing in a later question.
2. Is the Midterm Rally Programmed Into Bitcoin?
Question: Some famous analysts say midterm years always see Bitcoin weaken into Q4 and then rally hard after the election, and that price has gone up in the 12 months after every midterm. Is this true? And also what does it mean for price?
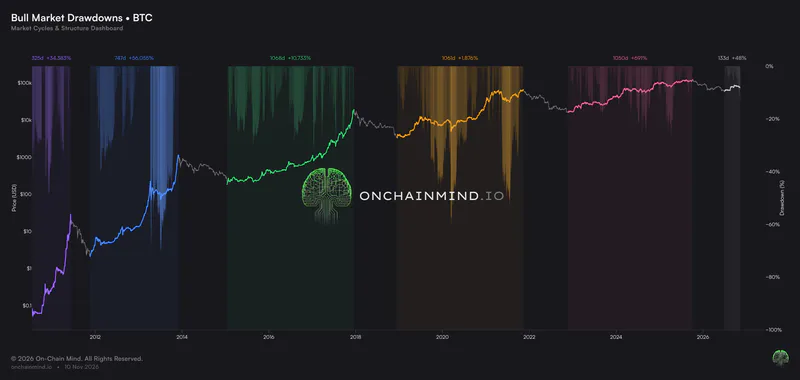
My Thoughts: No. It's the same three data points as the 4-year cycle, wearing a different hat.
Let's start with what is true.
Bitcoin was higher 12 months after each of the last three midterms: +24% after 2014, +44% after 2018 and +92% after 2022. That's where the "average gain of over 50%" doing the rounds comes from.
The problem is that being up a year later is what Bitcoin does on most days. Since 2011, 71% of all 12-month holds ended in profit. Pick any three random dates and the chance of all three being up a year later is roughly 1 in 3.
That's why none of this "analysis" is a signal. That's a coin flip with a bias.
So I tested it properly. I took every single day of the 4-year calendar, 1,417 of them, and asked the same question of each: was Bitcoin higher 12 months later in the 2014, 2018 and 2022 cycles?
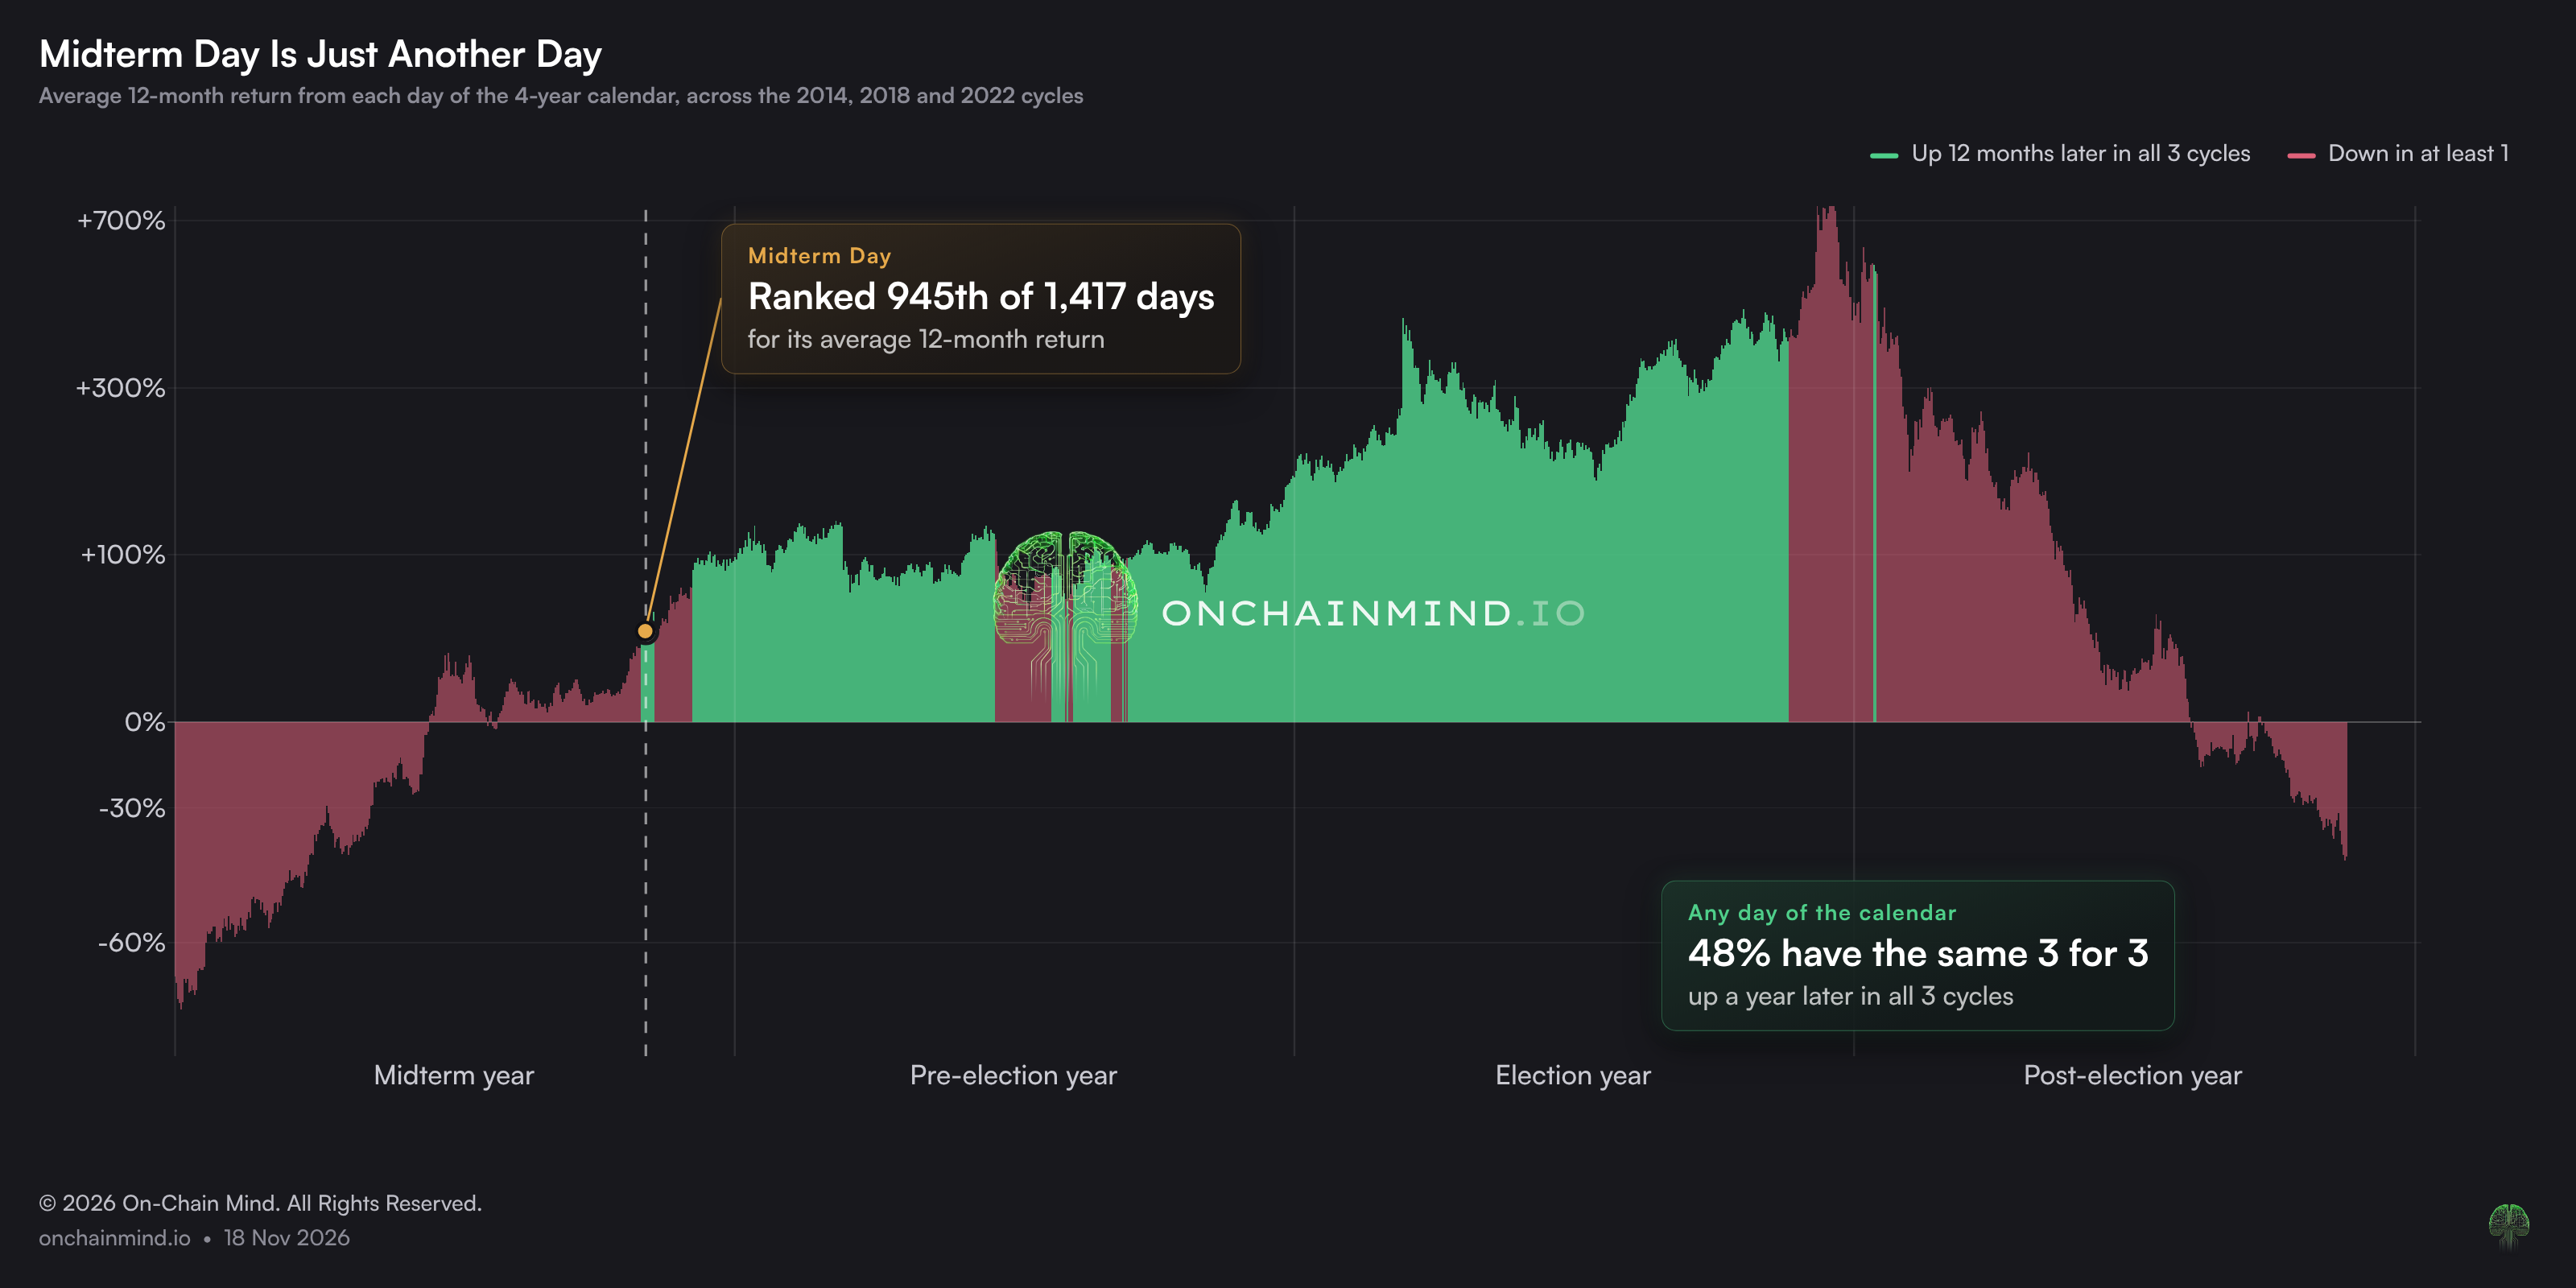
48% of those days have exactly the same perfect 3 for 3 record.
Midterm Day isn't special at all. On average return it ranks 945th out of 1,417, below the middle of the pack. Even inside Q4 of the midterm year itself, only 36 of its 92 days score 3 for 3.
Then there's the bit that should really end this debate.
The midterms land in exactly the same years as everything else people pin the 4-year cycle on. They come round at the same pace as the halvings and the old bull and bear calendar, so there's simply no way to tell a "midterm effect" apart from any other 4-year story. As I wrote on 9th October, that was always "a good story told about 3 data points."
And let's look at what the programmed rally actually looked like:
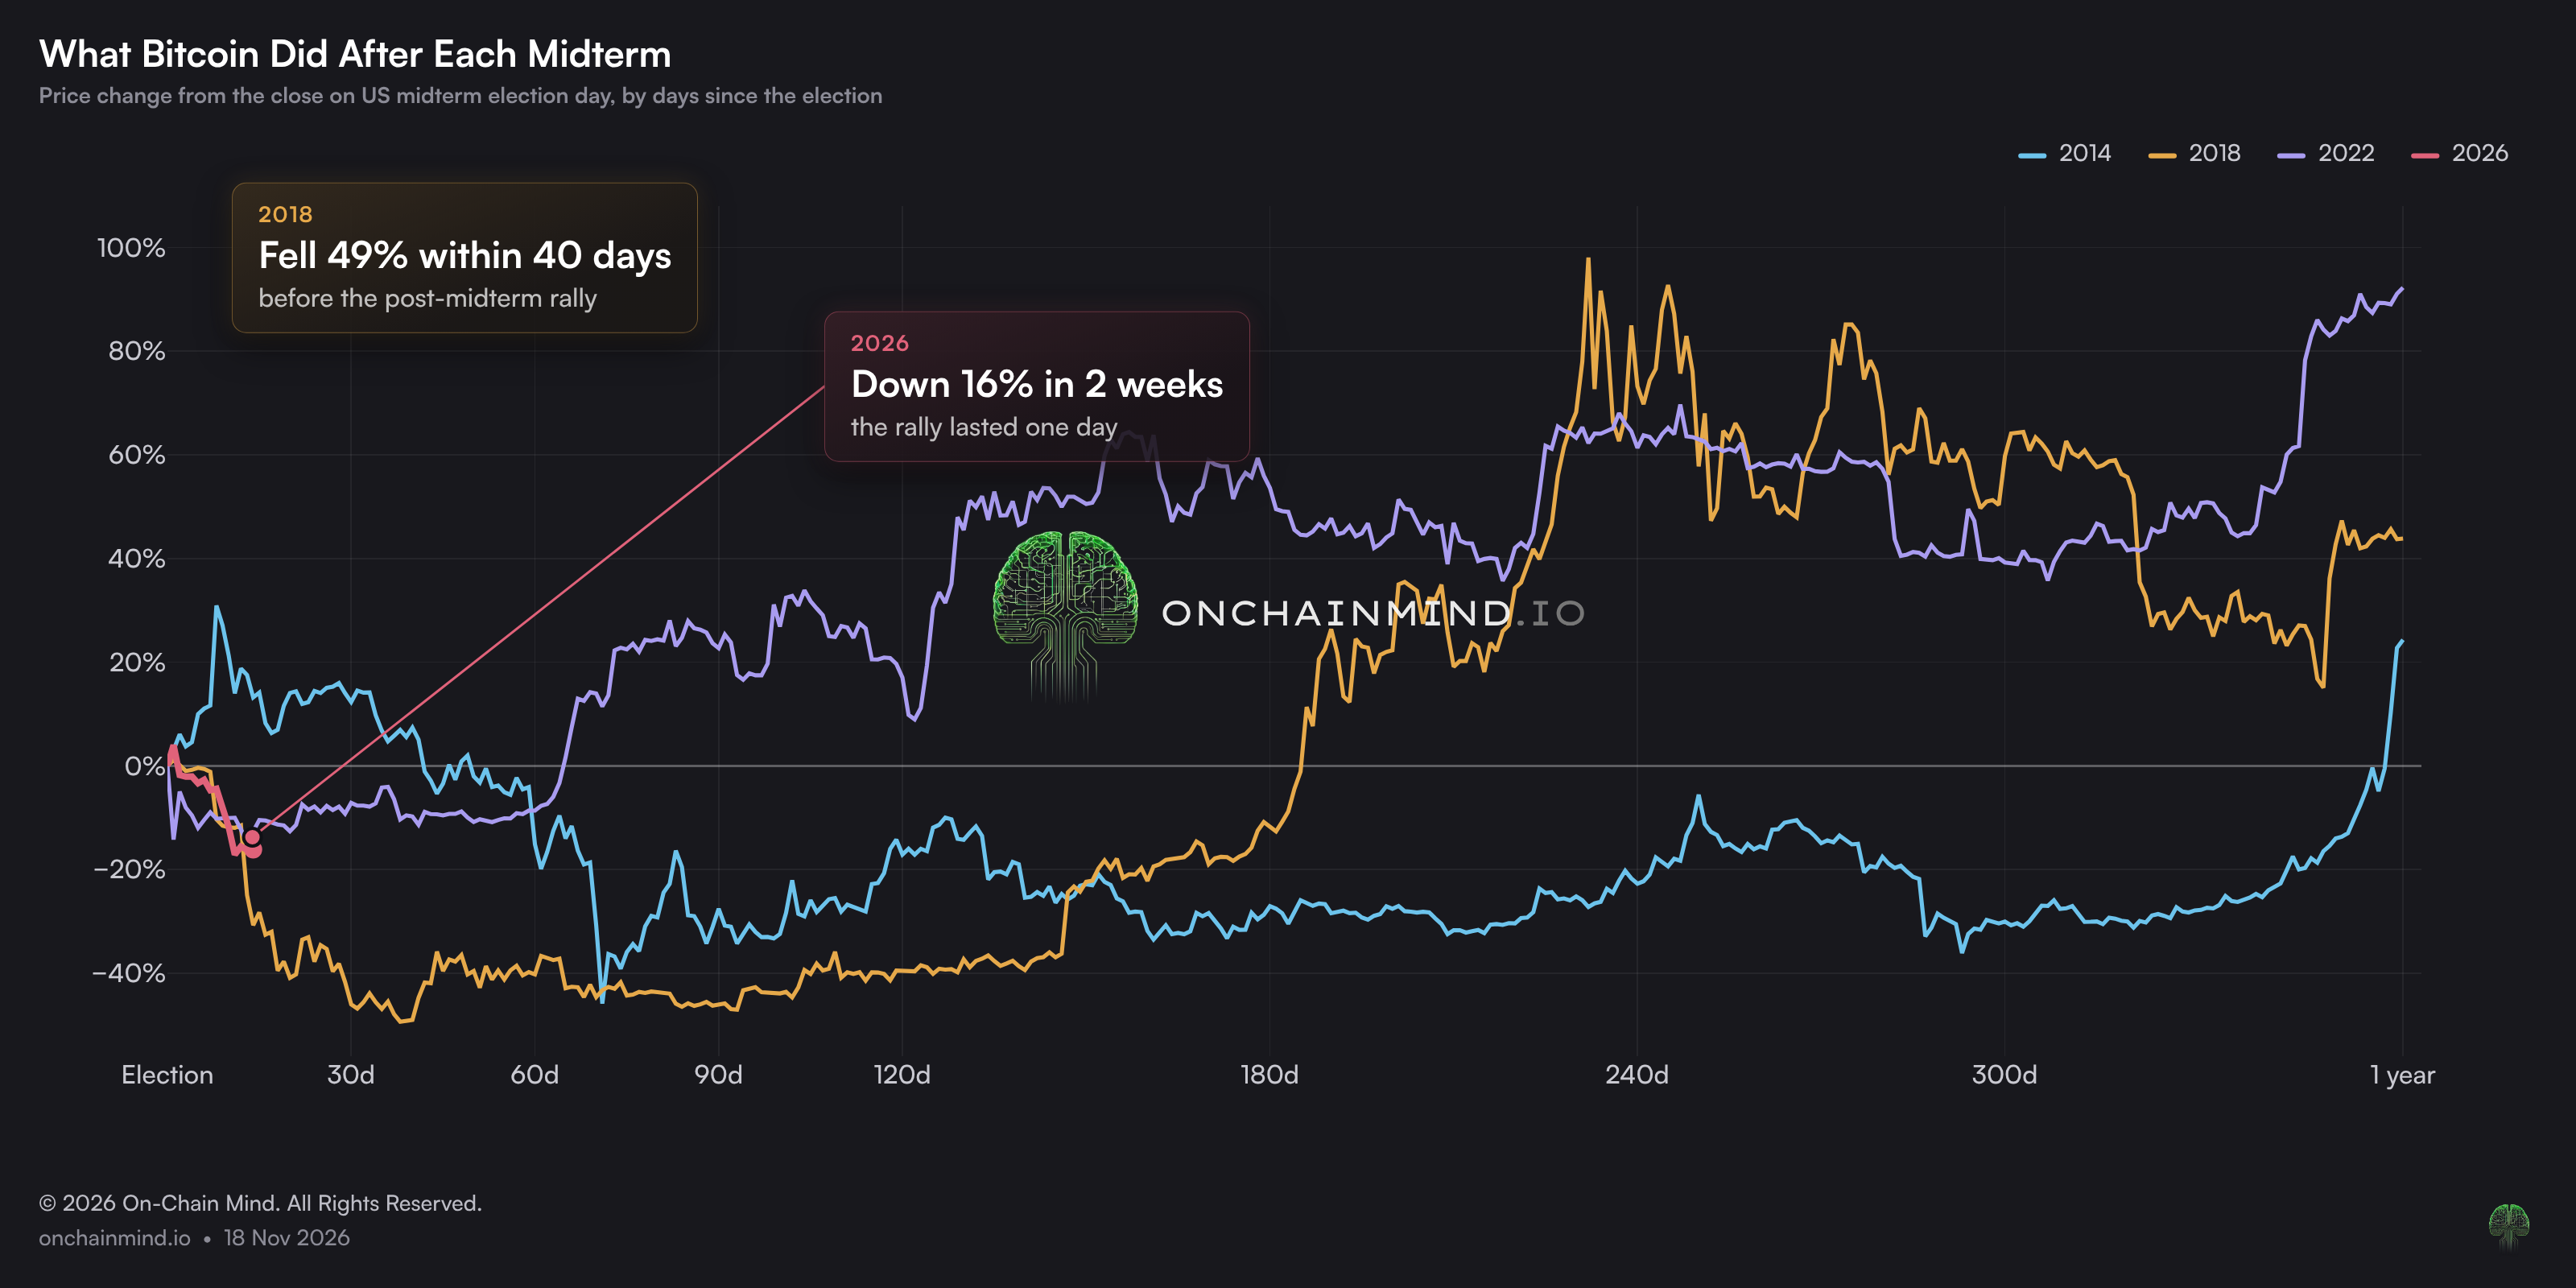
If the rally really were programmed, you'd expect price to start rising soon after the vote. It didn't.
After the 2018 midterm, Bitcoin almost halved over the next six weeks before it went anywhere. After 2014, it fell by nearly as much over the following couple of months. Only 2022 bottomed quickly, and that low came from the collapse of FTX, not from the ballot box.
This year, the "rally" lasted exactly one day. Bitcoin jumped to just over $80K the day after the vote, and two weeks later it was about 16% below where it closed on the day of the vote.
Sit down and think about it for two minutes, and you just have to ask: why would a US midterm vote set the price of a 24/7 global monetary network? The reasons for this sell-off are measurable: recent buyers underwater, a leverage flush and a risk-off move in stocks.
You know my opinion on the 4-year cycle very well by now. This latest piece of "analysis" winds me up even more, because it's even less statistically rigorous. Bitcoin's supply and demand is far more nuanced than a date on a political calendar, and spreading reasoning this naive does real damage to the people who actually trade on it.
If you want to know what Bitcoin does after the midterms, watch the network, not the ballot box.
3. Below the 200-Week: Where Is the Real Floor?
Question: We're back below the 200-week moving average. If the June low of $58.6K goes, where is the real bottom, and at what point would you go all in?
Continue reading with OCM Premium
You have been reading the free preview of this article. The rest of it (about 2,350 more words and 3 more charts) is for OCM Premium members. See OCM Premium plans.